| Param | Original file | Final file |
|---|---|---|
| Filename | modeM0/AS1A02_090T02_9000000956cztM0_level2.fits | modeM0/AS1A02_090T02_9000000956cztM0_level2_quad_clean.evt |
| Size (bytes) | 1,299,925,440 | 1,189,909,440 |
| Size | 1.2 GB | 1.1 GB |
| Events in quadrant A | 7,852,092 | 6,876,580 |
| Events in quadrant B | 7,512,092 | 6,858,952 |
| Events in quadrant C | 7,792,508 | 6,655,216 |
| Events in quadrant D | 6,701,504 | 6,136,807 |
| Mode M0 | |||
|---|---|---|---|
| Quadrant | BADHDUFLAG | Total packets | Discarded packets |
| A | 0 | 286518 | 0 |
| B | 0 | 304149 | 0 |
| C | 0 | 284691 | 0 |
| D | 0 | 312741 | 0 |
| Mode SS | |||
|---|---|---|---|
| Quadrant | BADHDUFLAG | Total packets | Discarded packets |
| A | 0 | 2834 | 0 |
| B | 0 | 2834 | 0 |
| C | 0 | 2834 | 0 |
| D | 0 | 2834 | 0 |
| Mode M9 | |||
|---|---|---|---|
| Quadrant | BADHDUFLAG | Total packets | Discarded packets |
| A | 0 | 212 | 0 |
| B | 0 | 212 | 0 |
| C | 0 | 212 | 0 |
| D | 0 | 212 | 0 |
| Quadrant | Total seconds | Saturated seconds | Saturation percentage |
|---|---|---|---|
| A | 138755 | 1546 | 1.114194% |
| B | 138759 | 2662 | 1.918434% |
| C | 138782 | 1110 | 0.799816% |
| D | 138763 | 1905 | 1.372844% |
Noise dominated data is calculated using 1-second bins in cleaned event files. If a bin has >2000 counts, and if more than 50% of those come from <1% of pixels, then it is considered to be noise-dominated and hence unusable.
| Quadrant | # 1 sec bins | Bins with >0 counts | Bins with >2000 counts | High rate bins dominated by noise | Noise dominated (total time) | Noise dominated (detector-on time) | Marked lightcurve |
|---|---|---|---|---|---|---|---|
| A | 160522 | 138845 | 0 | 0 | 0.00% | 0.00% |  |
| B | 160522 | 138839 | 0 | 0 | 0.00% | 0.00% |  |
| C | 160522 | 138867 | 0 | 0 | 0.00% | 0.00% |  |
| D | 160522 | 138845 | 0 | 0 | 0.00% | 0.00% |  |
Top three noisy pixels from each quadrant. If the there are fewer than three noisy pixels in the level2.evt file, extra rows are filled as -1
| Pixel properties | Quadrant properties | ||||||
|---|---|---|---|---|---|---|---|
| Quadrant | DetID | PixID | Counts | Sigma | Mean | Median | Sigma |
| A | 0 | 29 | 7529 | 10.94 | 2040 | 1902 | 514.2 |
| A | 7 | 110 | 6618 | 9.17 | 2040 | 1902 | 514.2 |
| A | 0 | 30 | 5899 | 7.77 | 2040 | 1902 | 514.2 |
| B | 2 | 9 | 6436 | 11.49 | 1985 | 1883 | 396.2 |
| B | 12 | 226 | 5222 | 8.43 | 1985 | 1883 | 396.2 |
| B | 14 | 254 | 5153 | 8.25 | 1985 | 1883 | 396.2 |
| C | 1 | 80 | 5784 | 7.16 | 2058 | 1902 | 542.2 |
| C | 1 | 81 | 5697 | 7.0 | 2058 | 1902 | 542.2 |
| C | 12 | 241 | 5428 | 6.5 | 2058 | 1902 | 542.2 |
| D | 6 | 231 | 4995 | 6.43 | 1915 | 1745 | 505.7 |
| D | 3 | 14 | 4972 | 6.38 | 1915 | 1745 | 505.7 |
| D | 7 | 5 | 4810 | 6.06 | 1915 | 1745 | 505.7 |
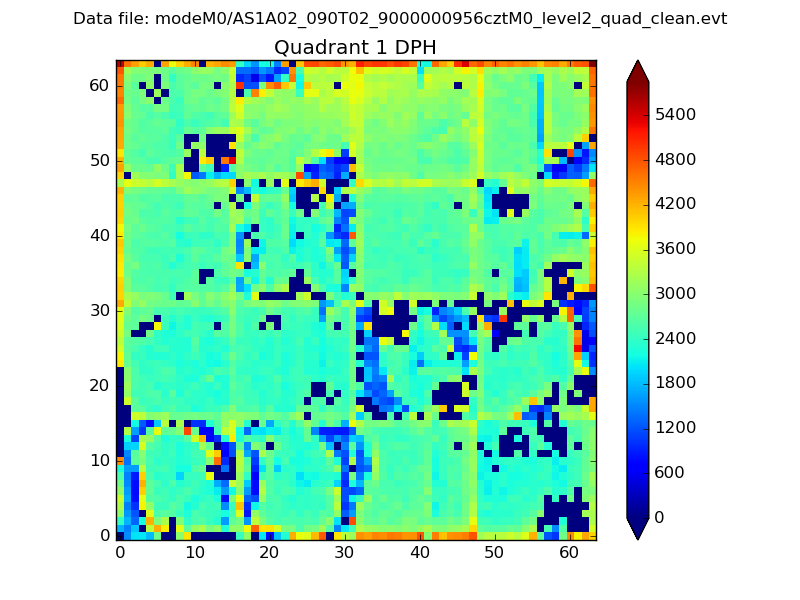
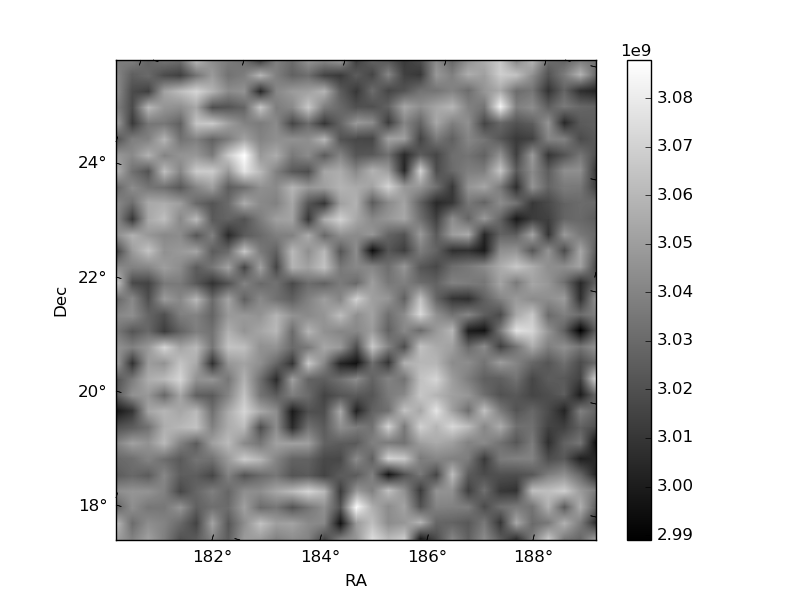
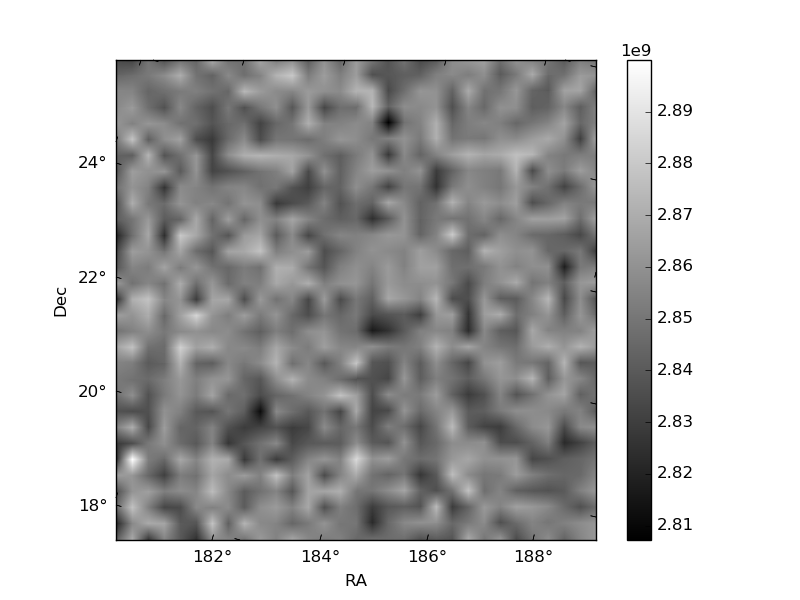
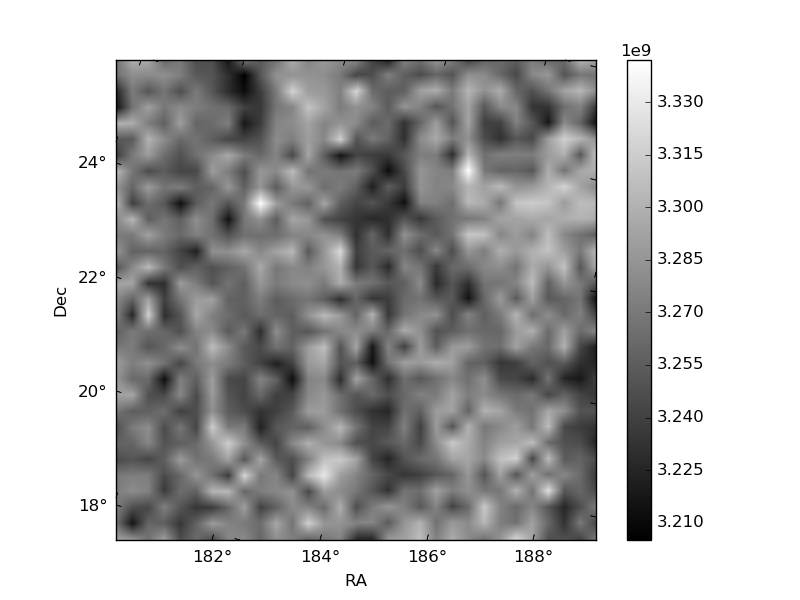
Histogram calculated using DETX and DETY for each event in the final _common_clean file
| Quadrant A |  |
 |
Quadrant B |
|---|---|---|---|
| Quadrant D | 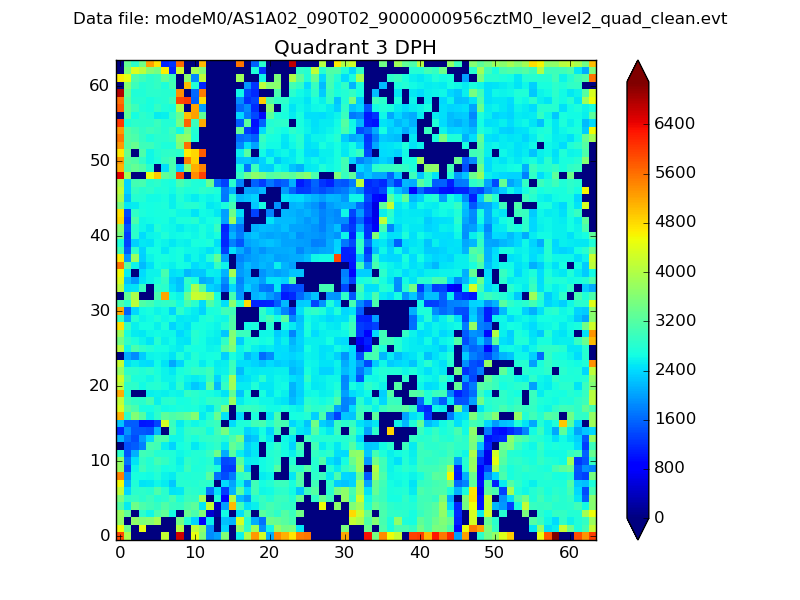 |
 |
Quadrant C |
| Plot type | Count rate plots | Images |
|---|---|---|
| Comparison with Poisson distribution Blue bars denote a histogram of data divided into 1 sec bins. Red curve is a Poisson curve with rate = median count rate of data. |
 |
 |
| Quadrant-wise count rates Data is divided into 100 sec bins |
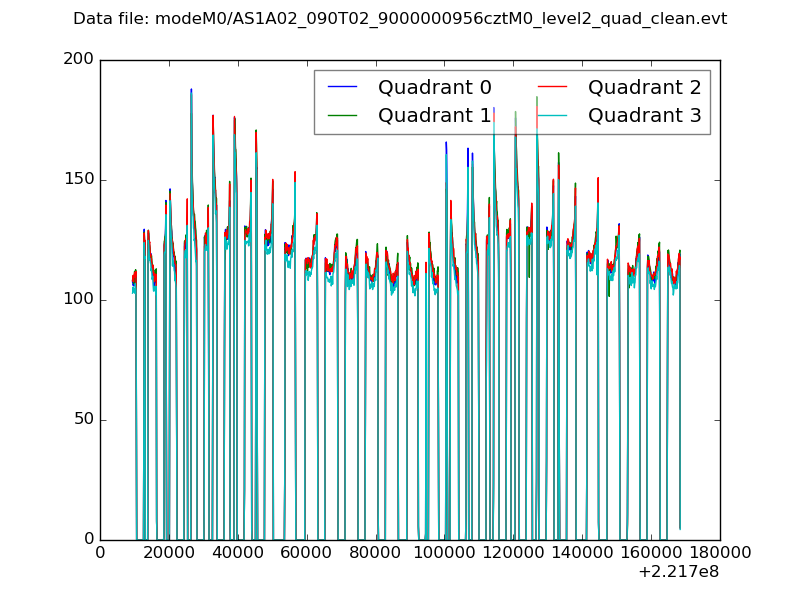 |
|
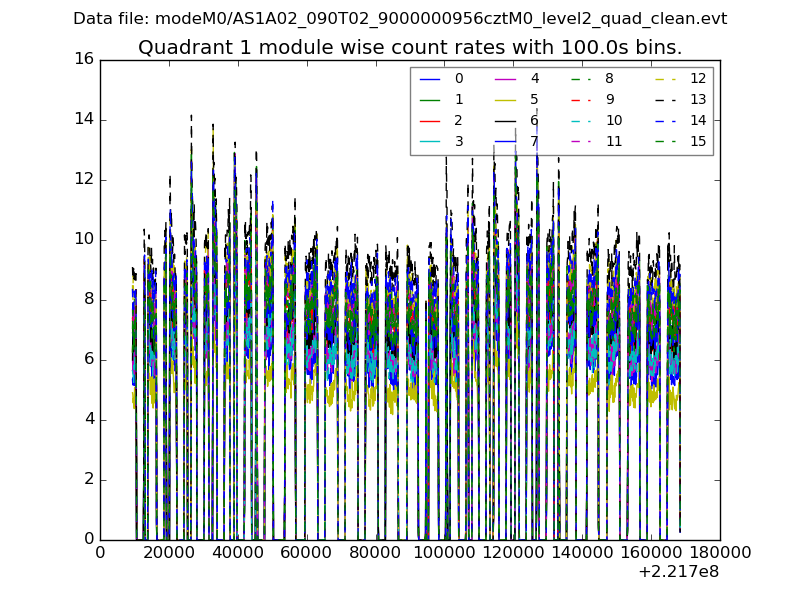
| Module-wise count rates for Quadrant A Data is divided into 100 sec bins |
 |
 |
| Module-wise count rates for Quadrant B Data is divided into 100 sec bins |
 |
 |
| Module-wise count rates for Quadrant C Data is divided into 100 sec bins |
 |
 |
| Module-wise count rates for Quadrant D Data is divided into 100 sec bins |
 |
 |
| Parameter | Plot |
|---|---|
| CZT HV Monitor |  |
| D_VDD |  |
| Temperature 1 |  |
| Veto HV Monitor | 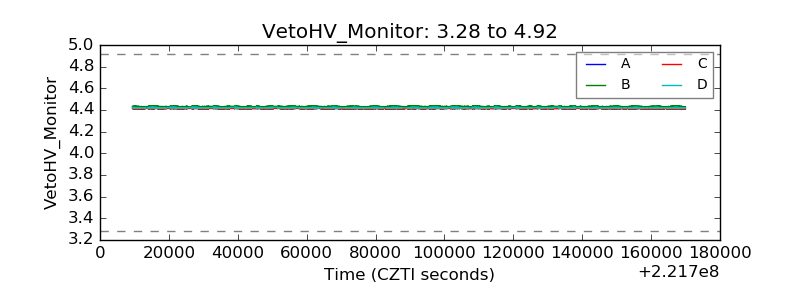 |
| Veto LLD |  |
| Alpha Counter |  |
| _CPM_Rate | 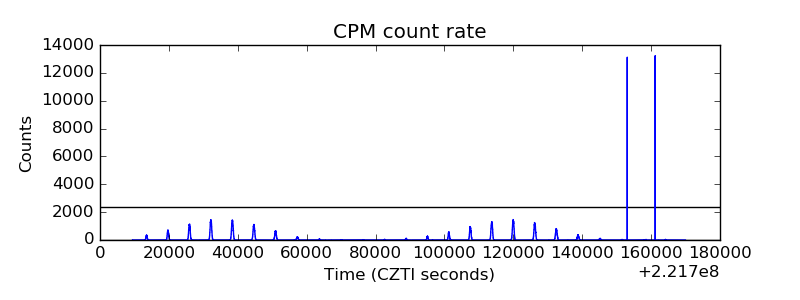 |
| CZT Counter | 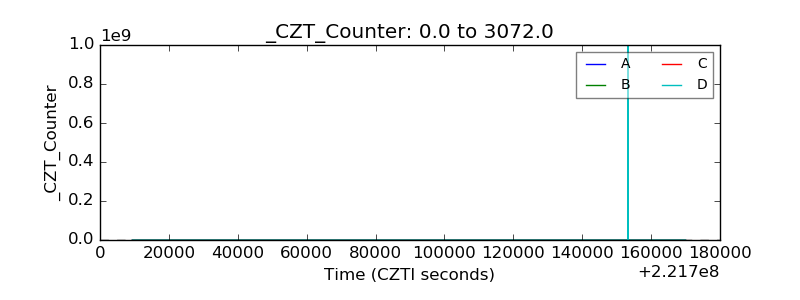 |
| +2.5 Volts monitor |  |
| +5 Volts monitor |  |
| _ROLL_ROT |  |
| _Roll_DEC |  |
| _Roll_RA |  |
| Veto Counter | 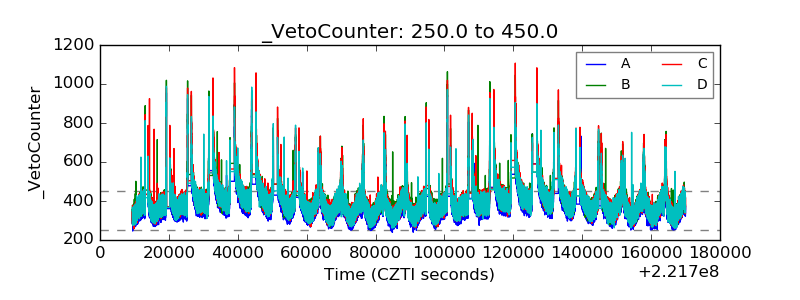 |