| Param | Original file | Final file |
|---|---|---|
| Filename | modeM0/AS1A02_090T02_9000000956_06956cztM0_level2.evt | modeM0/AS1A02_090T02_9000000956_06956cztM0_level2_quad_clean.evt |
| Size (bytes) | 333,541,440 | 60,122,880 |
| Size | 318.1 MB | 57.3 MB |
| Events in quadrant A | 2,382,854 | 363,101 |
| Events in quadrant B | 2,477,714 | 367,110 |
| Events in quadrant C | 2,334,719 | 366,580 |
| Events in quadrant D | 2,543,861 | 351,477 |
| Mode M0 | |||
|---|---|---|---|
| Quadrant | BADHDUFLAG | Total packets | Discarded packets |
| A | 0 | 10823 | 2 |
| B | 0 | 10963 | 1 |
| C | 0 | 10795 | 1 |
| D | 0 | 11226 | 1 |
| Mode SS | |||
|---|---|---|---|
| Quadrant | BADHDUFLAG | Total packets | Discarded packets |
| A | 0 | 108 | 0 |
| B | 0 | 108 | 0 |
| C | 0 | 108 | 0 |
| D | 0 | 108 | 0 |
| Mode M9 | |||
|---|---|---|---|
| Quadrant | BADHDUFLAG | Total packets | Discarded packets |
| A | 0 | 8 | 0 |
| B | 0 | 8 | 0 |
| C | 0 | 8 | 0 |
| D | 0 | 8 | 0 |
| Quadrant | Total seconds | Saturated seconds | Saturation percentage |
|---|---|---|---|
| A | 5313 | 25 | 0.470544% |
| B | 5313 | 36 | 0.677583% |
| C | 5313 | 25 | 0.470544% |
| D | 5313 | 35 | 0.658762% |
Noise dominated data is calculated using 1-second bins in cleaned event files. If a bin has >2000 counts, and if more than 50% of those come from <1% of pixels, then it is considered to be noise-dominated and hence unusable.
| Quadrant | # 1 sec bins | Bins with >0 counts | Bins with >2000 counts | High rate bins dominated by noise | Noise dominated (total time) | Noise dominated (detector-on time) | Marked lightcurve |
|---|---|---|---|---|---|---|---|
| A | 6138 | 5314 | 0 | 0 | 0.00% | 0.00% | 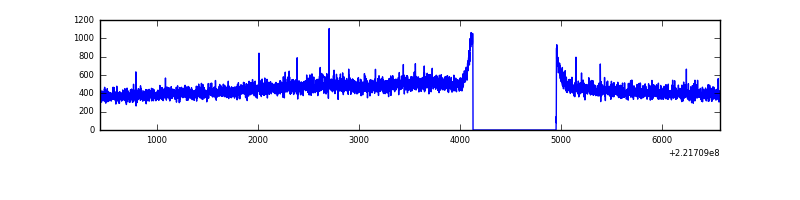 |
| B | 6138 | 5314 | 3 | 3 | 0.05% | 0.06% | 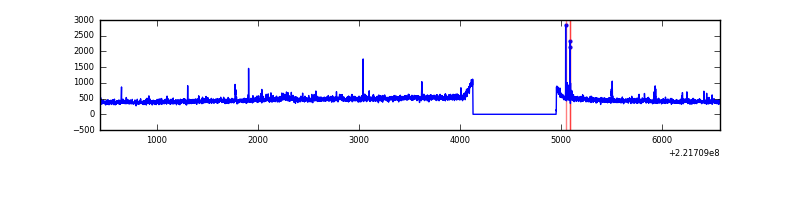 |
| C | 6138 | 5314 | 0 | 0 | 0.00% | 0.00% | 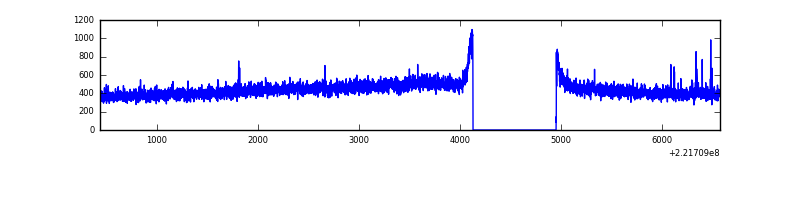 |
| D | 6138 | 5314 | 9 | 9 | 0.15% | 0.17% | 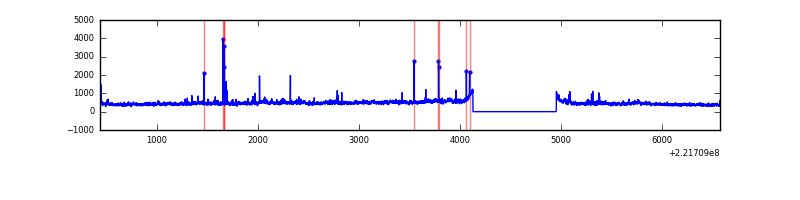 |
Top three noisy pixels from each quadrant. If the there are fewer than three noisy pixels in the level2.evt file, extra rows are filled as -1
| Pixel properties | Quadrant properties | ||||||
|---|---|---|---|---|---|---|---|
| Quadrant | DetID | PixID | Counts | Sigma | Mean | Median | Sigma |
| A | 8 | 15 | 8405 | 61.81 | 614 | 600 | 126.3 |
| A | 4 | 2 | 7137 | 51.77 | 614 | 600 | 126.3 |
| A | 13 | 248 | 6715 | 48.42 | 614 | 600 | 126.3 |
| B | 4 | 81 | 24889 | 203.7 | 616 | 601 | 119.2 |
| B | 0 | 228 | 19576 | 159.14 | 616 | 601 | 119.2 |
| B | 5 | 29 | 16869 | 136.44 | 616 | 601 | 119.2 |
| C | 12 | 4 | 10546 | 70.98 | 595 | 597 | 140.2 |
| C | 13 | 61 | 4651 | 28.92 | 595 | 597 | 140.2 |
| C | 3 | 202 | 1546 | 6.77 | 595 | 597 | 140.2 |
| D | 8 | 195 | 150343 | 1019.08 | 596 | 577 | 147.0 |
| D | 2 | 14 | 48507 | 326.14 | 596 | 577 | 147.0 |
| D | 14 | 173 | 20089 | 132.77 | 596 | 577 | 147.0 |
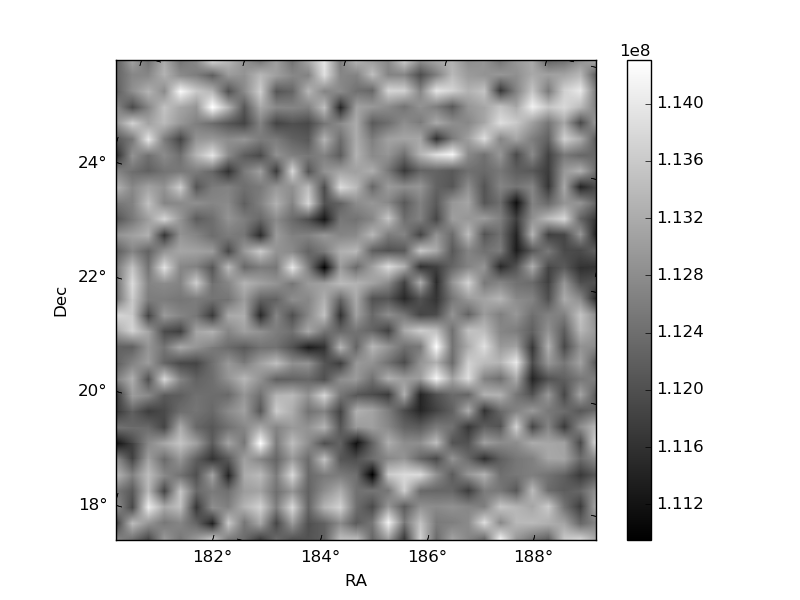
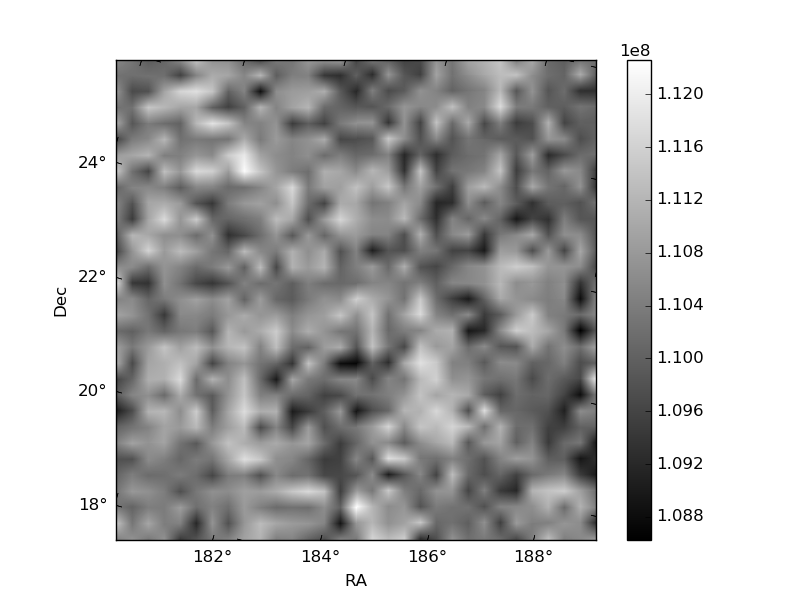
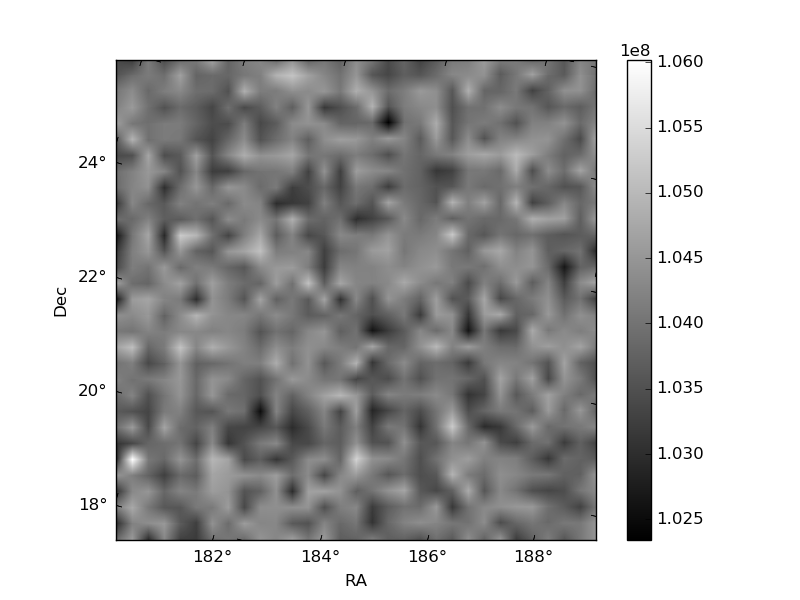
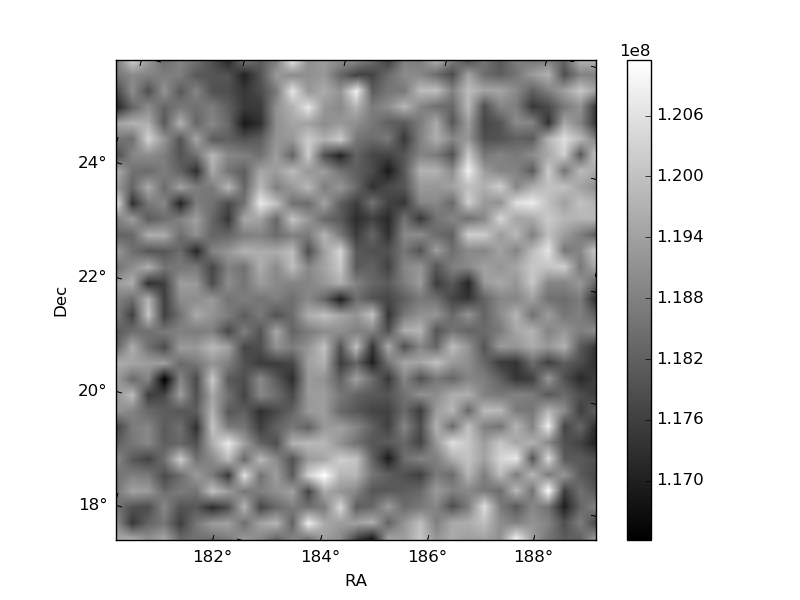
Histogram calculated using DETX and DETY for each event in the final _common_clean file
| Quadrant A | 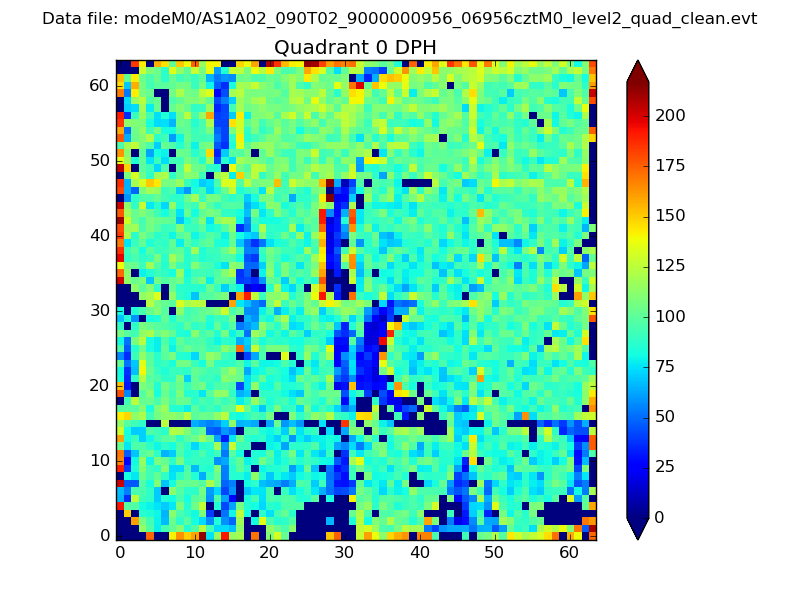 |
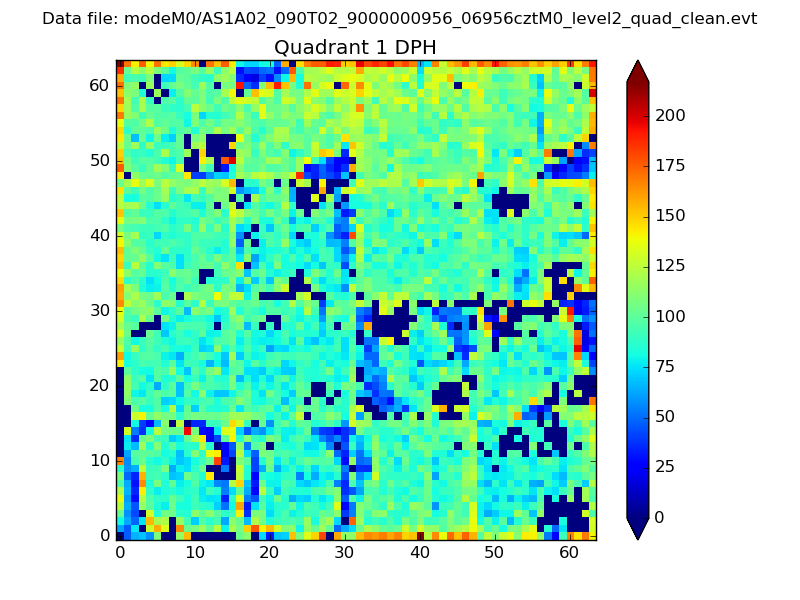 |
Quadrant B |
|---|---|---|---|
| Quadrant D | 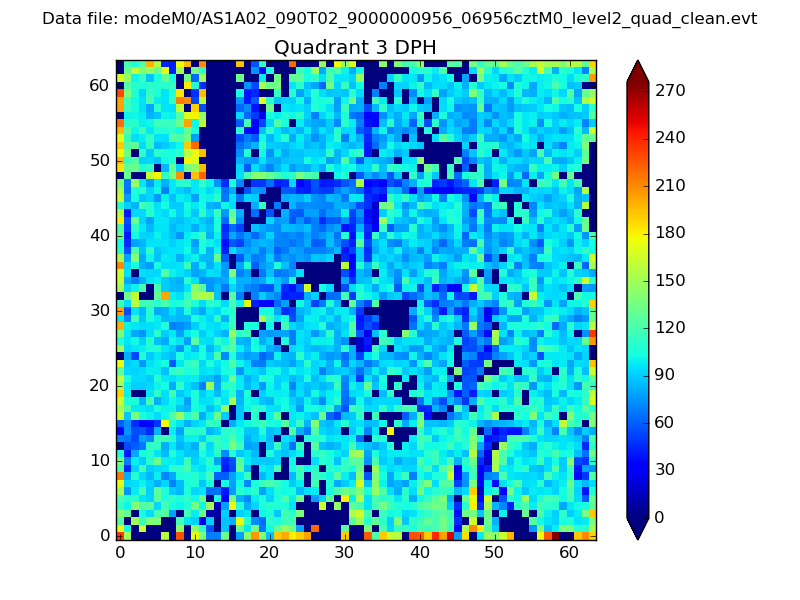 |
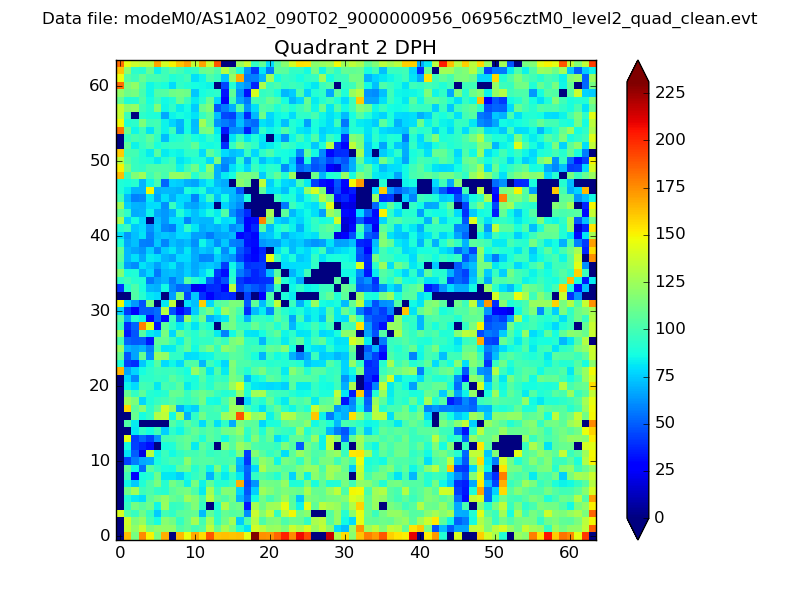 |
Quadrant C |
| Plot type | Count rate plots | Images |
|---|---|---|
| Comparison with Poisson distribution Blue bars denote a histogram of data divided into 1 sec bins. Red curve is a Poisson curve with rate = median count rate of data. |
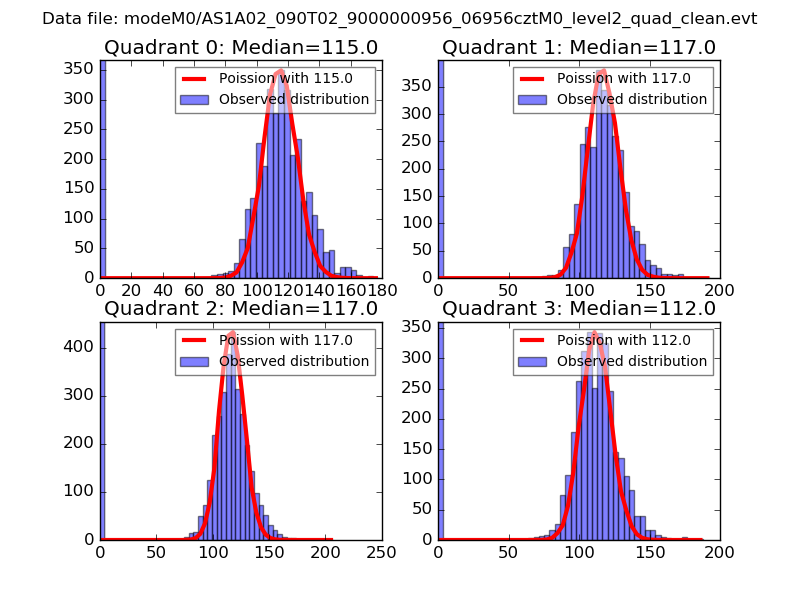 |
 |
| Quadrant-wise count rates Data is divided into 100 sec bins |
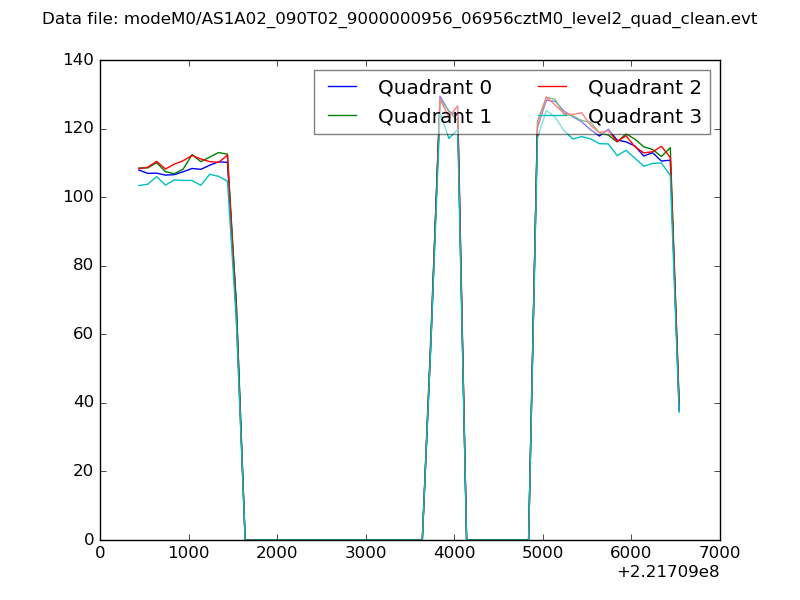 |
|
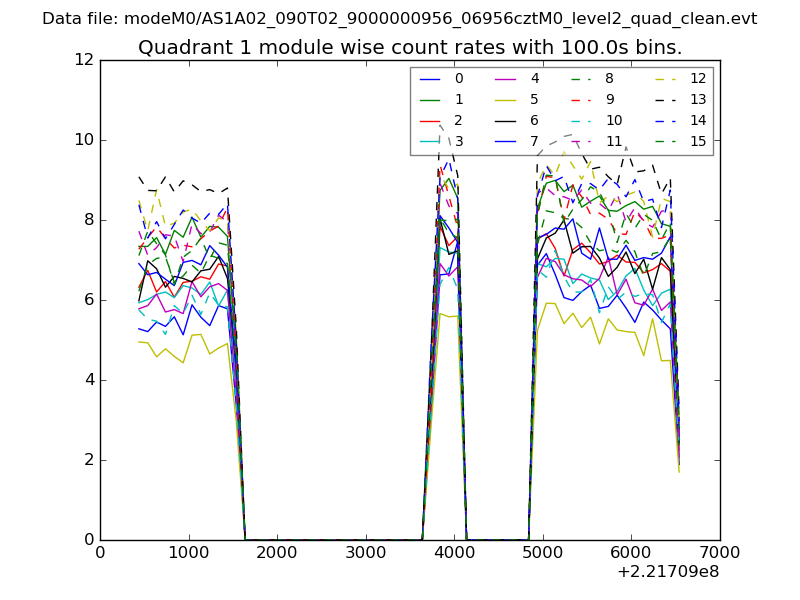
| Module-wise count rates for Quadrant A Data is divided into 100 sec bins |
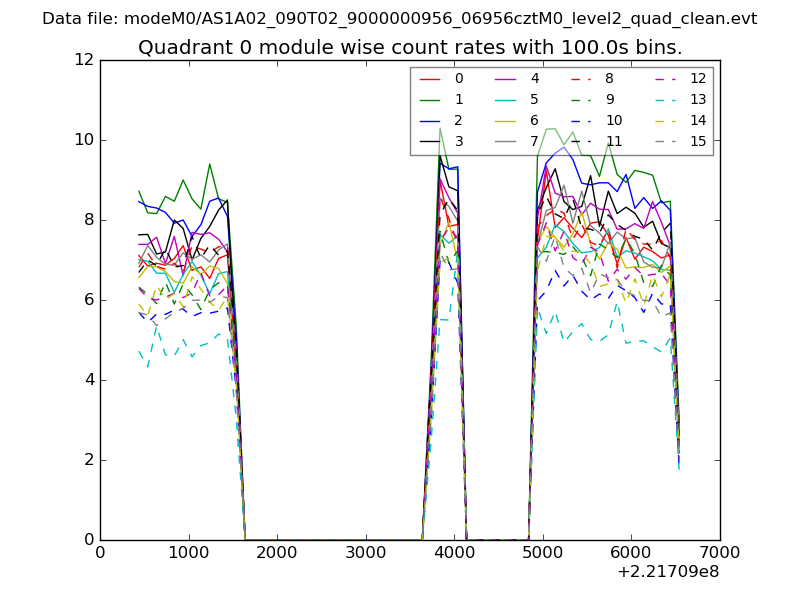 |
 |
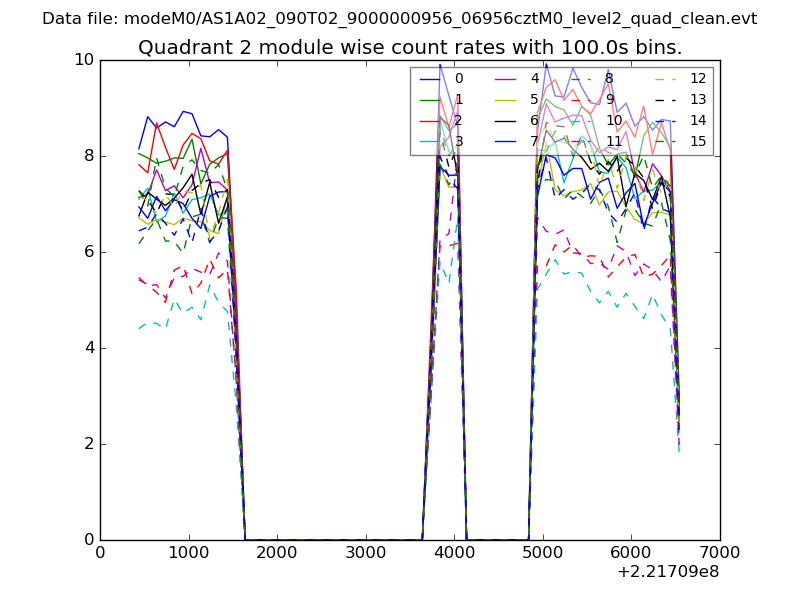
| Module-wise count rates for Quadrant B Data is divided into 100 sec bins |
 |
 |
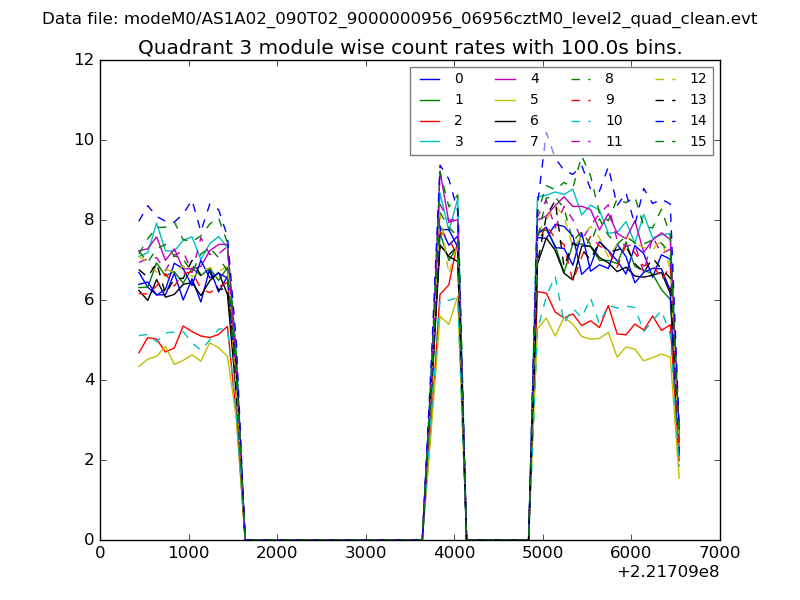
| Module-wise count rates for Quadrant C Data is divided into 100 sec bins |
 |
 |
| Module-wise count rates for Quadrant D Data is divided into 100 sec bins |
 |
 |
| Parameter | Plot |
|---|---|
| CZT HV Monitor | 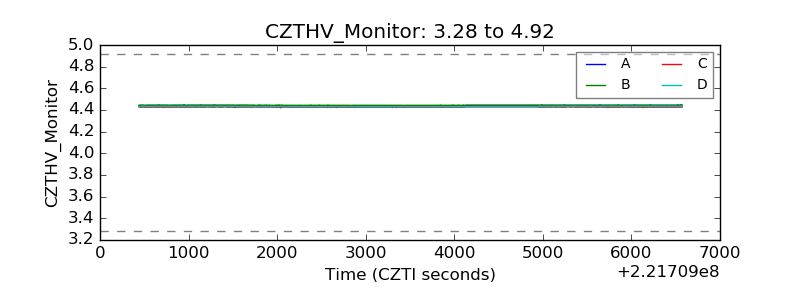 |
| D_VDD | 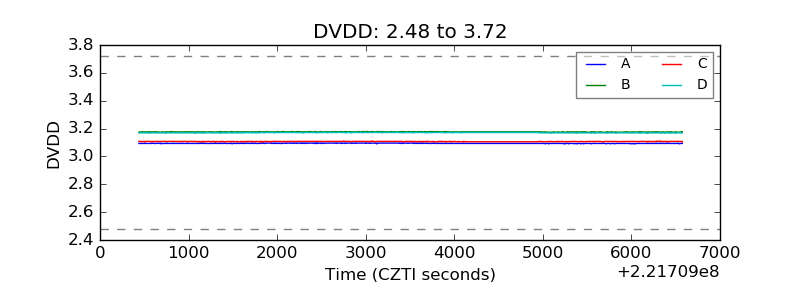 |
| Temperature 1 | 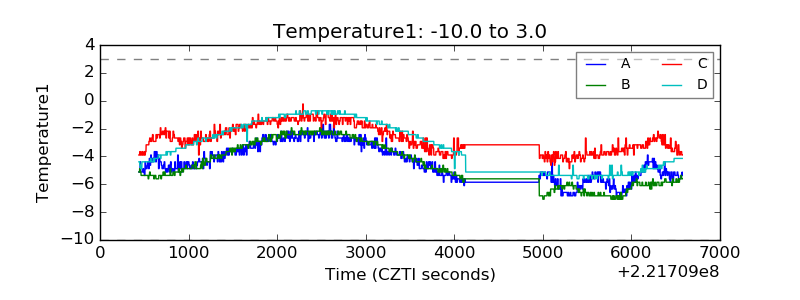 |
| Veto HV Monitor |  |
| Veto LLD | 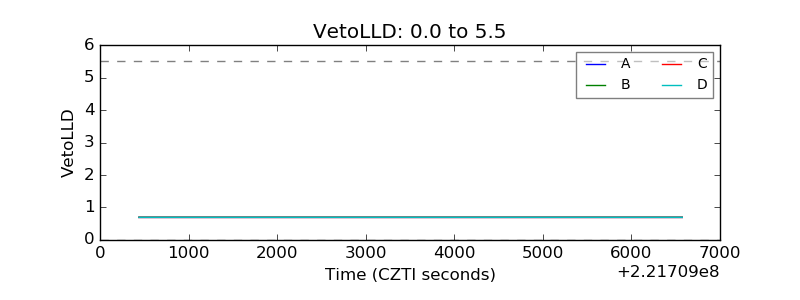 |
| Alpha Counter | 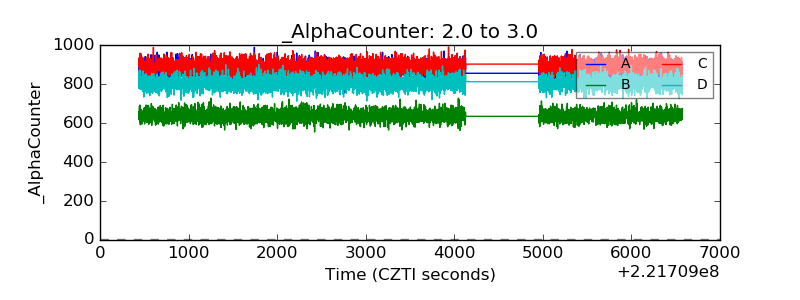 |
| _CPM_Rate | 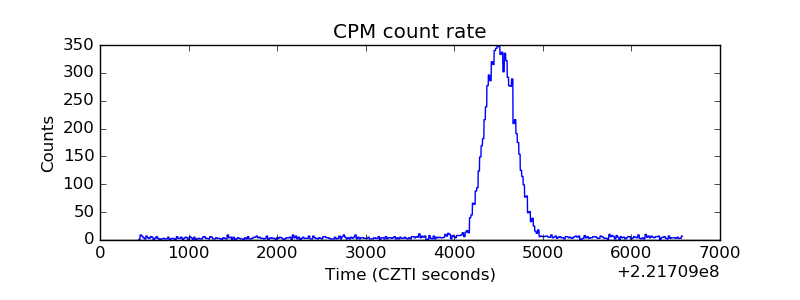 |
| CZT Counter | 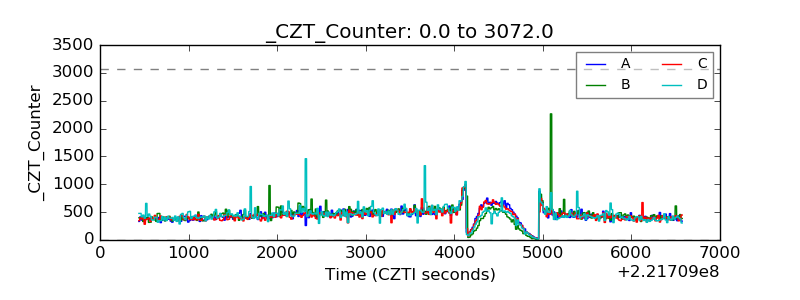 |
| +2.5 Volts monitor |  |
| +5 Volts monitor |  |
| _ROLL_ROT | 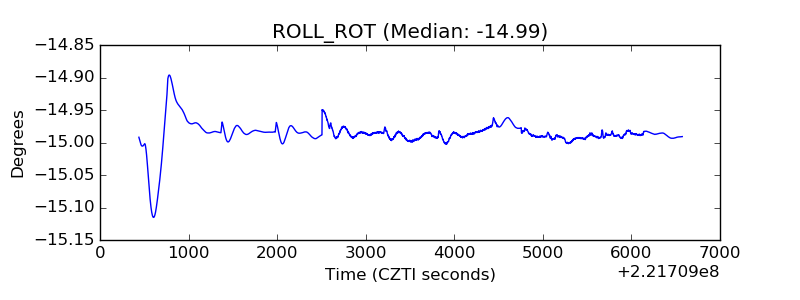 |
| _Roll_DEC | 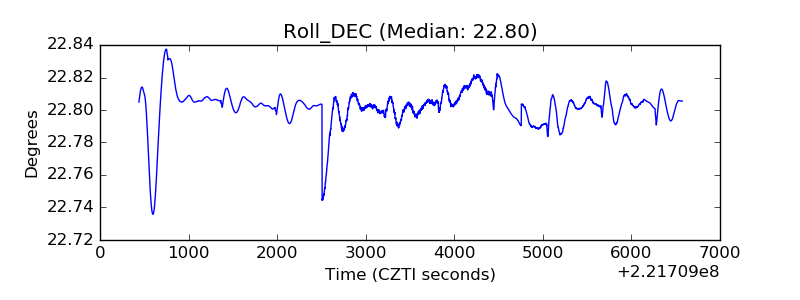 |
| _Roll_RA | 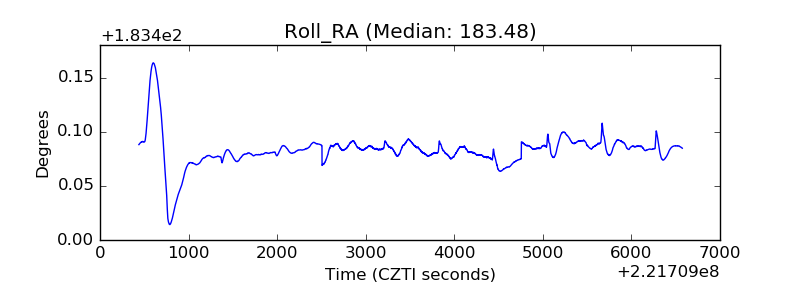 |
| Veto Counter | 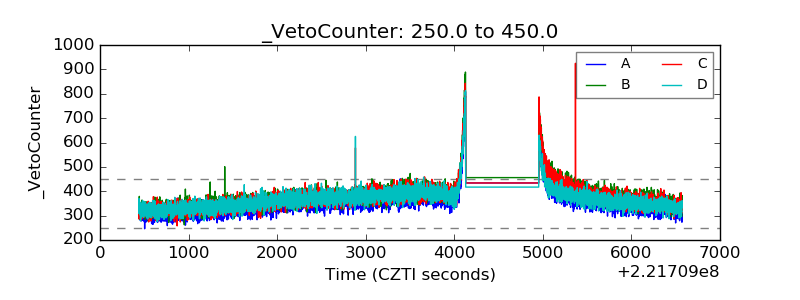 |