| Param | Original file | Final file |
|---|---|---|
| Filename | modeM0/AS1A02_090T02_9000000956_06957cztM0_level2.evt | modeM0/AS1A02_090T02_9000000956_06957cztM0_level2_quad_clean.evt |
| Size (bytes) | 438,445,440 | 88,871,040 |
| Size | 418.1 MB | 84.8 MB |
| Events in quadrant A | 3,031,464 | 556,895 |
| Events in quadrant B | 3,284,847 | 563,157 |
| Events in quadrant C | 3,009,103 | 560,588 |
| Events in quadrant D | 3,492,244 | 538,553 |
| Mode M0 | |||
|---|---|---|---|
| Quadrant | BADHDUFLAG | Total packets | Discarded packets |
| A | 0 | 13798 | 3 |
| B | 0 | 14380 | 2 |
| C | 0 | 13828 | 2 |
| D | 0 | 15052 | 5 |
| Mode SS | |||
|---|---|---|---|
| Quadrant | BADHDUFLAG | Total packets | Discarded packets |
| A | 0 | 140 | 0 |
| B | 0 | 140 | 0 |
| C | 0 | 140 | 0 |
| D | 0 | 140 | 0 |
| Mode M9 | |||
|---|---|---|---|
| Quadrant | BADHDUFLAG | Total packets | Discarded packets |
| A | 0 | 18 | 0 |
| B | 0 | 18 | 0 |
| C | 0 | 18 | 0 |
| D | 0 | 18 | 0 |
| Quadrant | Total seconds | Saturated seconds | Saturation percentage |
|---|---|---|---|
| A | 6772 | 41 | 0.605434% |
| B | 6772 | 91 | 1.343768% |
| C | 6772 | 38 | 0.561134% |
| D | 6771 | 54 | 0.797519% |
Noise dominated data is calculated using 1-second bins in cleaned event files. If a bin has >2000 counts, and if more than 50% of those come from <1% of pixels, then it is considered to be noise-dominated and hence unusable.
| Quadrant | # 1 sec bins | Bins with >0 counts | Bins with >2000 counts | High rate bins dominated by noise | Noise dominated (total time) | Noise dominated (detector-on time) | Marked lightcurve |
|---|---|---|---|---|---|---|---|
| A | 7764 | 6774 | 1 | 1 | 0.01% | 0.01% | 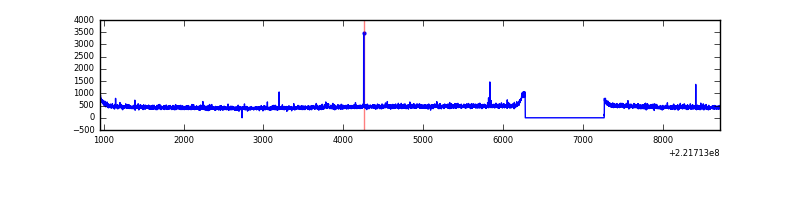 |
| B | 7764 | 6774 | 35 | 35 | 0.45% | 0.52% | 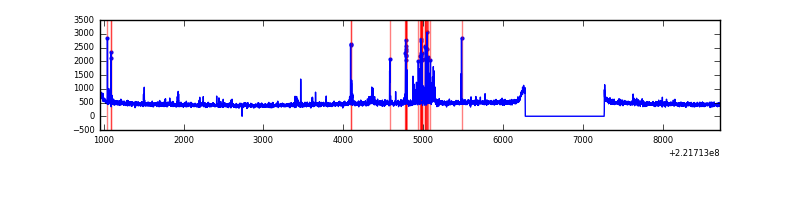 |
| C | 7764 | 6774 | 4 | 4 | 0.05% | 0.06% | 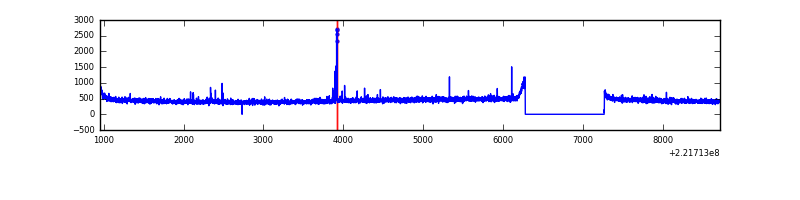 |
| D | 7763 | 6773 | 19 | 19 | 0.24% | 0.28% | 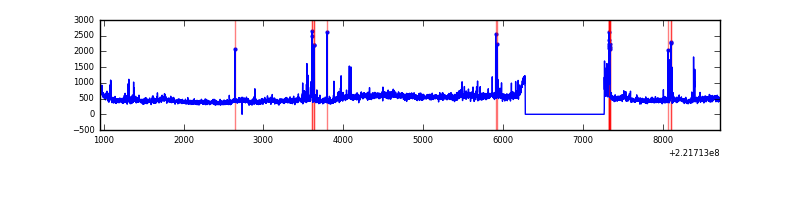 |
Top three noisy pixels from each quadrant. If the there are fewer than three noisy pixels in the level2.evt file, extra rows are filled as -1
| Pixel properties | Quadrant properties | ||||||
|---|---|---|---|---|---|---|---|
| Quadrant | DetID | PixID | Counts | Sigma | Mean | Median | Sigma |
| A | 13 | 248 | 15195 | 90.01 | 783 | 765 | 160.3 |
| A | 0 | 226 | 7544 | 42.28 | 783 | 765 | 160.3 |
| A | 12 | 194 | 7152 | 39.84 | 783 | 765 | 160.3 |
| B | 4 | 81 | 183121 | 1202.15 | 785 | 767 | 151.7 |
| B | 12 | 111 | 15482 | 97.01 | 785 | 767 | 151.7 |
| B | 0 | 219 | 13385 | 83.18 | 785 | 767 | 151.7 |
| C | 12 | 4 | 41600 | 229.84 | 760 | 764 | 177.7 |
| C | 13 | 61 | 5990 | 29.41 | 760 | 764 | 177.7 |
| C | 1 | 3 | 2208 | 8.13 | 760 | 764 | 177.7 |
| D | 8 | 195 | 392272 | 2107.17 | 758 | 733 | 185.8 |
| D | 2 | 14 | 74767 | 398.43 | 758 | 733 | 185.8 |
| D | 12 | 233 | 55427 | 294.35 | 758 | 733 | 185.8 |
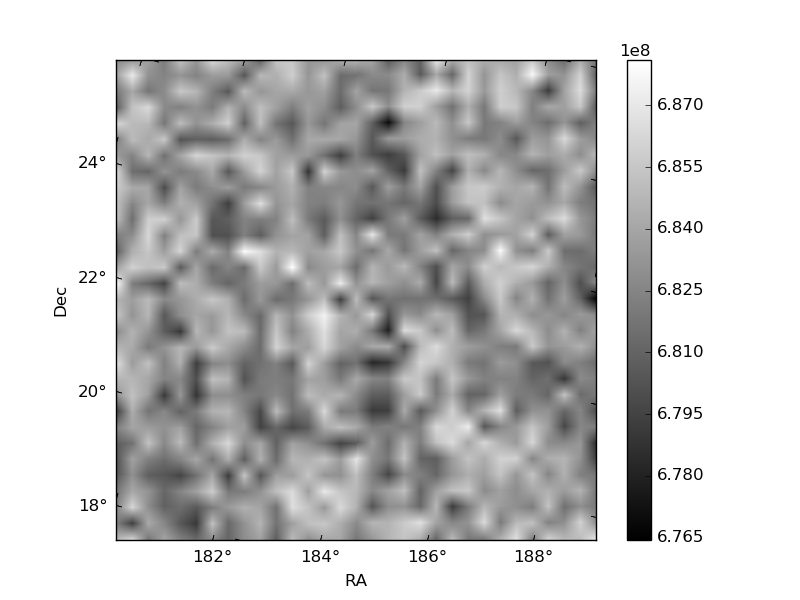
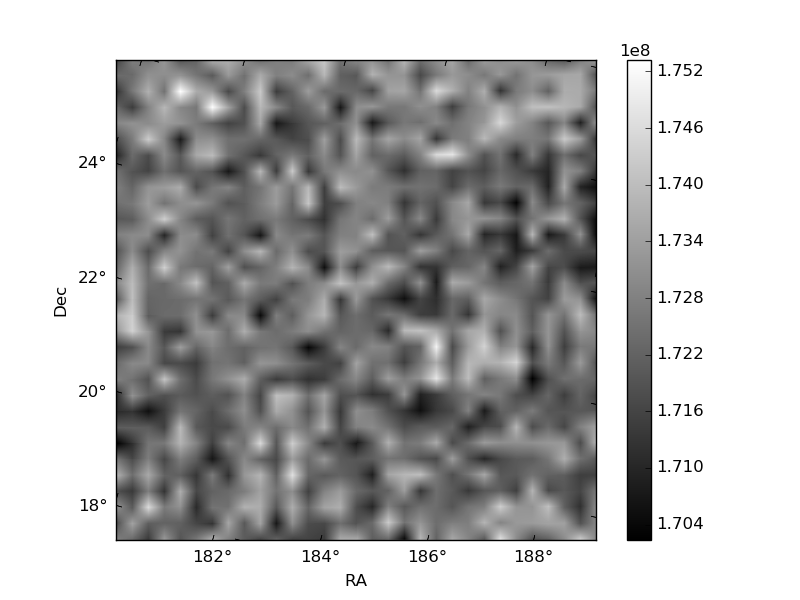
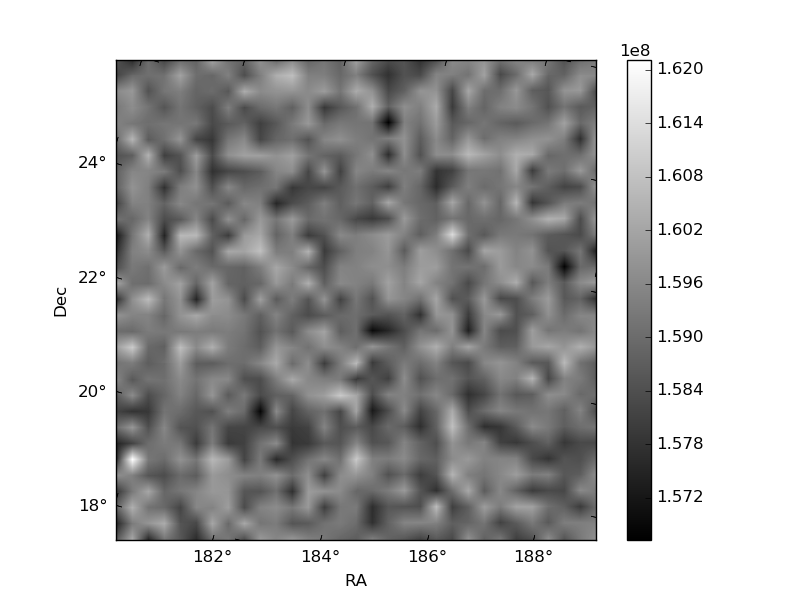
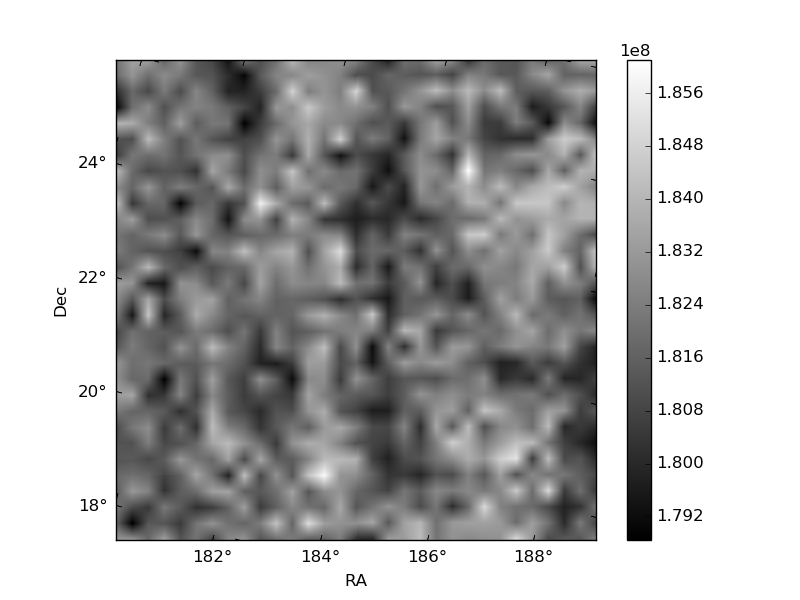
Histogram calculated using DETX and DETY for each event in the final _common_clean file
| Quadrant A | 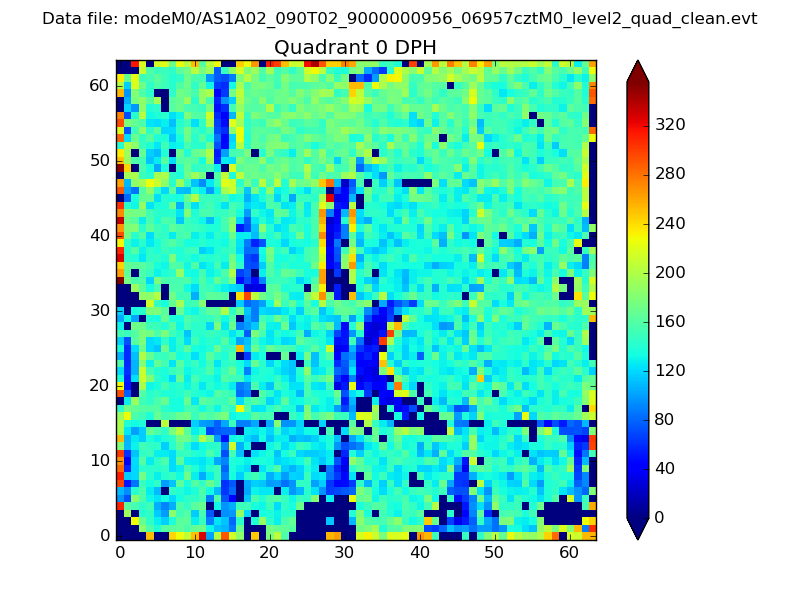 |
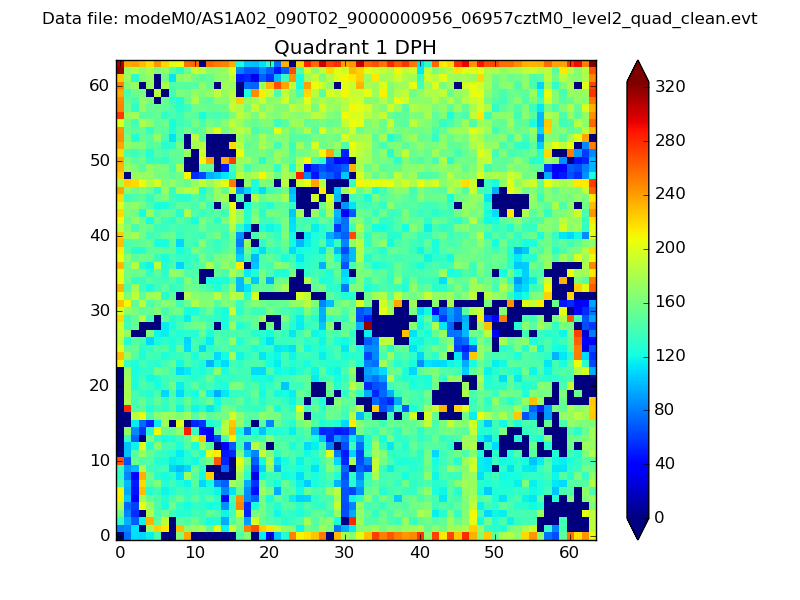 |
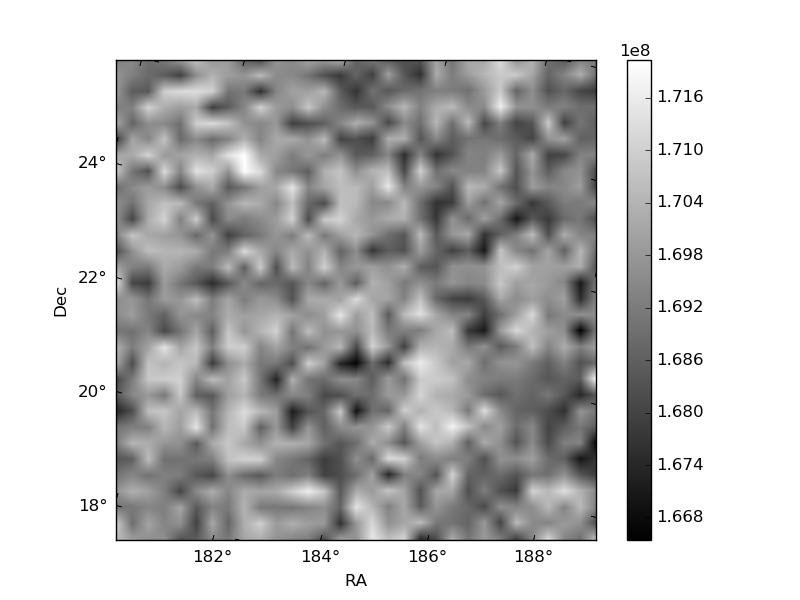
Quadrant B |
|---|---|---|---|
| Quadrant D | 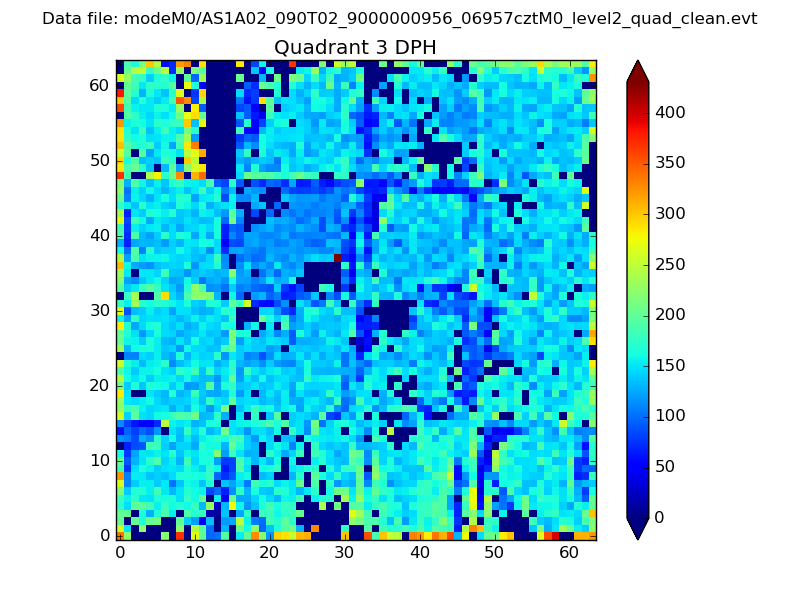 |
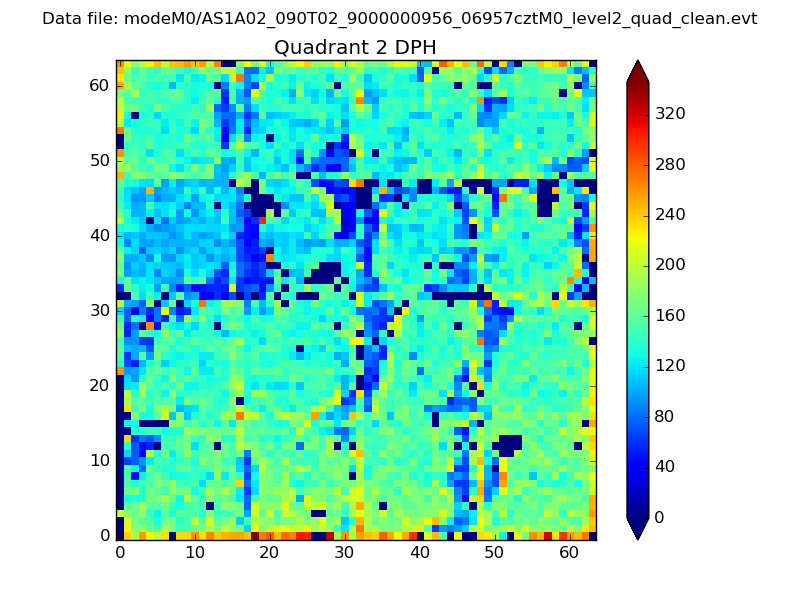 |
Quadrant C |
| Plot type | Count rate plots | Images |
|---|---|---|
| Comparison with Poisson distribution Blue bars denote a histogram of data divided into 1 sec bins. Red curve is a Poisson curve with rate = median count rate of data. |
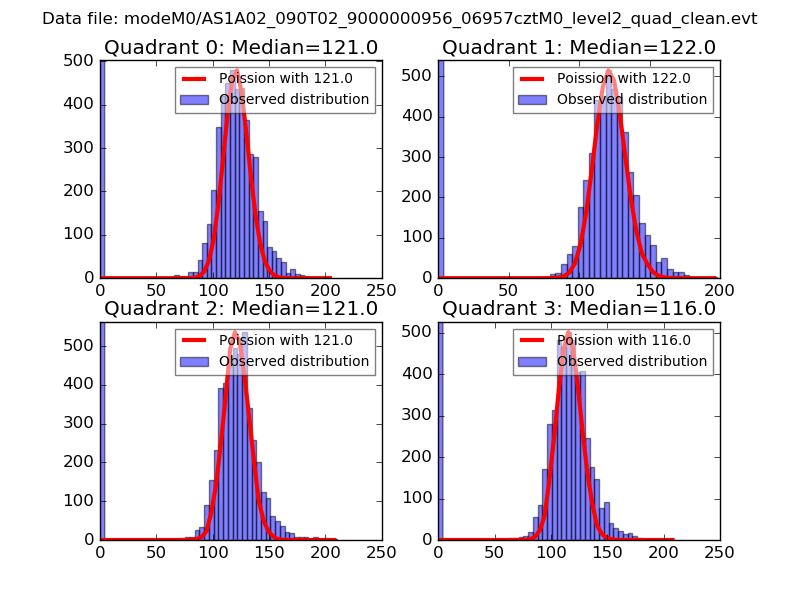 |
 |
| Quadrant-wise count rates Data is divided into 100 sec bins |
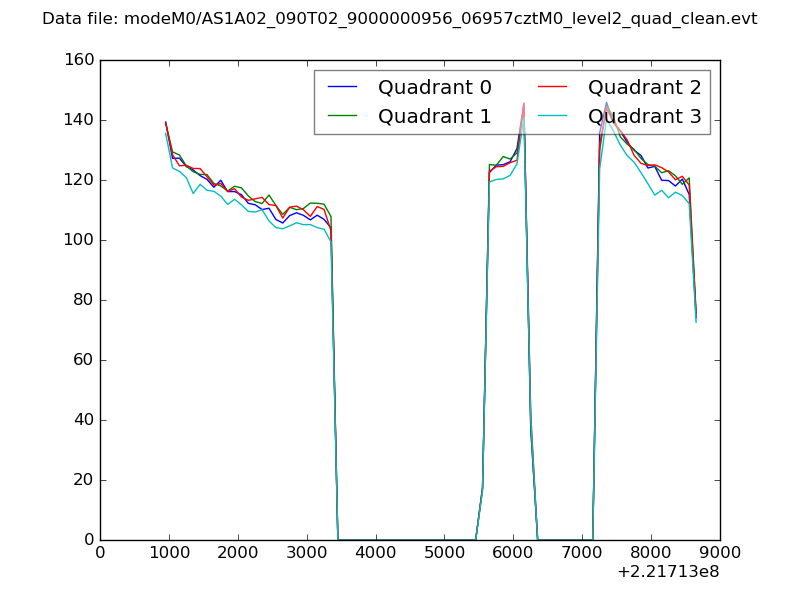 |
|
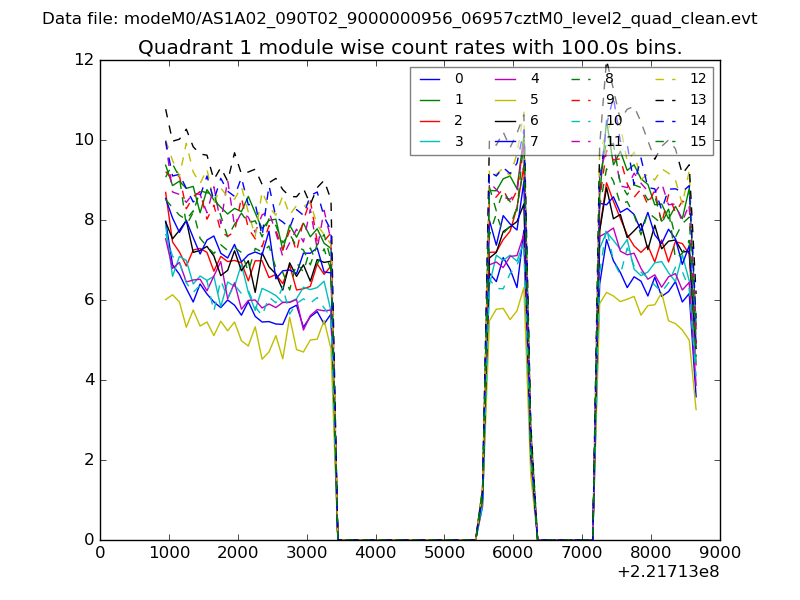
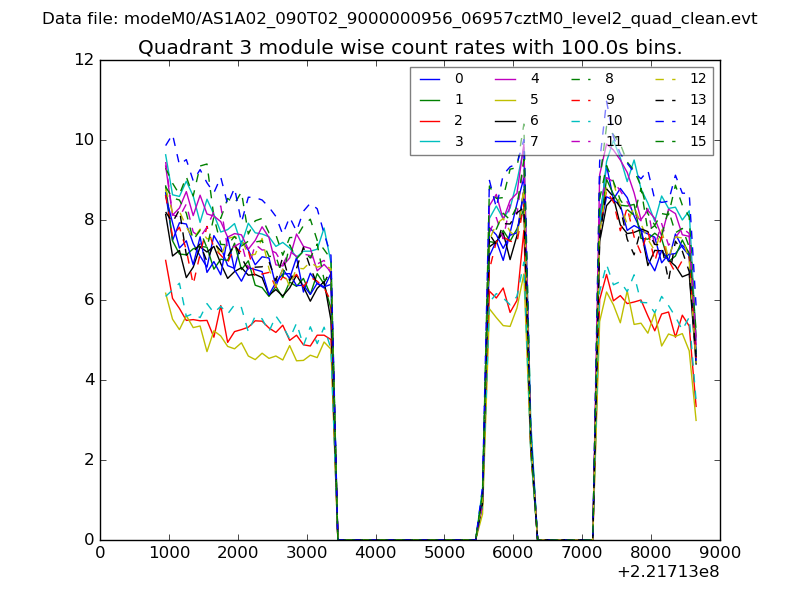
| Module-wise count rates for Quadrant A Data is divided into 100 sec bins |
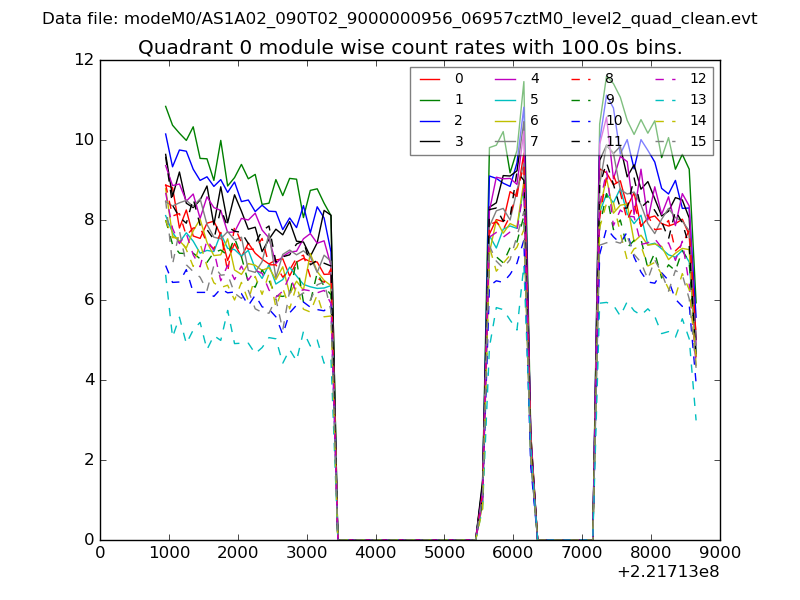 |
 |
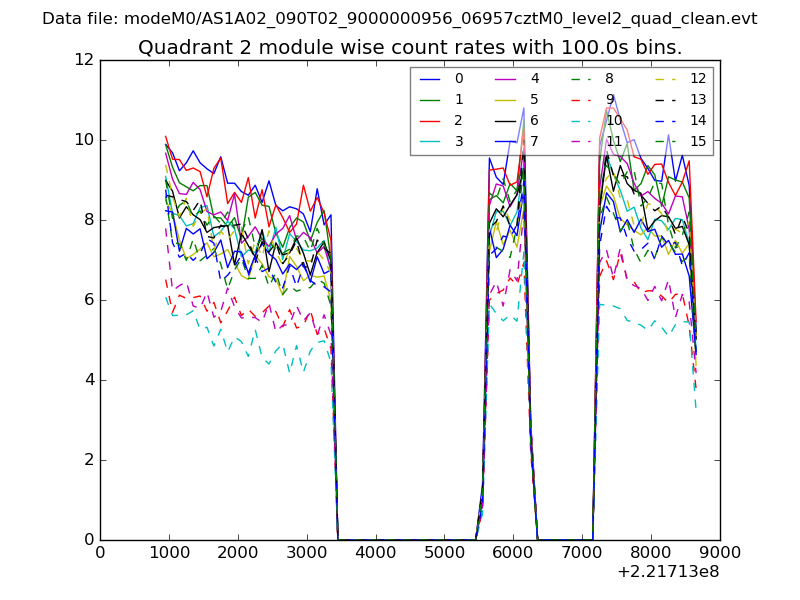
| Module-wise count rates for Quadrant B Data is divided into 100 sec bins |
 |
 |
| Module-wise count rates for Quadrant C Data is divided into 100 sec bins |
 |
 |
| Module-wise count rates for Quadrant D Data is divided into 100 sec bins |
 |
 |
| Parameter | Plot |
|---|---|
| CZT HV Monitor |  |
| D_VDD | 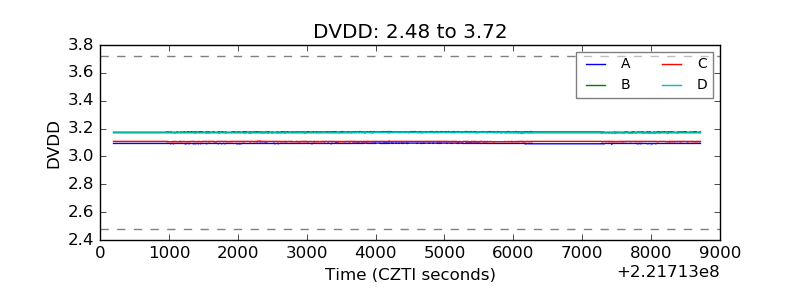 |
| Temperature 1 |  |
| Veto HV Monitor | 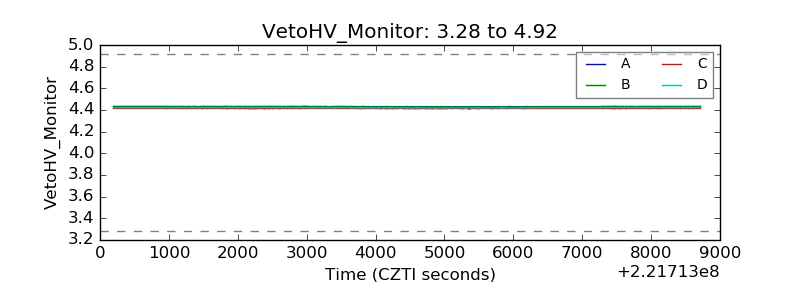 |
| Veto LLD | 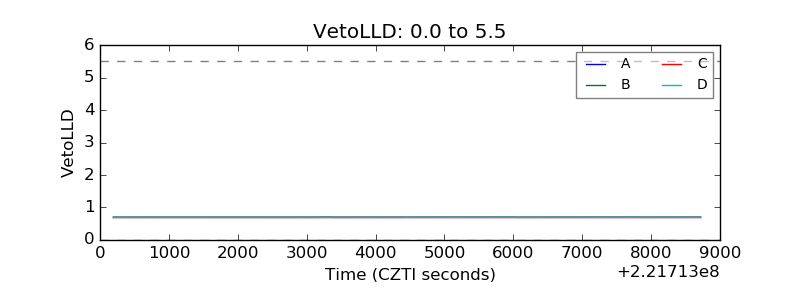 |
| Alpha Counter | 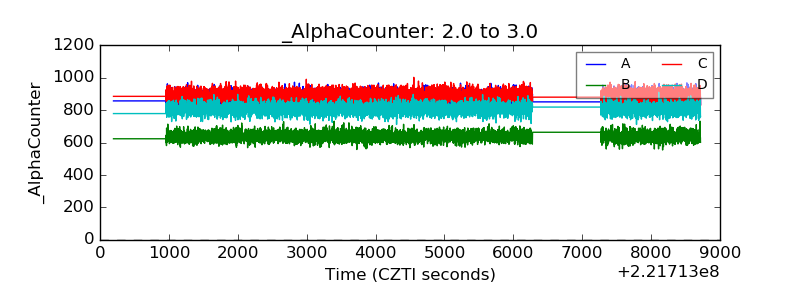 |
| _CPM_Rate | 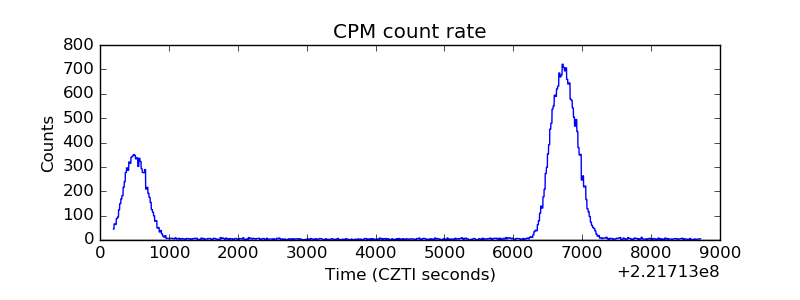 |
| CZT Counter | 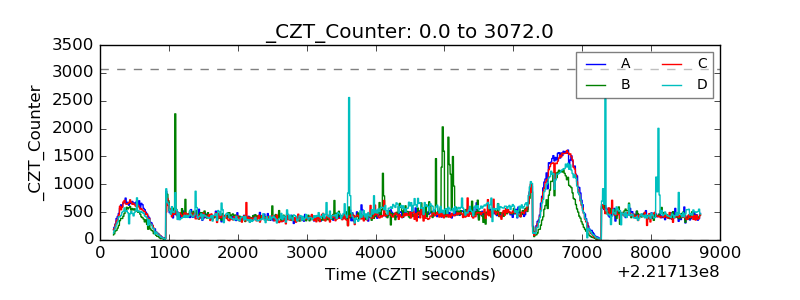 |
| +2.5 Volts monitor | 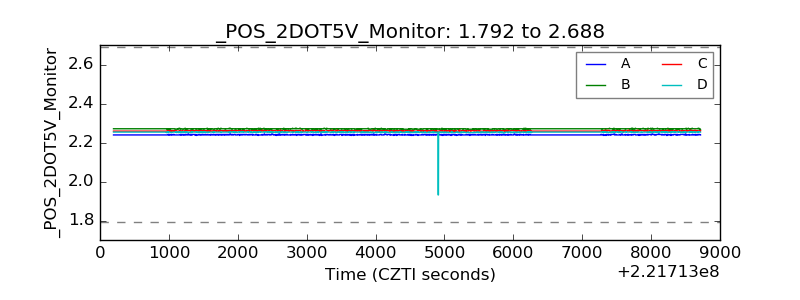 |
| +5 Volts monitor |  |
| _ROLL_ROT | 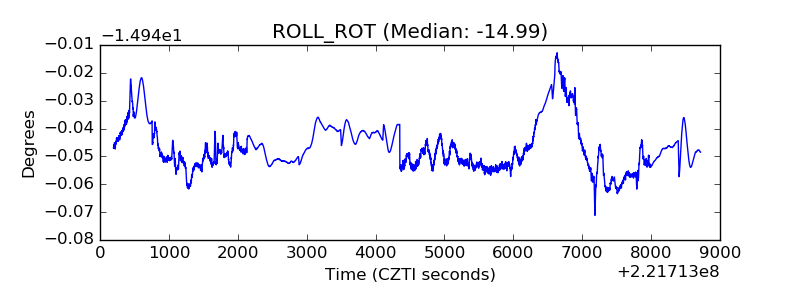 |
| _Roll_DEC | 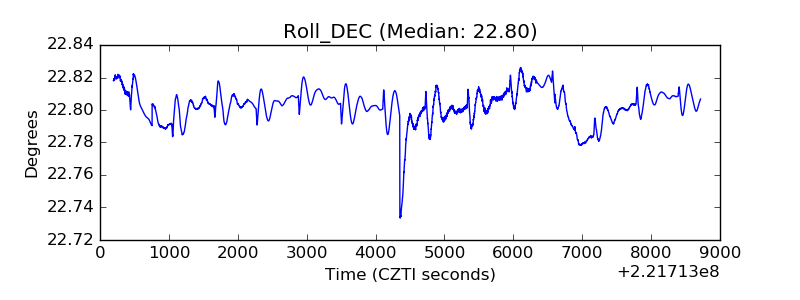 |
| _Roll_RA | 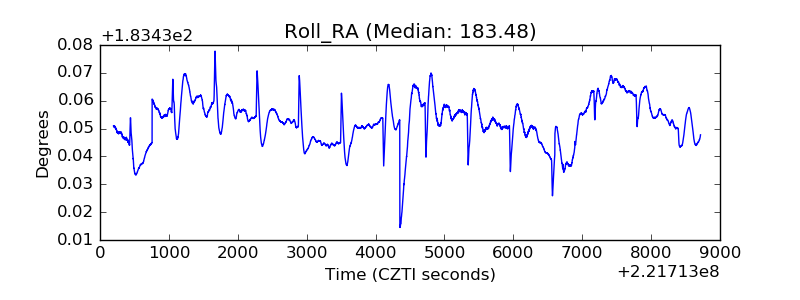 |
| Veto Counter | 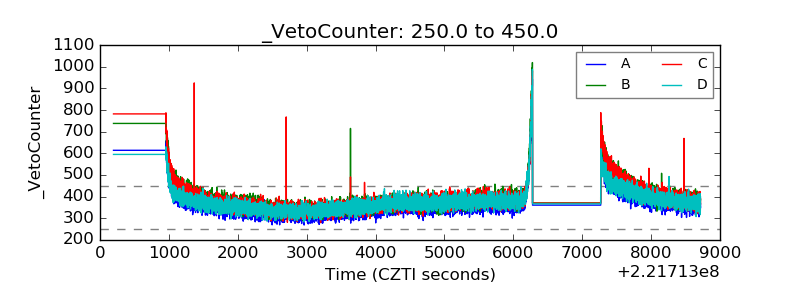 |