| Param | Original file | Final file |
|---|---|---|
| Filename | modeM0/AS1A02_090T02_9000000956_06959cztM0_level2.evt | modeM0/AS1A02_090T02_9000000956_06959cztM0_level2_quad_clean.evt |
| Size (bytes) | 440,907,840 | 88,796,160 |
| Size | 420.5 MB | 84.7 MB |
| Events in quadrant A | 3,004,590 | 561,192 |
| Events in quadrant B | 3,106,275 | 568,986 |
| Events in quadrant C | 2,952,359 | 565,804 |
| Events in quadrant D | 3,847,665 | 539,508 |
| Mode M0 | |||
|---|---|---|---|
| Quadrant | BADHDUFLAG | Total packets | Discarded packets |
| A | 0 | 13263 | 3 |
| B | 0 | 13410 | 2 |
| C | 0 | 13231 | 2 |
| D | 0 | 15874 | 2 |
| Mode SS | |||
|---|---|---|---|
| Quadrant | BADHDUFLAG | Total packets | Discarded packets |
| A | 0 | 132 | 0 |
| B | 0 | 132 | 0 |
| C | 0 | 132 | 0 |
| D | 0 | 132 | 0 |
| Mode M9 | |||
|---|---|---|---|
| Quadrant | BADHDUFLAG | Total packets | Discarded packets |
| A | 0 | 17 | 0 |
| B | 0 | 17 | 0 |
| C | 0 | 17 | 0 |
| D | 0 | 18 | 0 |
| Quadrant | Total seconds | Saturated seconds | Saturation percentage |
|---|---|---|---|
| A | 6503 | 62 | 0.953406% |
| B | 6503 | 72 | 1.107181% |
| C | 6503 | 40 | 0.615101% |
| D | 6503 | 84 | 1.291712% |
Noise dominated data is calculated using 1-second bins in cleaned event files. If a bin has >2000 counts, and if more than 50% of those come from <1% of pixels, then it is considered to be noise-dominated and hence unusable.
| Quadrant | # 1 sec bins | Bins with >0 counts | Bins with >2000 counts | High rate bins dominated by noise | Noise dominated (total time) | Noise dominated (detector-on time) | Marked lightcurve |
|---|---|---|---|---|---|---|---|
| A | 7588 | 6504 | 0 | 0 | 0.00% | 0.00% | 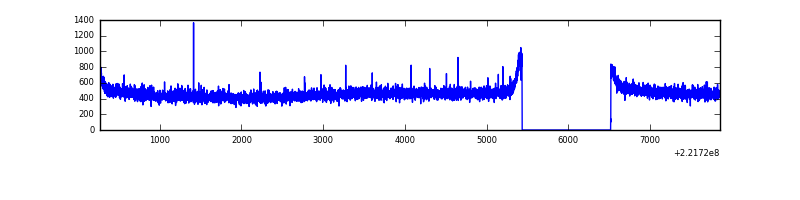 |
| B | 7588 | 6504 | 0 | 0 | 0.00% | 0.00% | 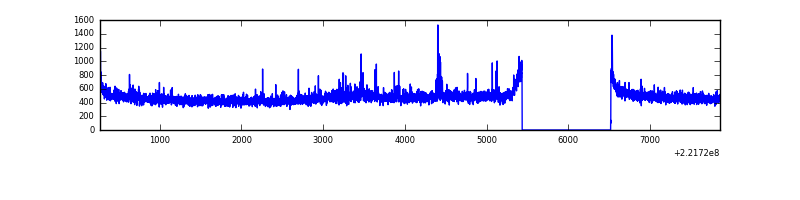 |
| C | 7588 | 6504 | 0 | 0 | 0.00% | 0.00% | 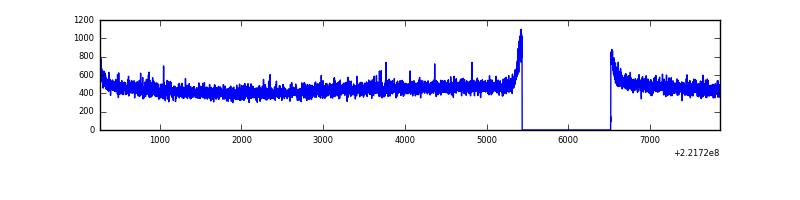 |
| D | 7588 | 6504 | 28 | 28 | 0.37% | 0.43% | 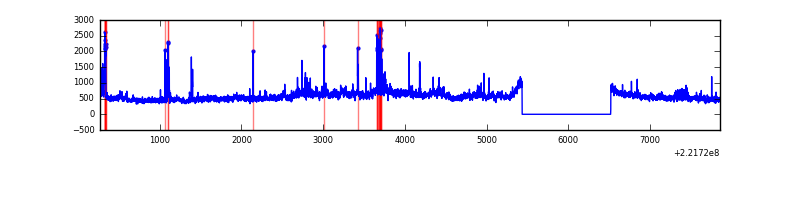 |
Top three noisy pixels from each quadrant. If the there are fewer than three noisy pixels in the level2.evt file, extra rows are filled as -1
| Pixel properties | Quadrant properties | ||||||
|---|---|---|---|---|---|---|---|
| Quadrant | DetID | PixID | Counts | Sigma | Mean | Median | Sigma |
| A | 0 | 226 | 7561 | 43.14 | 777 | 760 | 157.6 |
| A | 13 | 248 | 7316 | 41.59 | 777 | 760 | 157.6 |
| A | 12 | 194 | 7308 | 41.54 | 777 | 760 | 157.6 |
| B | 0 | 219 | 30792 | 201.89 | 778 | 760 | 148.8 |
| B | 4 | 81 | 17517 | 112.65 | 778 | 760 | 148.8 |
| B | 0 | 228 | 15622 | 99.91 | 778 | 760 | 148.8 |
| C | 13 | 61 | 5868 | 29.28 | 753 | 760 | 174.4 |
| C | 8 | 128 | 5640 | 27.97 | 753 | 760 | 174.4 |
| C | 12 | 4 | 4196 | 19.7 | 753 | 760 | 174.4 |
| D | 8 | 195 | 674275 | 3644.79 | 752 | 729 | 184.8 |
| D | 12 | 221 | 91282 | 490.01 | 752 | 729 | 184.8 |
| D | 5 | 97 | 85217 | 457.19 | 752 | 729 | 184.8 |
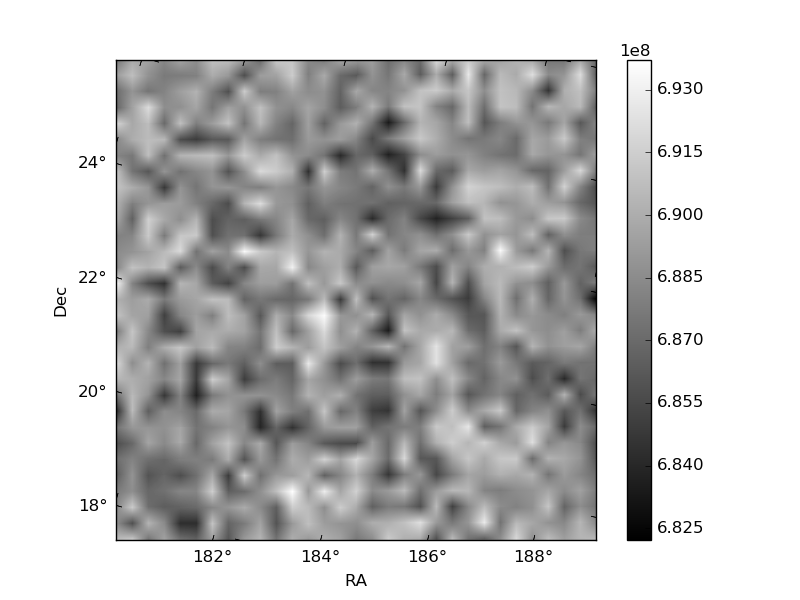
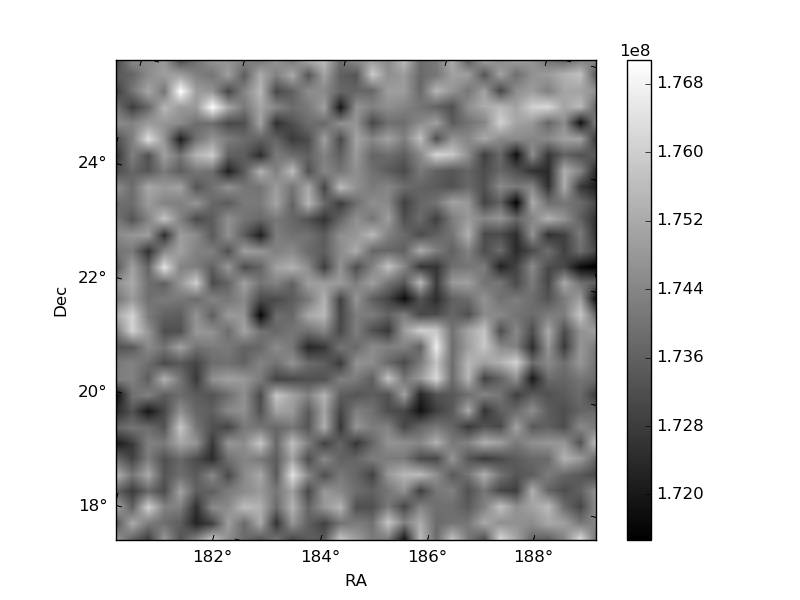
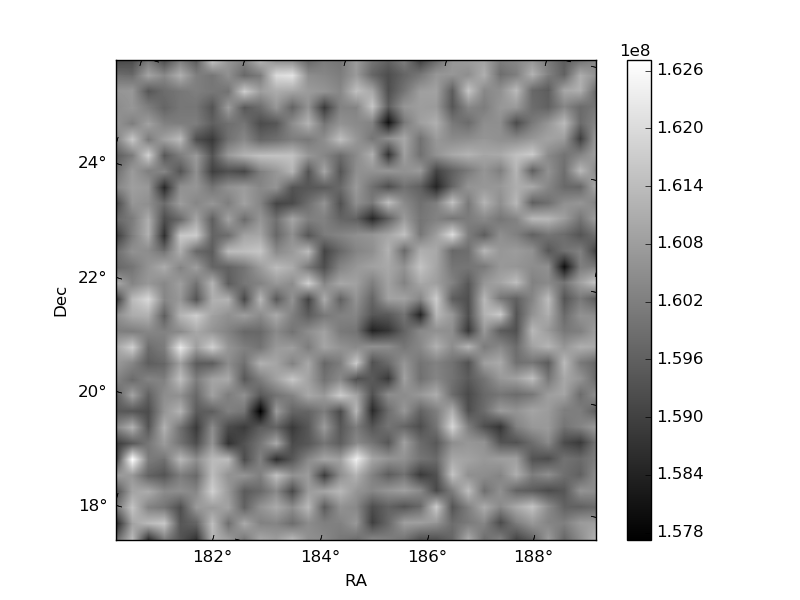
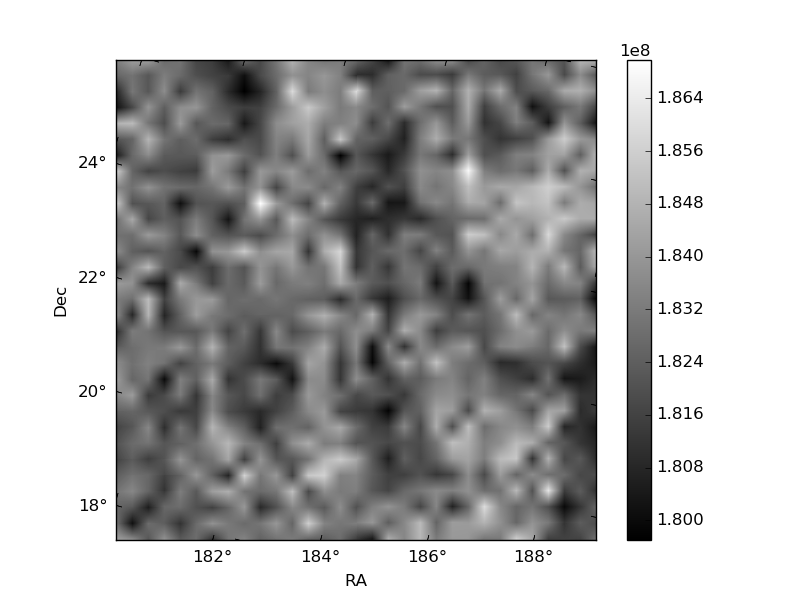
Histogram calculated using DETX and DETY for each event in the final _common_clean file
| Quadrant A | 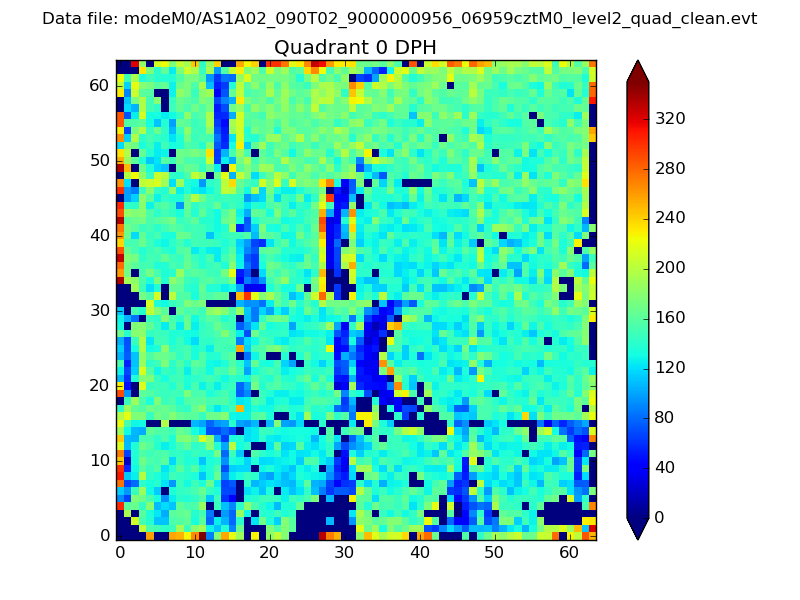 |
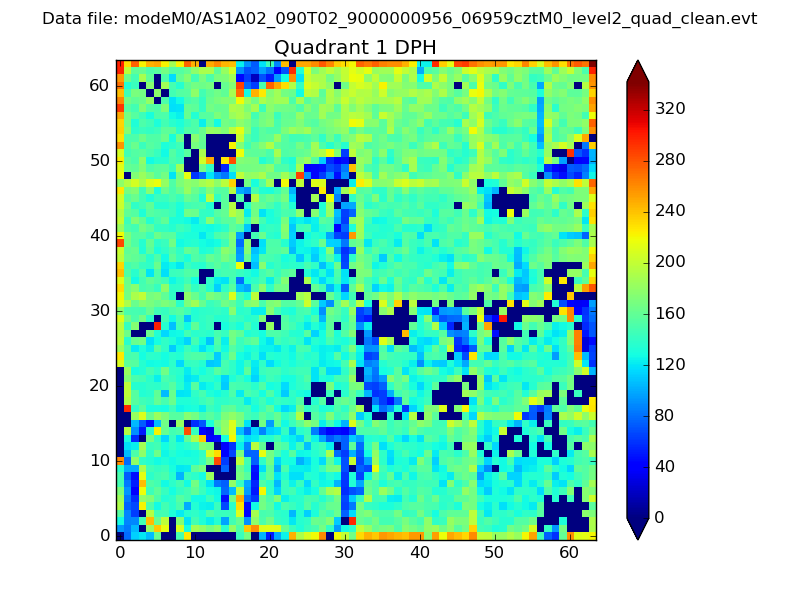 |
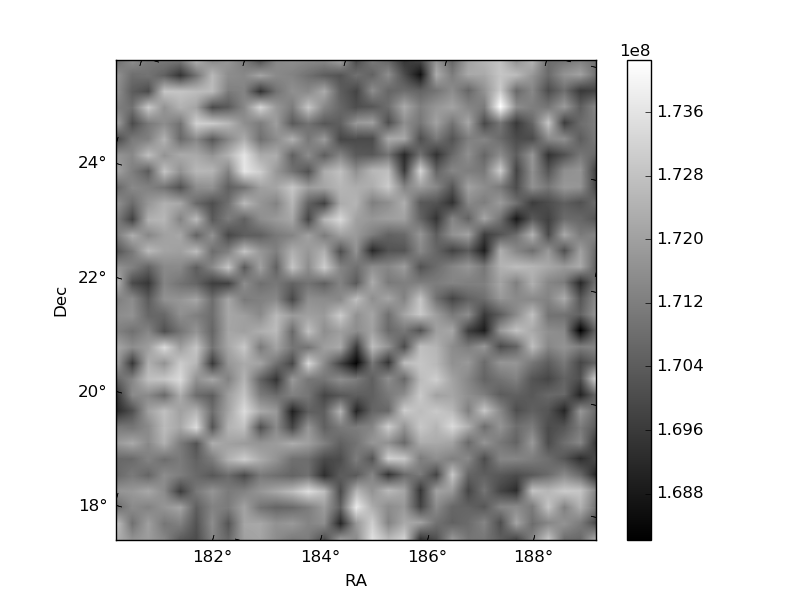
Quadrant B |
|---|---|---|---|
| Quadrant D | 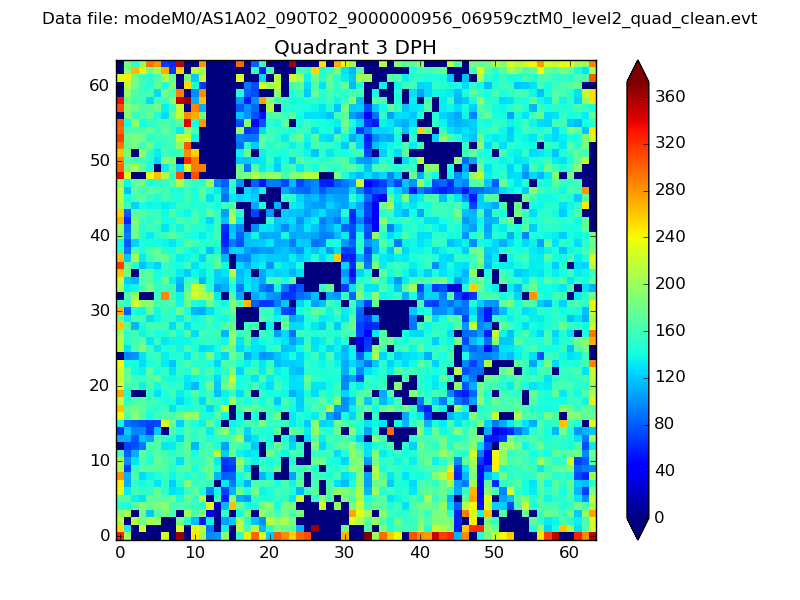 |
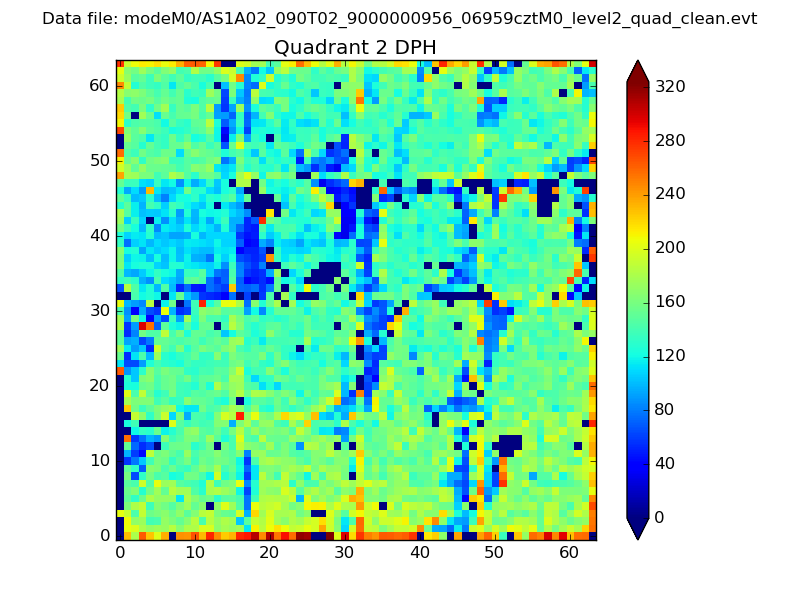 |
Quadrant C |
| Plot type | Count rate plots | Images |
|---|---|---|
| Comparison with Poisson distribution Blue bars denote a histogram of data divided into 1 sec bins. Red curve is a Poisson curve with rate = median count rate of data. |
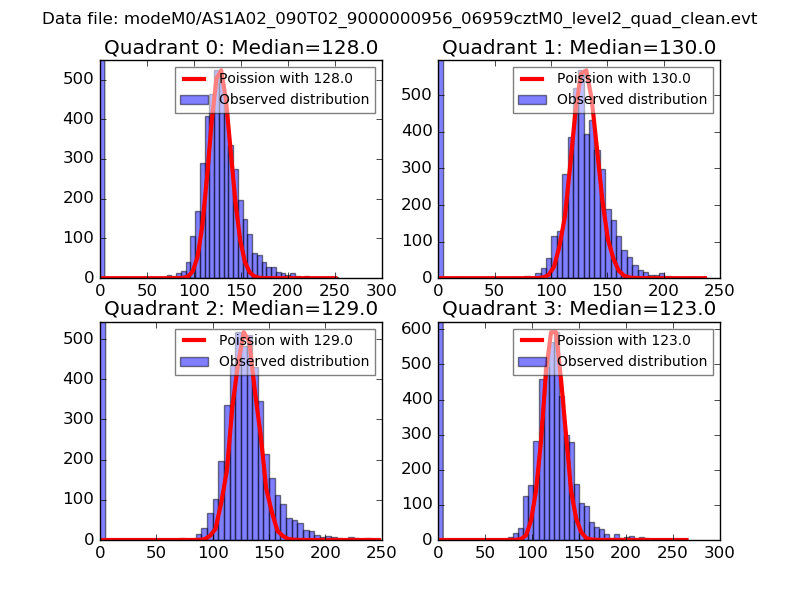 |
 |
| Quadrant-wise count rates Data is divided into 100 sec bins |
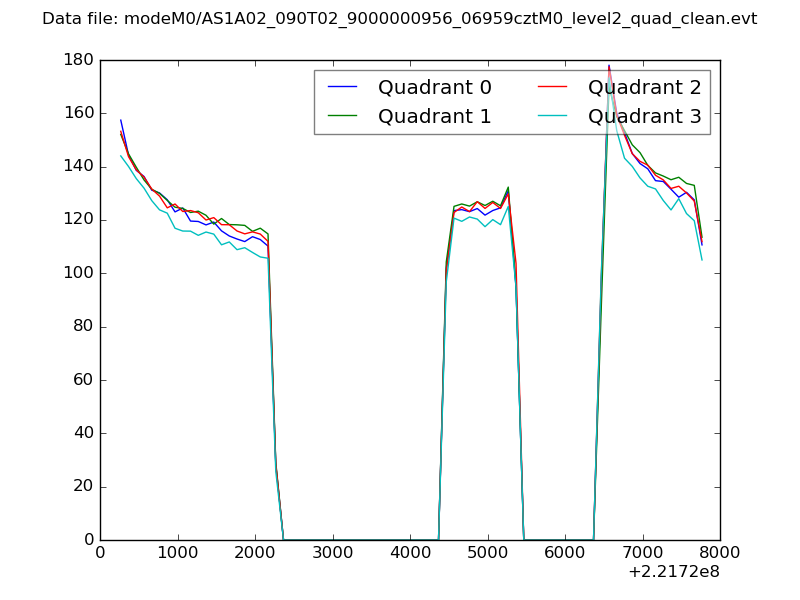 |
|
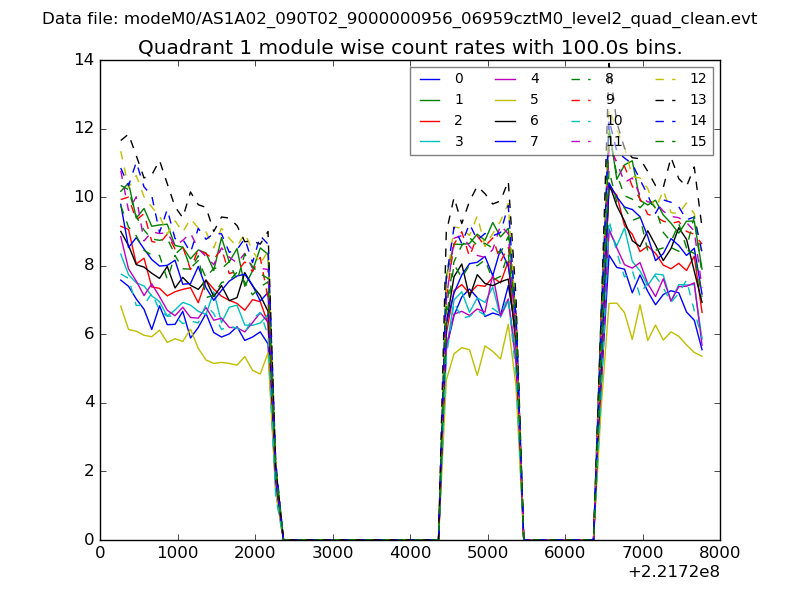
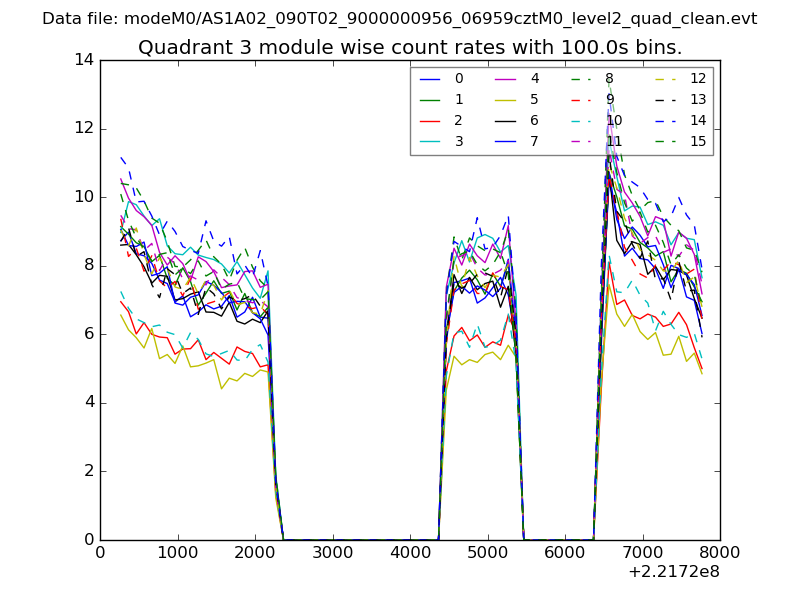
| Module-wise count rates for Quadrant A Data is divided into 100 sec bins |
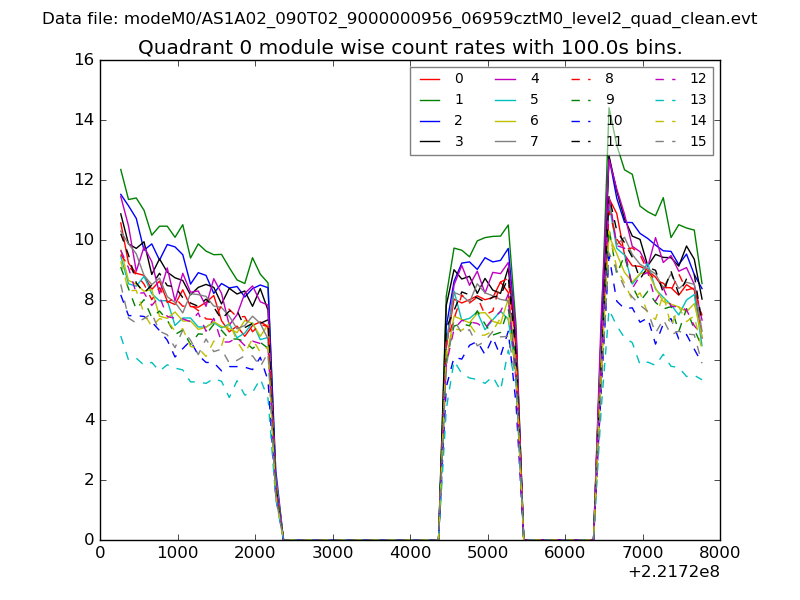 |
 |
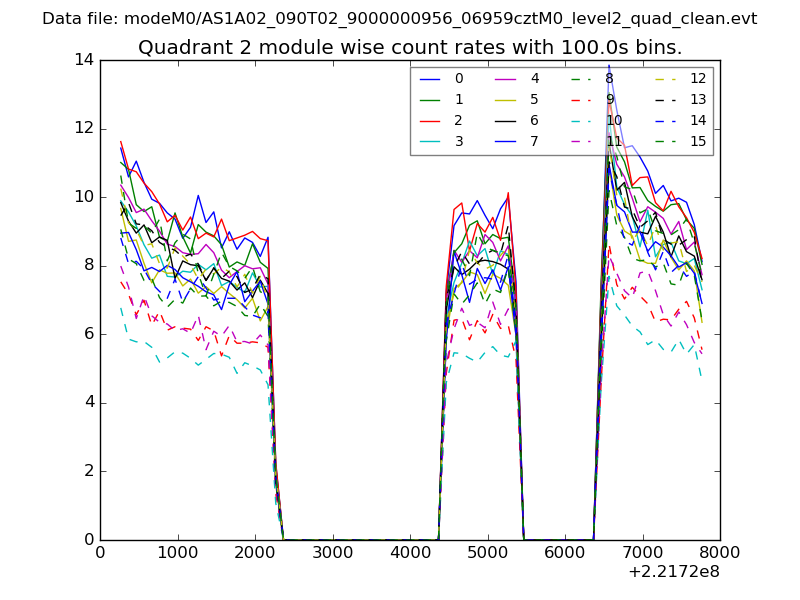
| Module-wise count rates for Quadrant B Data is divided into 100 sec bins |
 |
 |
| Module-wise count rates for Quadrant C Data is divided into 100 sec bins |
 |
 |
| Module-wise count rates for Quadrant D Data is divided into 100 sec bins |
 |
 |
| Parameter | Plot |
|---|---|
| CZT HV Monitor | 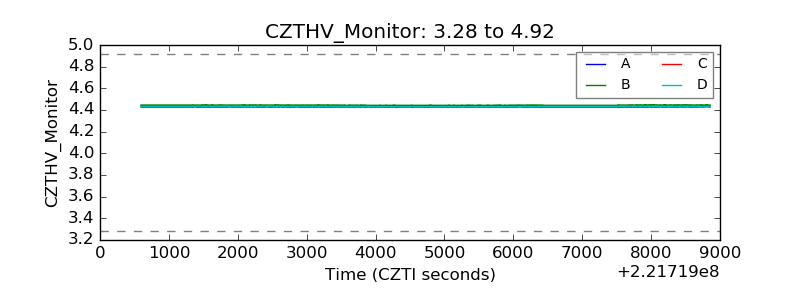 |
| D_VDD | 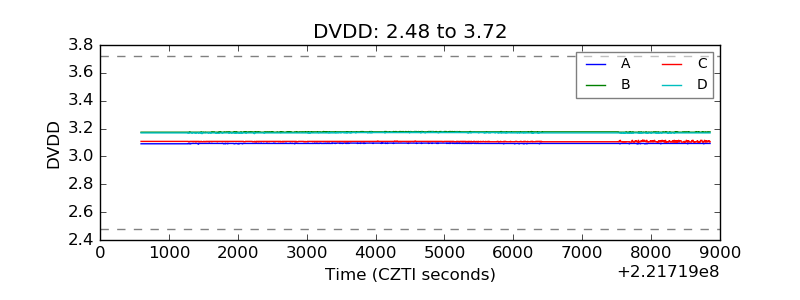 |
| Temperature 1 | 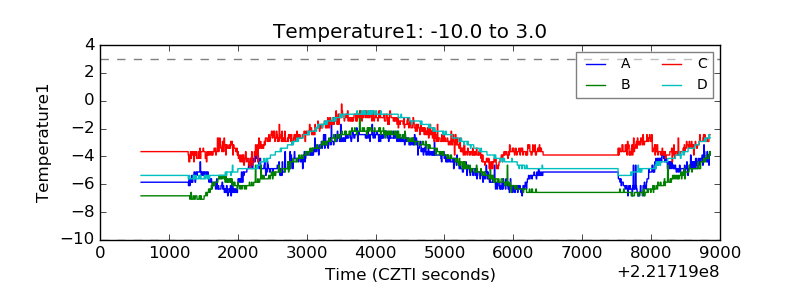 |
| Veto HV Monitor | 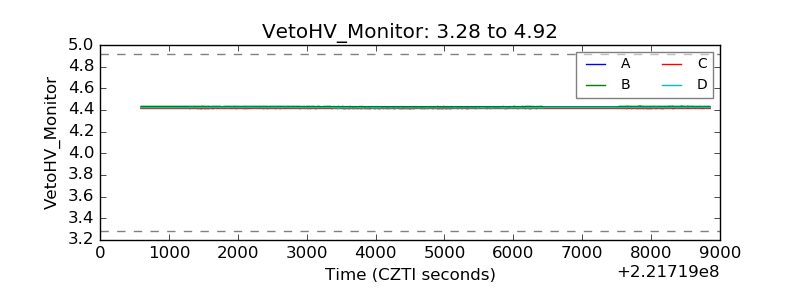 |
| Veto LLD | 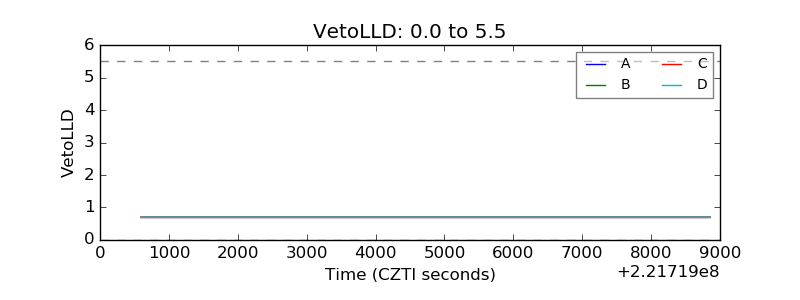 |
| Alpha Counter | 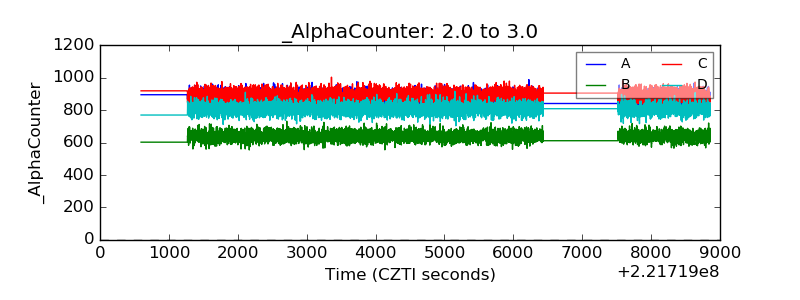 |
| _CPM_Rate | 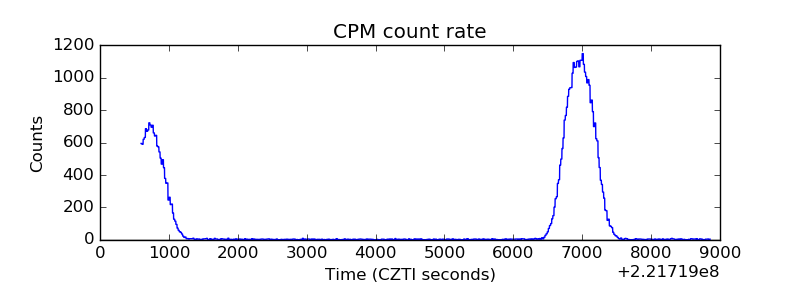 |
| CZT Counter | 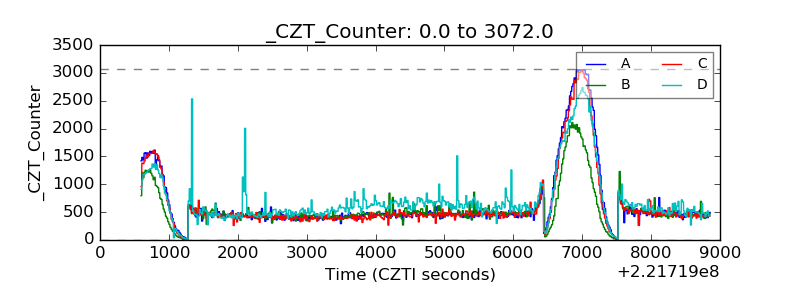 |
| +2.5 Volts monitor | 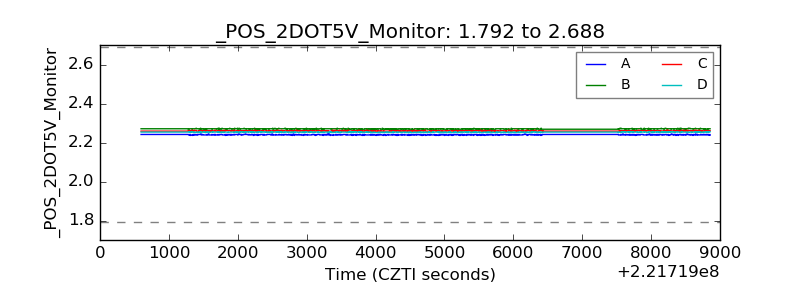 |
| +5 Volts monitor |  |
| _ROLL_ROT | 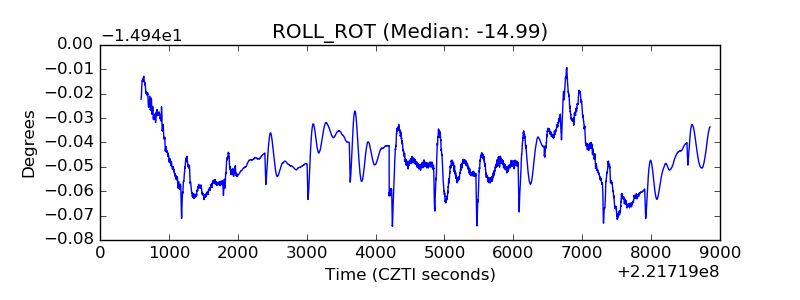 |
| _Roll_DEC | 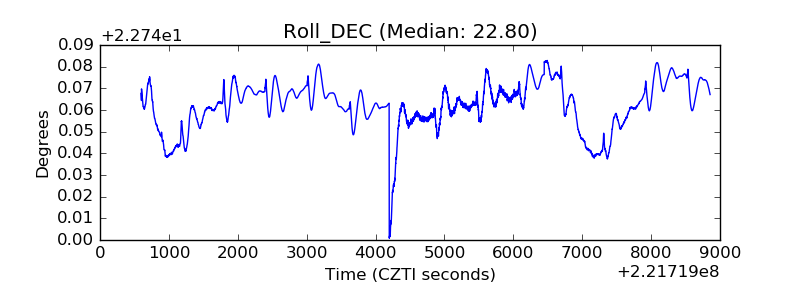 |
| _Roll_RA | 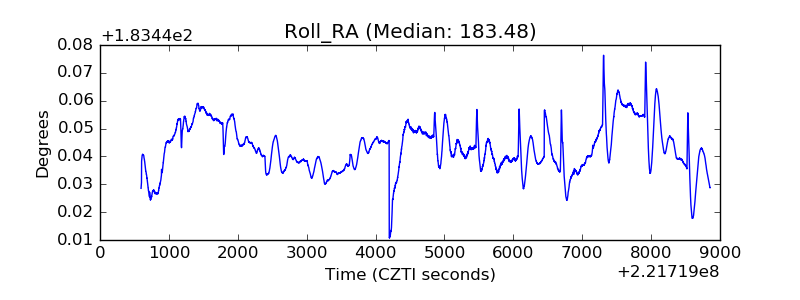 |
| Veto Counter | 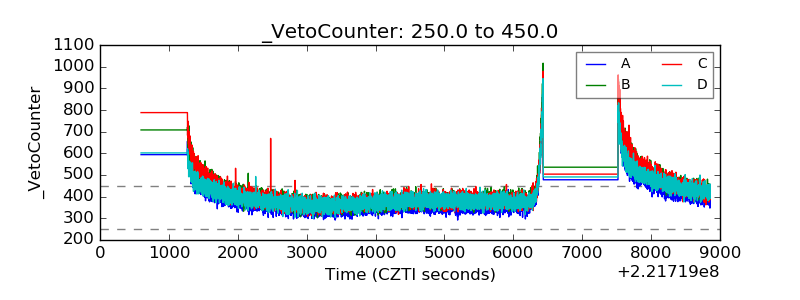 |