| Param | Original file | Final file |
|---|---|---|
| Filename | modeM0/AS1A02_090T02_9000000956_06962cztM0_level2.evt | modeM0/AS1A02_090T02_9000000956_06962cztM0_level2_quad_clean.evt |
| Size (bytes) | 474,926,400 | 70,790,400 |
| Size | 452.9 MB | 67.5 MB |
| Events in quadrant A | 3,343,865 | 423,467 |
| Events in quadrant B | 3,369,592 | 430,214 |
| Events in quadrant C | 3,247,837 | 426,729 |
| Events in quadrant D | 3,979,410 | 408,646 |
| Mode M0 | |||
|---|---|---|---|
| Quadrant | BADHDUFLAG | Total packets | Discarded packets |
| A | 0 | 13831 | 1 |
| B | 0 | 13821 | 0 |
| C | 0 | 13622 | 0 |
| D | 0 | 15932 | 0 |
| Mode SS | |||
|---|---|---|---|
| Quadrant | BADHDUFLAG | Total packets | Discarded packets |
| A | 0 | 130 | 0 |
| B | 0 | 130 | 0 |
| C | 0 | 130 | 0 |
| D | 0 | 130 | 0 |
| Mode M9 | |||
|---|---|---|---|
| Quadrant | BADHDUFLAG | Total packets | Discarded packets |
| A | 0 | 13 | 0 |
| B | 0 | 13 | 0 |
| C | 0 | 13 | 0 |
| D | 0 | 13 | 0 |
| Quadrant | Total seconds | Saturated seconds | Saturation percentage |
|---|---|---|---|
| A | 6522 | 133 | 2.039252% |
| B | 6522 | 123 | 1.885925% |
| C | 6522 | 108 | 1.655934% |
| D | 6522 | 175 | 2.683226% |
Noise dominated data is calculated using 1-second bins in cleaned event files. If a bin has >2000 counts, and if more than 50% of those come from <1% of pixels, then it is considered to be noise-dominated and hence unusable.
| Quadrant | # 1 sec bins | Bins with >0 counts | Bins with >2000 counts | High rate bins dominated by noise | Noise dominated (total time) | Noise dominated (detector-on time) | Marked lightcurve |
|---|---|---|---|---|---|---|---|
| A | 7772 | 6523 | 1 | 1 | 0.01% | 0.02% | 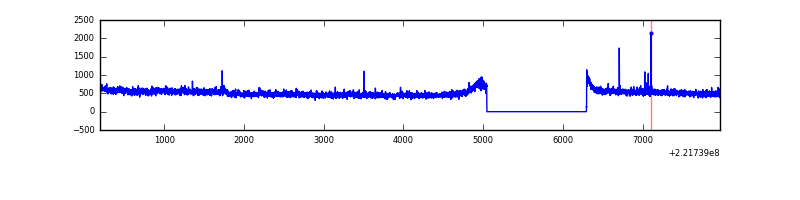 |
| B | 7772 | 6523 | 1 | 1 | 0.01% | 0.02% | 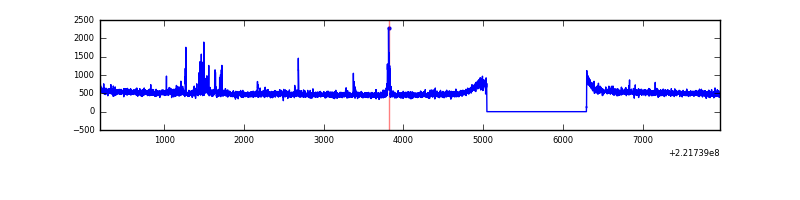 |
| C | 7772 | 6523 | 0 | 0 | 0.00% | 0.00% | 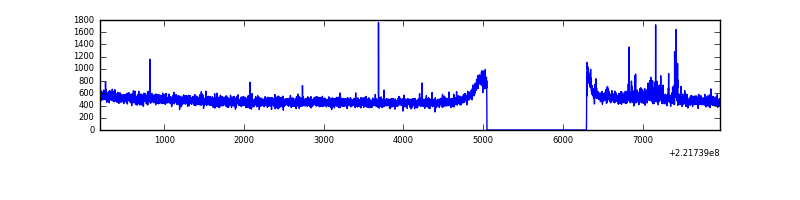 |
| D | 7772 | 6523 | 52 | 52 | 0.67% | 0.80% | 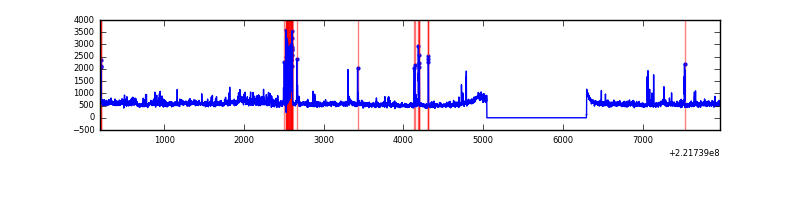 |
Top three noisy pixels from each quadrant. If the there are fewer than three noisy pixels in the level2.evt file, extra rows are filled as -1
| Pixel properties | Quadrant properties | ||||||
|---|---|---|---|---|---|---|---|
| Quadrant | DetID | PixID | Counts | Sigma | Mean | Median | Sigma |
| A | 14 | 111 | 59725 | 345.33 | 843 | 825 | 170.6 |
| A | 4 | 2 | 20467 | 115.16 | 843 | 825 | 170.6 |
| A | 13 | 14 | 10181 | 54.85 | 843 | 825 | 170.6 |
| B | 0 | 189 | 36679 | 226.43 | 840 | 821 | 158.4 |
| B | 0 | 229 | 25383 | 155.1 | 840 | 821 | 158.4 |
| B | 4 | 81 | 15824 | 94.74 | 840 | 821 | 158.4 |
| C | 7 | 247 | 49698 | 259.28 | 819 | 824 | 188.5 |
| C | 13 | 61 | 6350 | 29.32 | 819 | 824 | 188.5 |
| C | 12 | 4 | 3956 | 16.62 | 819 | 824 | 188.5 |
| D | 8 | 195 | 513718 | 2558.15 | 821 | 795 | 200.5 |
| D | 12 | 233 | 179138 | 889.47 | 821 | 795 | 200.5 |
| D | 2 | 136 | 116867 | 578.9 | 821 | 795 | 200.5 |
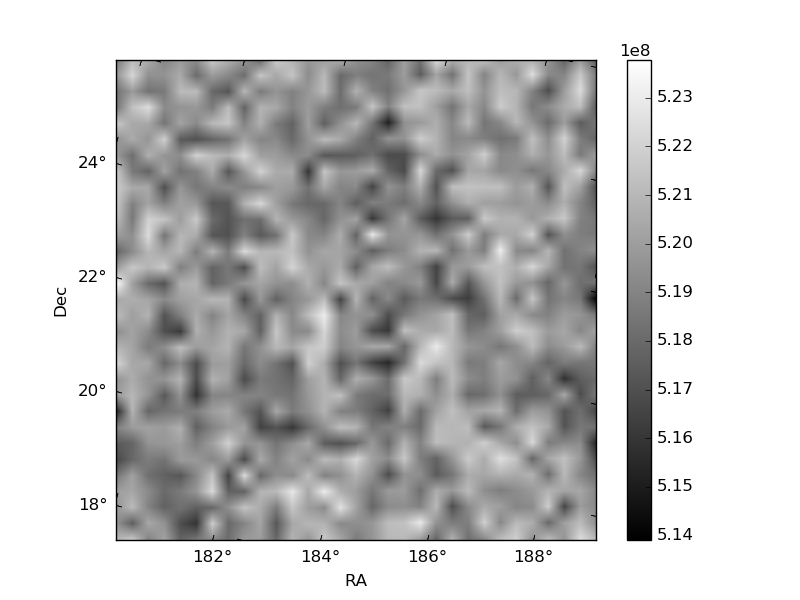
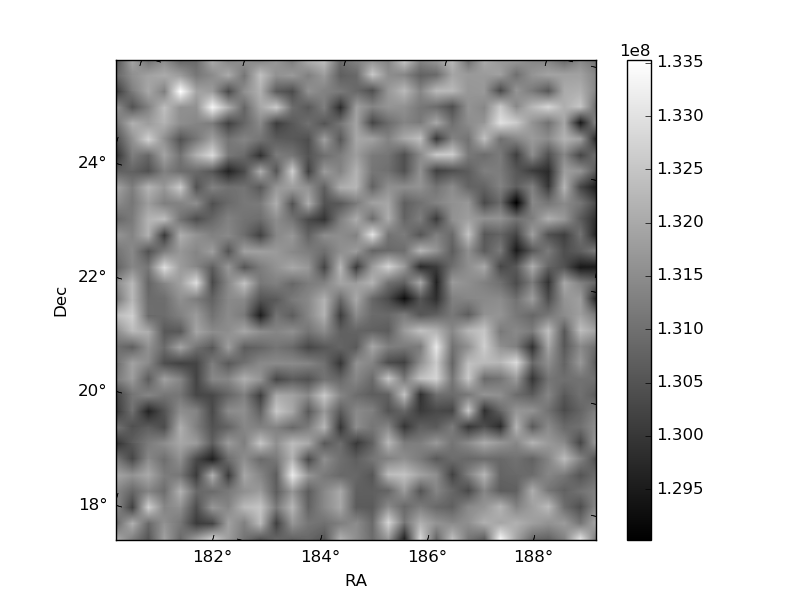
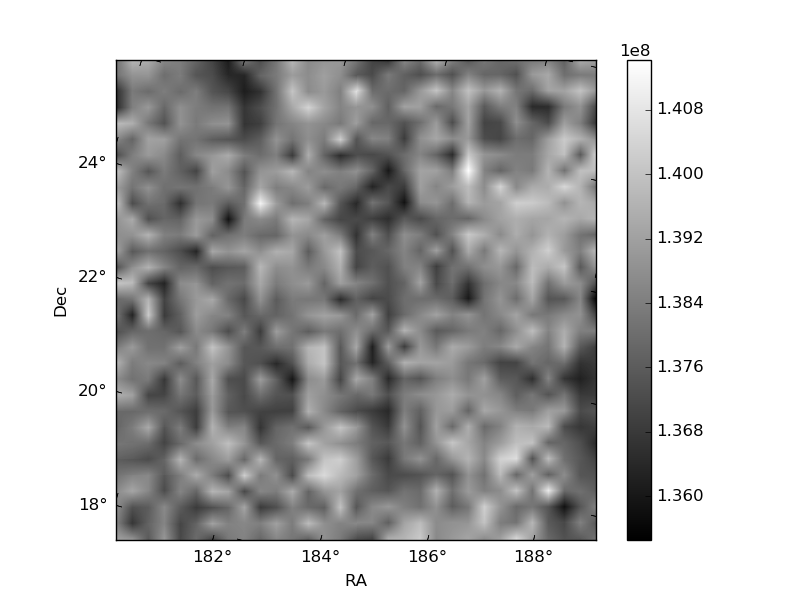
Histogram calculated using DETX and DETY for each event in the final _common_clean file
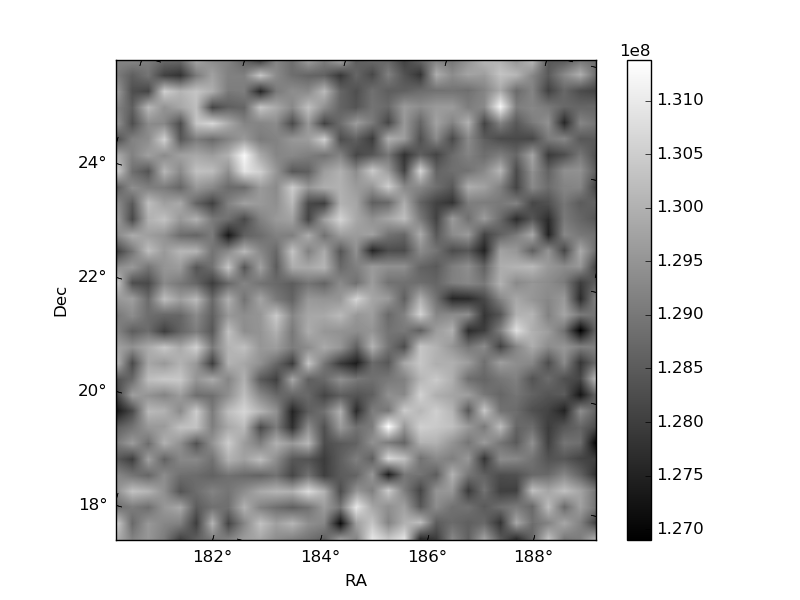
| Quadrant A | 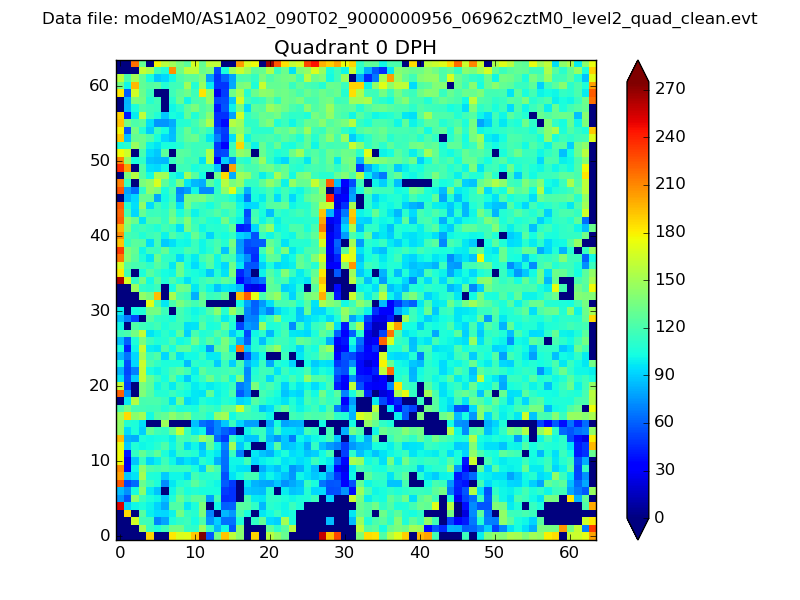 |
 |
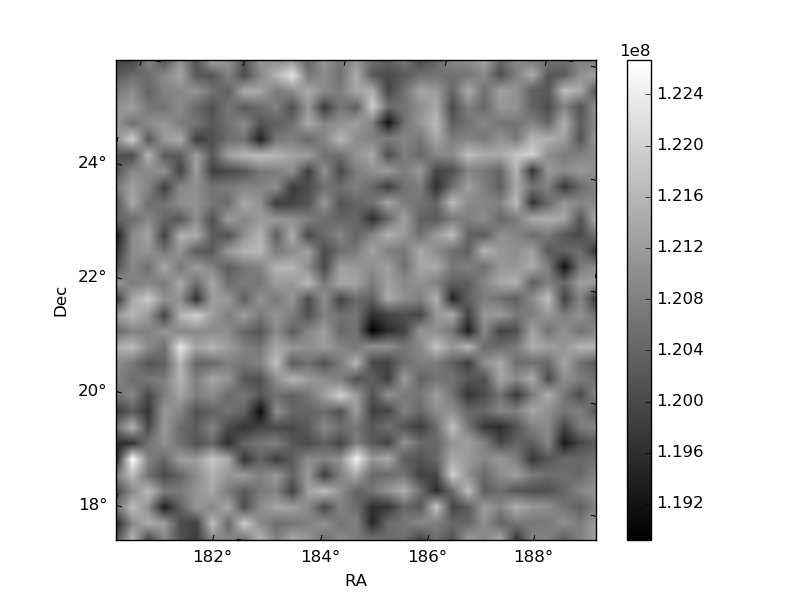
Quadrant B |
|---|---|---|---|
| Quadrant D | 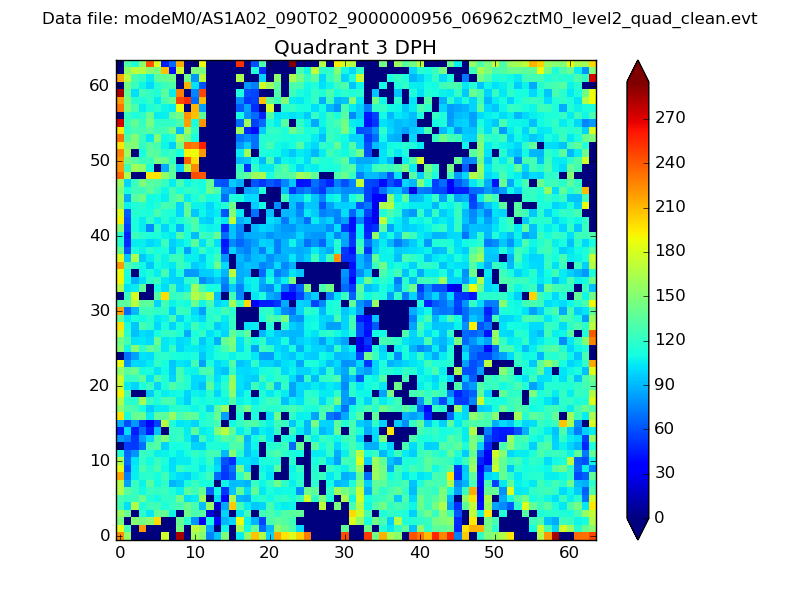 |
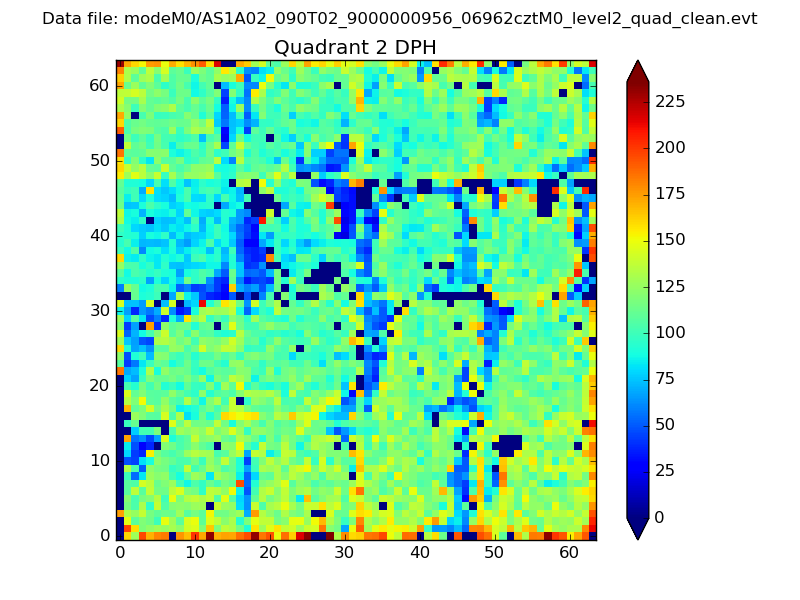 |
Quadrant C |
| Plot type | Count rate plots | Images |
|---|---|---|
| Comparison with Poisson distribution Blue bars denote a histogram of data divided into 1 sec bins. Red curve is a Poisson curve with rate = median count rate of data. |
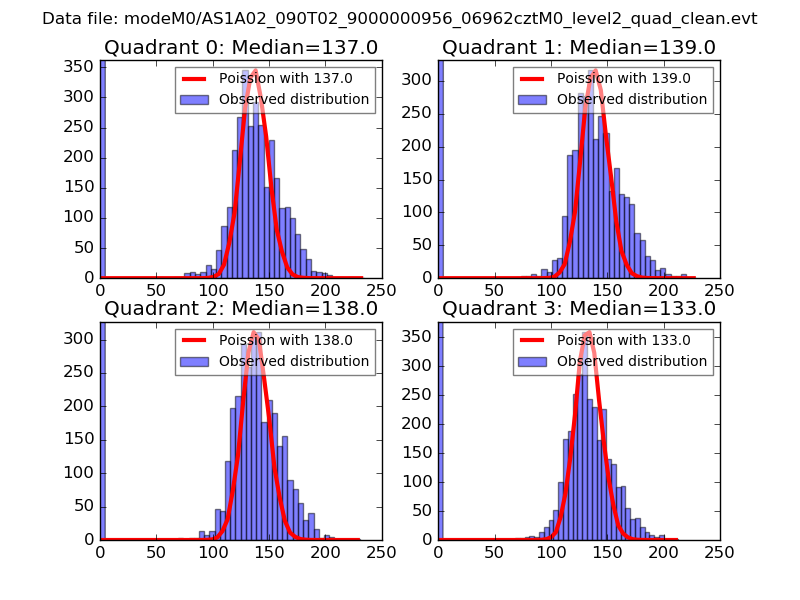 |
 |
| Quadrant-wise count rates Data is divided into 100 sec bins |
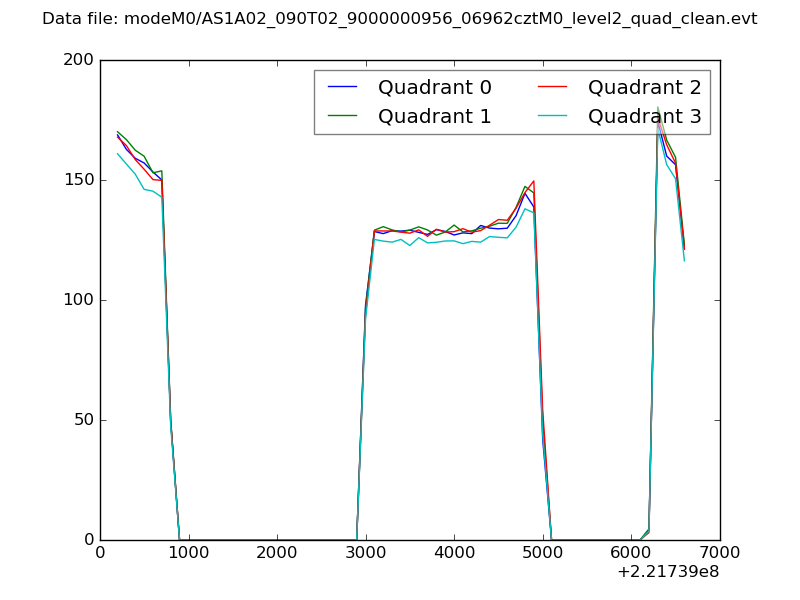 |
|
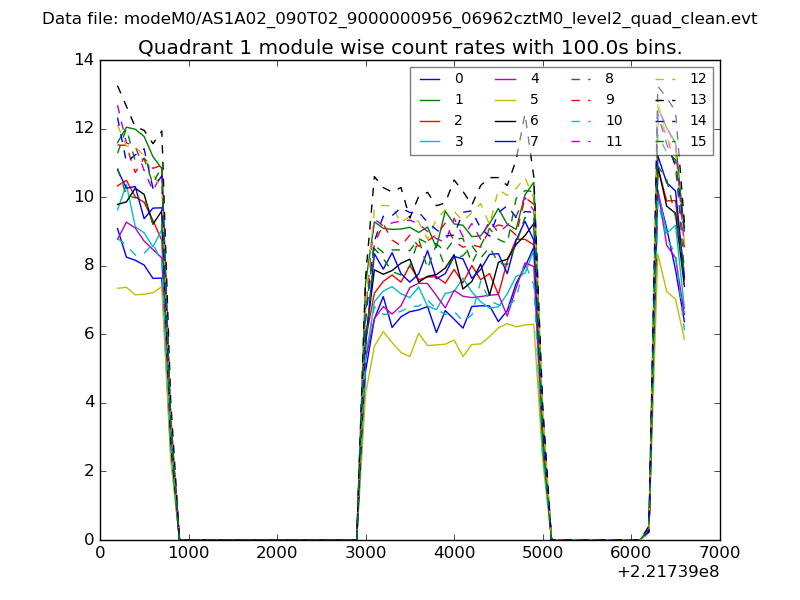
| Module-wise count rates for Quadrant A Data is divided into 100 sec bins |
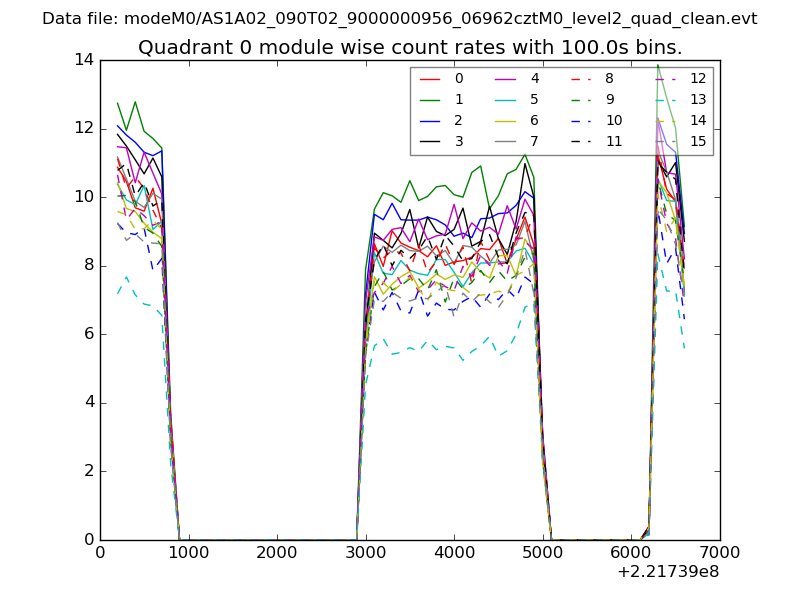 |
 |
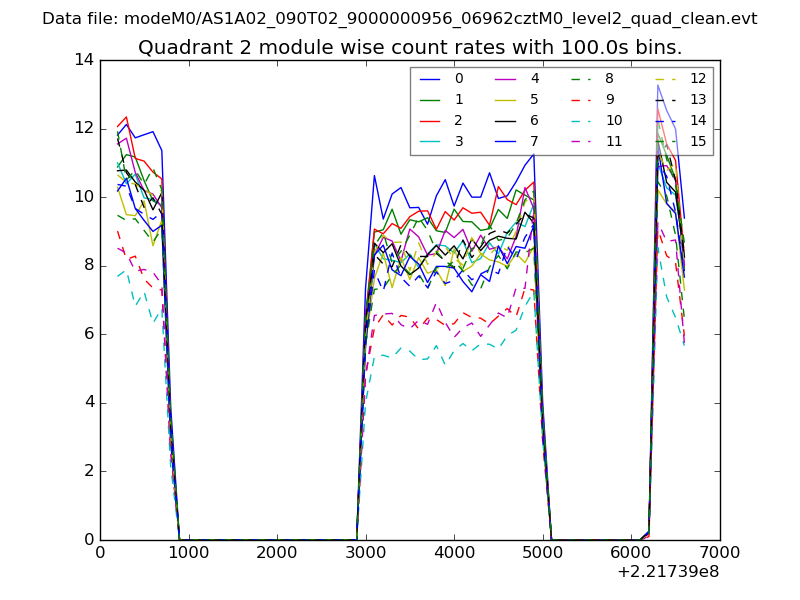
| Module-wise count rates for Quadrant B Data is divided into 100 sec bins |
 |
 |
| Module-wise count rates for Quadrant C Data is divided into 100 sec bins |
 |
 |
| Module-wise count rates for Quadrant D Data is divided into 100 sec bins |
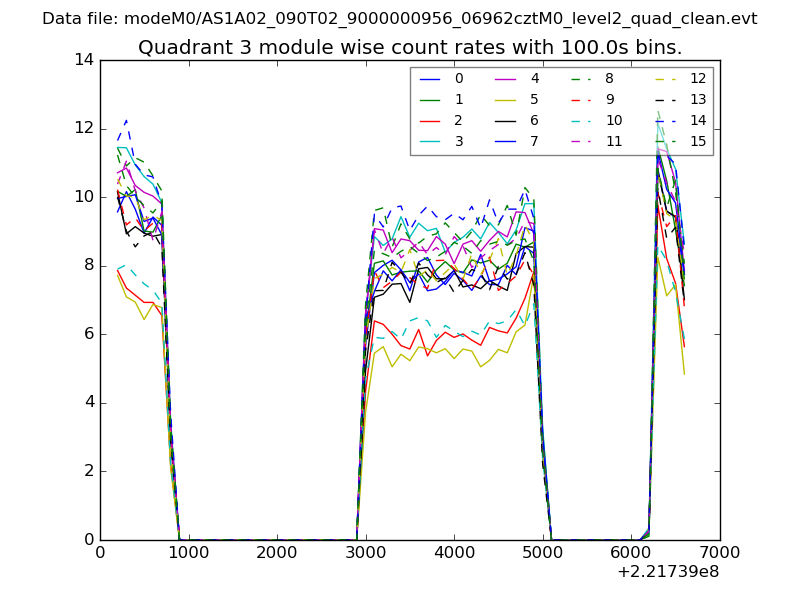 |
 |
| Parameter | Plot |
|---|---|
| CZT HV Monitor | 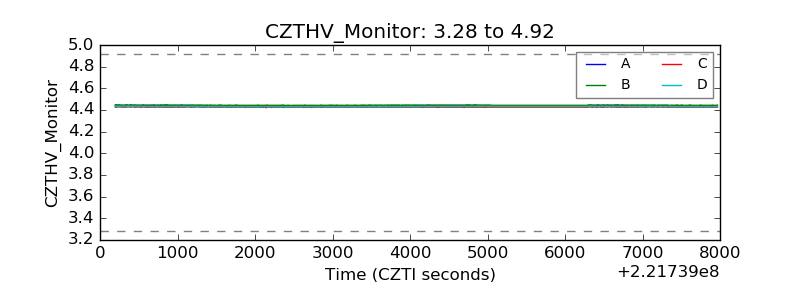 |
| D_VDD | 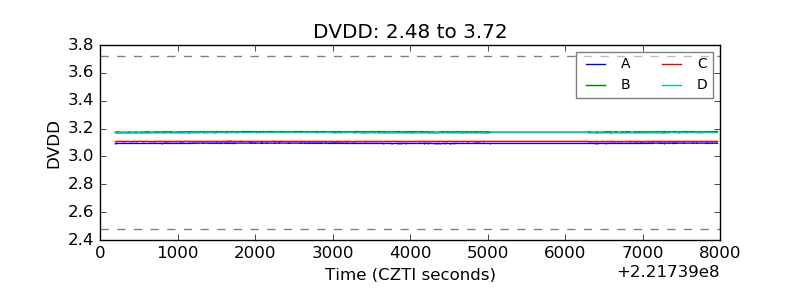 |
| Temperature 1 | 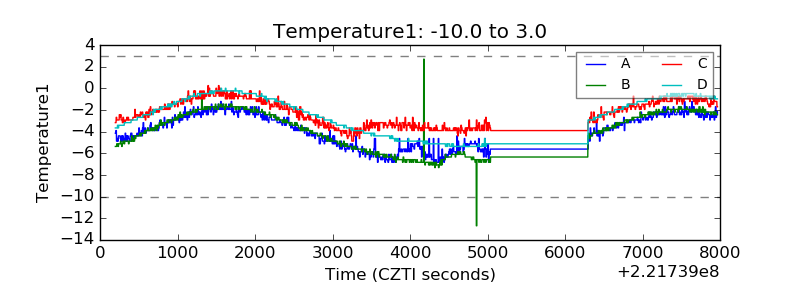 |
| Veto HV Monitor | 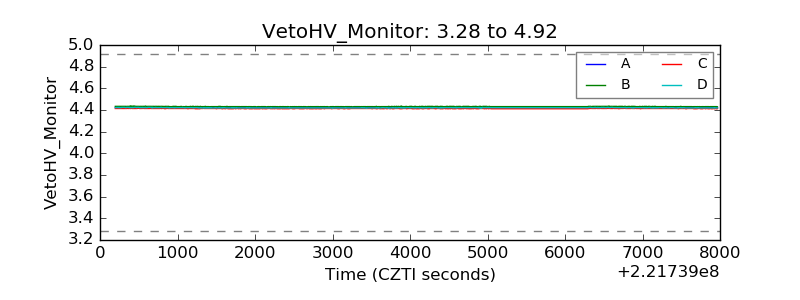 |
| Veto LLD | 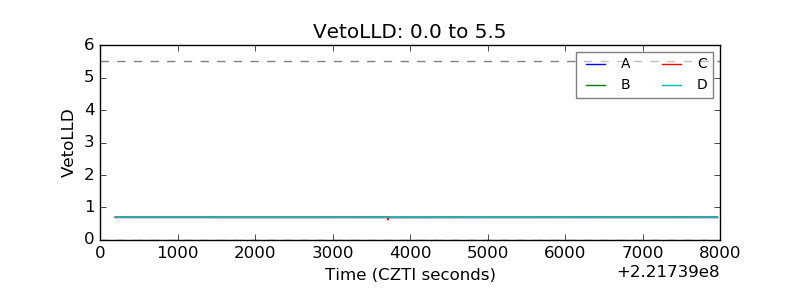 |
| Alpha Counter | 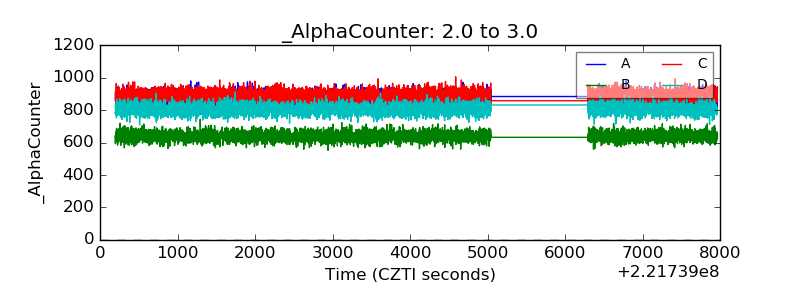 |
| _CPM_Rate | 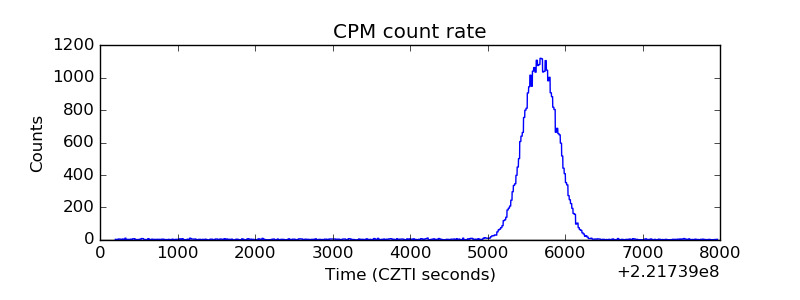 |
| CZT Counter | 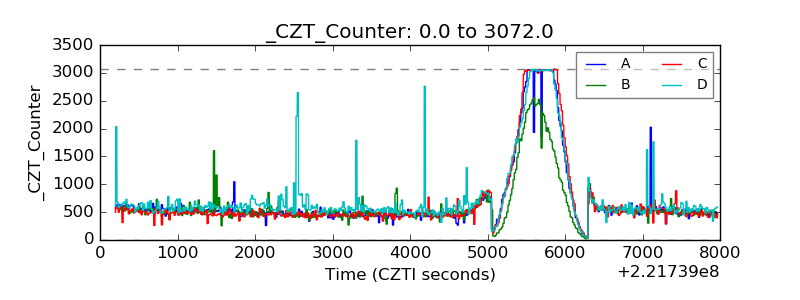 |
| +2.5 Volts monitor | 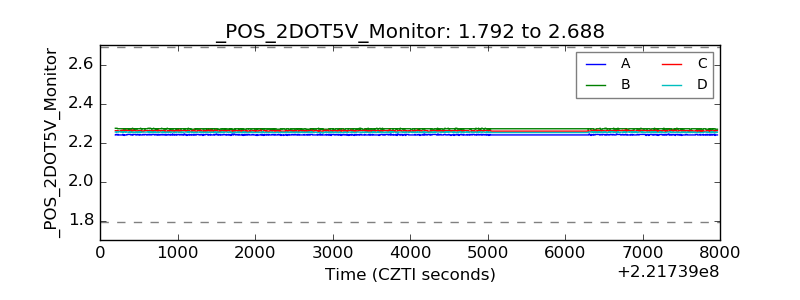 |
| +5 Volts monitor | 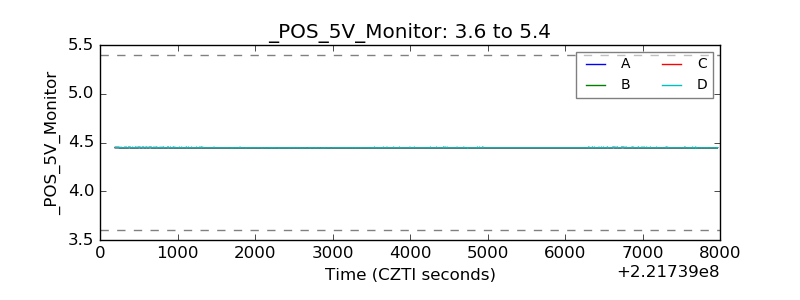 |
| _ROLL_ROT | 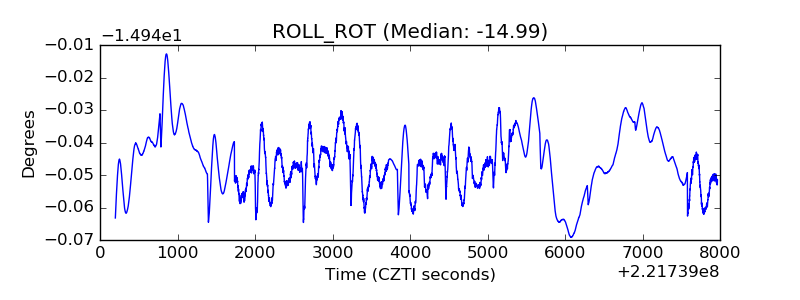 |
| _Roll_DEC | 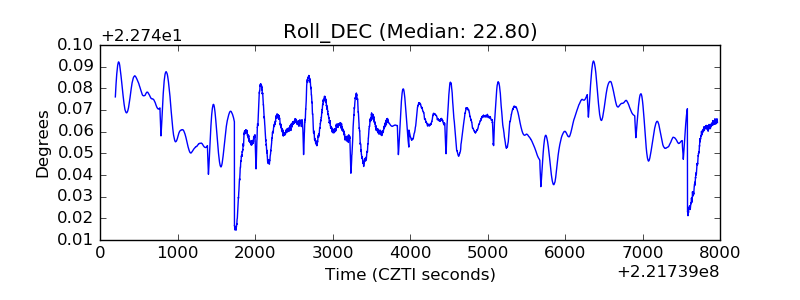 |
| _Roll_RA | 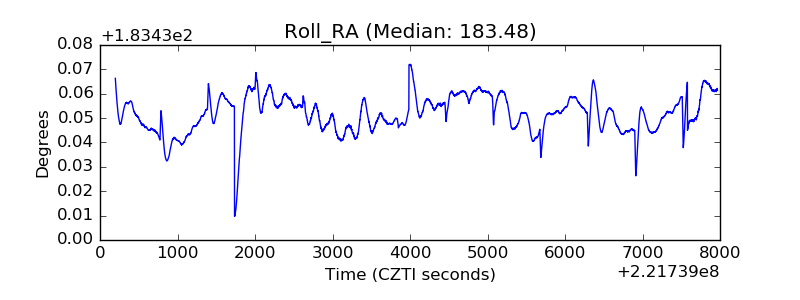 |
| Veto Counter | 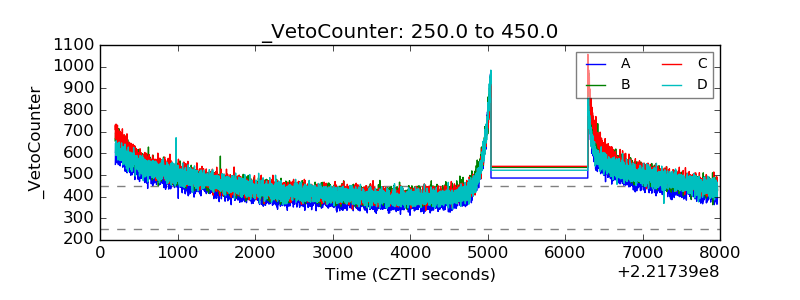 |