| Param | Original file | Final file |
|---|---|---|
| Filename | modeM0/AS1A02_090T02_9000000956_06964cztM0_level2.evt | modeM0/AS1A02_090T02_9000000956_06964cztM0_level2_quad_clean.evt |
| Size (bytes) | 473,840,640 | 65,957,760 |
| Size | 451.9 MB | 62.9 MB |
| Events in quadrant A | 3,246,234 | 383,249 |
| Events in quadrant B | 3,406,172 | 384,234 |
| Events in quadrant C | 3,218,647 | 385,406 |
| Events in quadrant D | 4,016,405 | 369,233 |
| Mode M0 | |||
|---|---|---|---|
| Quadrant | BADHDUFLAG | Total packets | Discarded packets |
| A | 0 | 14097 | 3 |
| B | 0 | 14500 | 2 |
| C | 0 | 14107 | 2 |
| D | 0 | 16363 | 2 |
| Mode SS | |||
|---|---|---|---|
| Quadrant | BADHDUFLAG | Total packets | Discarded packets |
| A | 0 | 138 | 0 |
| B | 0 | 138 | 0 |
| C | 0 | 138 | 0 |
| D | 0 | 138 | 0 |
| Mode M9 | |||
|---|---|---|---|
| Quadrant | BADHDUFLAG | Total packets | Discarded packets |
| A | 0 | 11 | 0 |
| B | 0 | 11 | 0 |
| C | 0 | 11 | 0 |
| D | 0 | 12 | 0 |
| Quadrant | Total seconds | Saturated seconds | Saturation percentage |
|---|---|---|---|
| A | 6814 | 70 | 1.027297% |
| B | 6814 | 91 | 1.335486% |
| C | 6814 | 62 | 0.909891% |
| D | 6814 | 74 | 1.085999% |
Noise dominated data is calculated using 1-second bins in cleaned event files. If a bin has >2000 counts, and if more than 50% of those come from <1% of pixels, then it is considered to be noise-dominated and hence unusable.
| Quadrant | # 1 sec bins | Bins with >0 counts | Bins with >2000 counts | High rate bins dominated by noise | Noise dominated (total time) | Noise dominated (detector-on time) | Marked lightcurve |
|---|---|---|---|---|---|---|---|
| A | 7804 | 6815 | 0 | 0 | 0.00% | 0.00% | 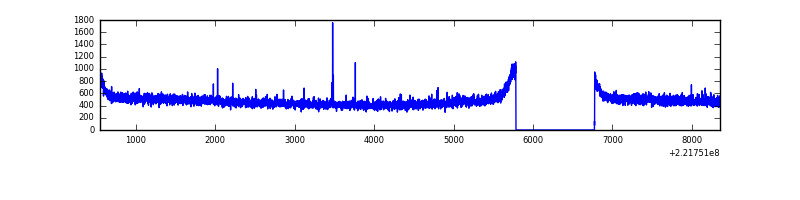 |
| B | 7804 | 6815 | 7 | 7 | 0.09% | 0.10% | 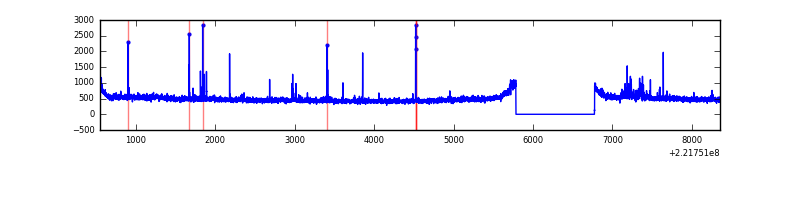 |
| C | 7804 | 6815 | 0 | 0 | 0.00% | 0.00% | 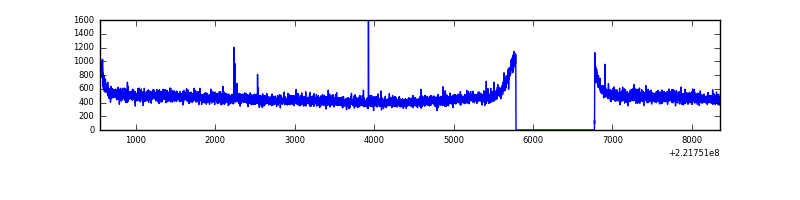 |
| D | 7804 | 6815 | 8 | 8 | 0.10% | 0.12% | 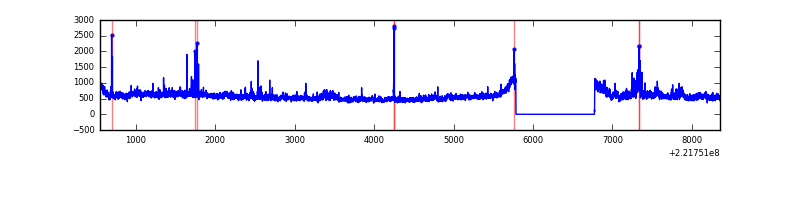 |
Top three noisy pixels from each quadrant. If the there are fewer than three noisy pixels in the level2.evt file, extra rows are filled as -1
| Pixel properties | Quadrant properties | ||||||
|---|---|---|---|---|---|---|---|
| Quadrant | DetID | PixID | Counts | Sigma | Mean | Median | Sigma |
| A | 4 | 2 | 9109 | 48.27 | 839 | 822 | 171.7 |
| A | 0 | 226 | 8000 | 41.81 | 839 | 822 | 171.7 |
| A | 12 | 194 | 7630 | 39.66 | 839 | 822 | 171.7 |
| B | 0 | 189 | 45222 | 274.35 | 843 | 821 | 161.8 |
| B | 0 | 187 | 18837 | 111.32 | 843 | 821 | 161.8 |
| B | 12 | 111 | 15565 | 91.1 | 843 | 821 | 161.8 |
| C | 7 | 247 | 7366 | 34.35 | 820 | 824 | 190.4 |
| C | 1 | 16 | 6647 | 30.58 | 820 | 824 | 190.4 |
| C | 13 | 61 | 6486 | 29.73 | 820 | 824 | 190.4 |
| D | 8 | 195 | 628724 | 3105.67 | 820 | 795 | 202.2 |
| D | 2 | 136 | 103222 | 506.59 | 820 | 795 | 202.2 |
| D | 1 | 20 | 77497 | 379.36 | 820 | 795 | 202.2 |
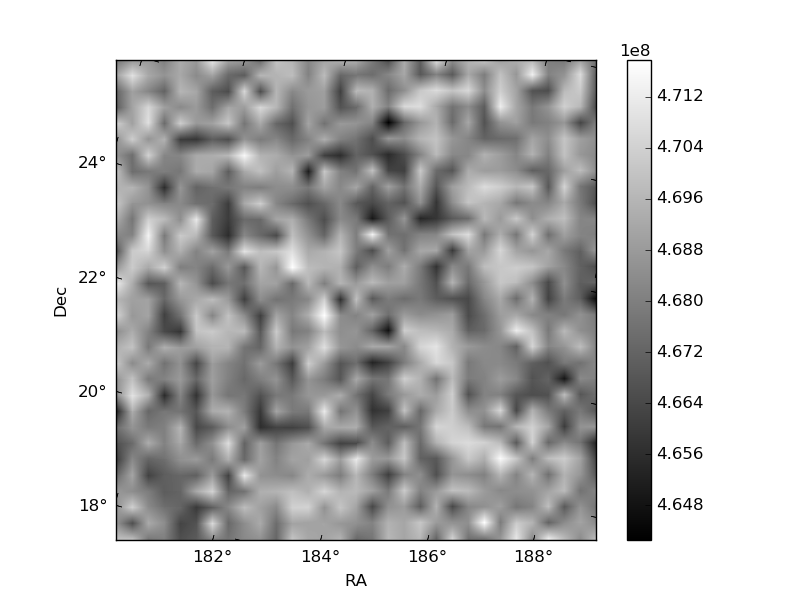
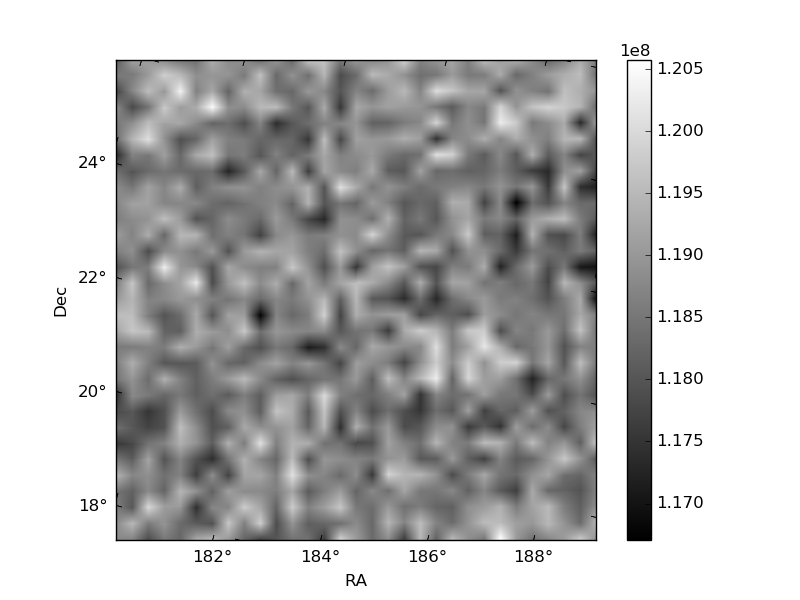
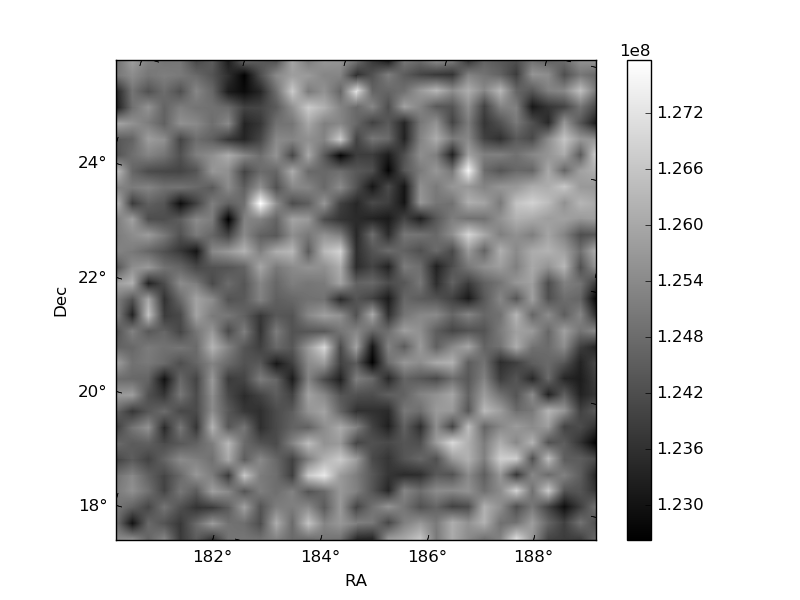
Histogram calculated using DETX and DETY for each event in the final _common_clean file
| Quadrant A | 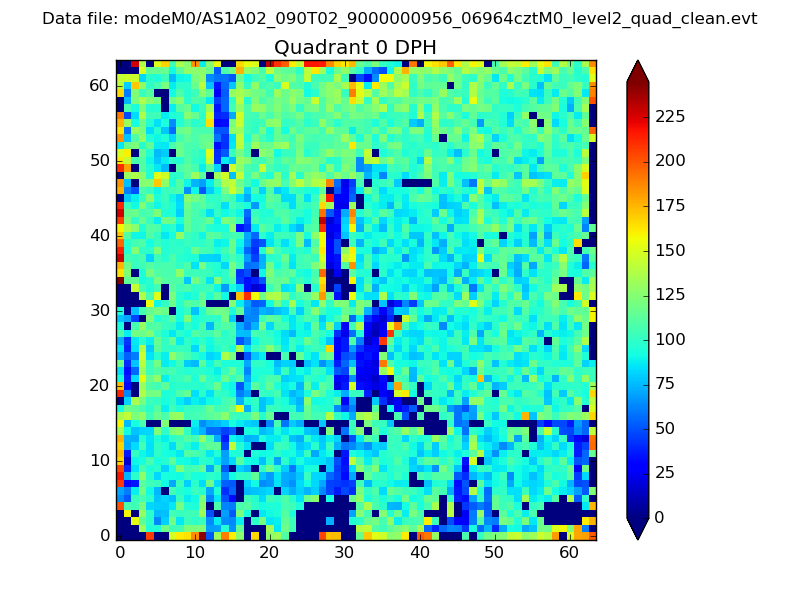 |
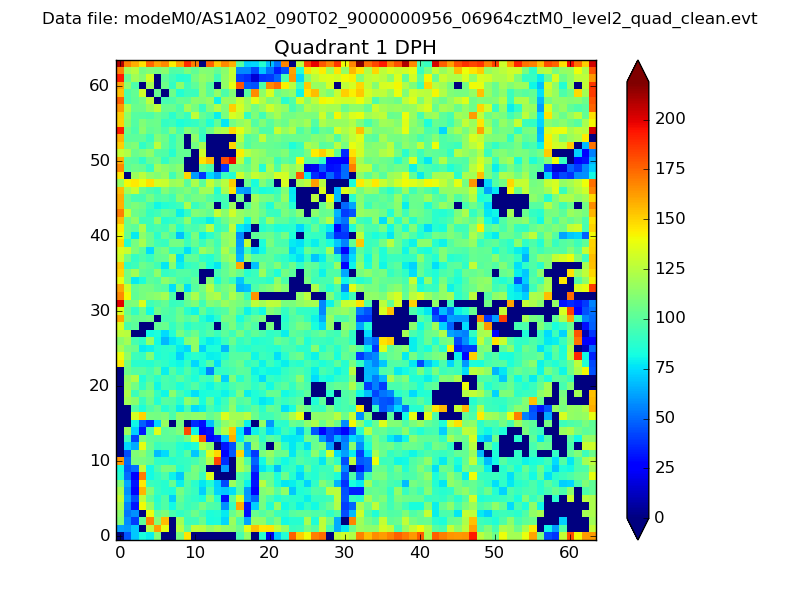 |
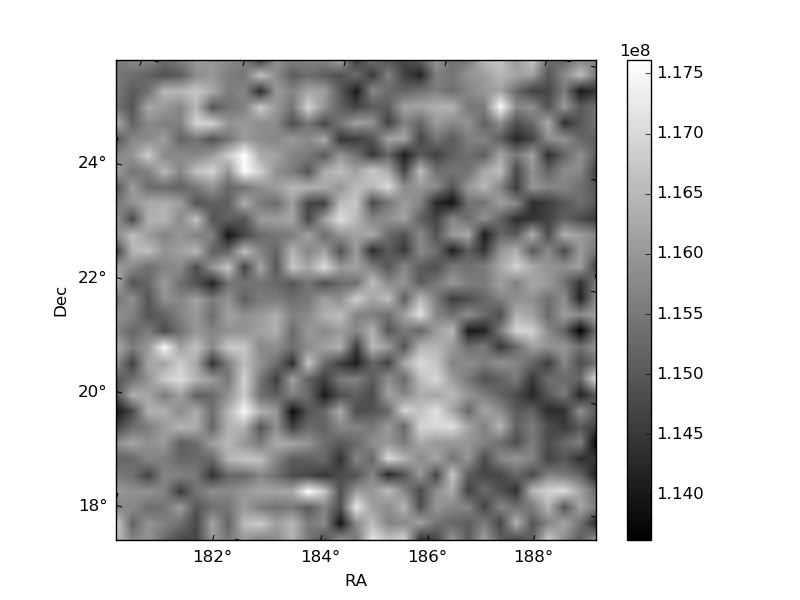
Quadrant B |
|---|---|---|---|
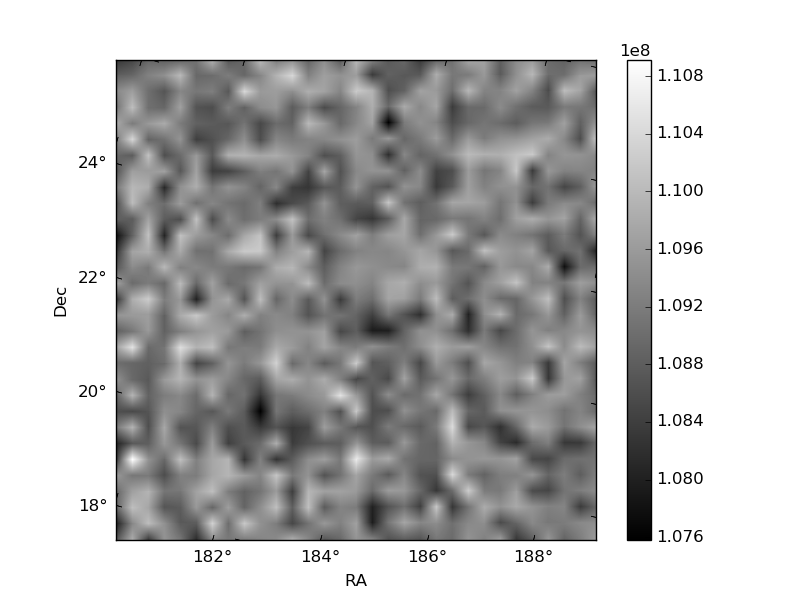
| Quadrant D | 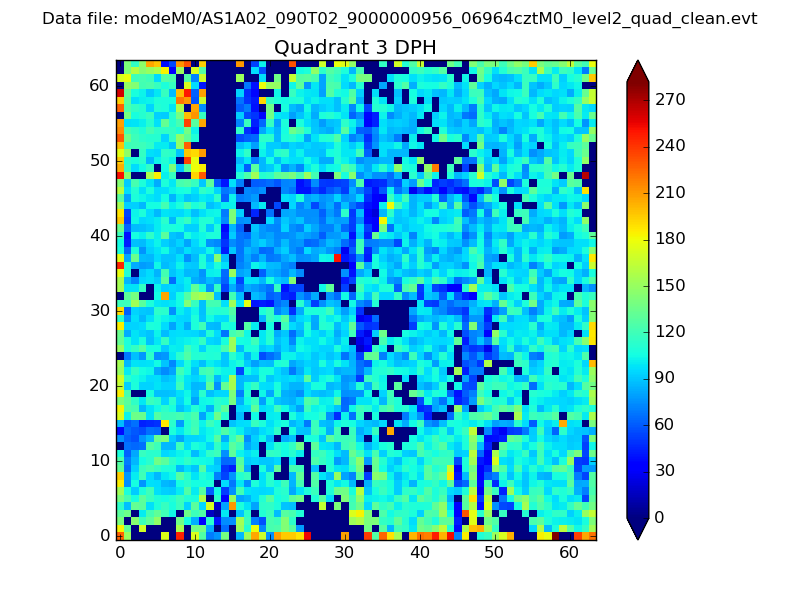 |
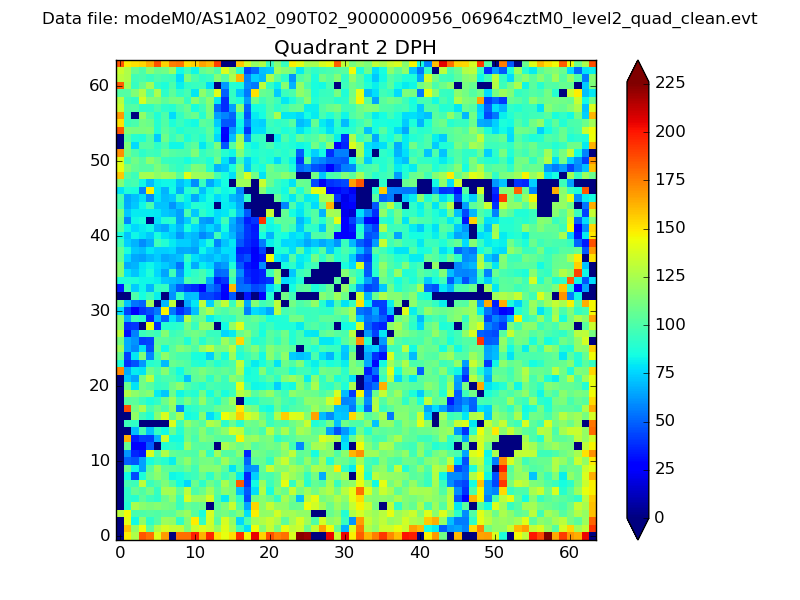 |
Quadrant C |
| Plot type | Count rate plots | Images |
|---|---|---|
| Comparison with Poisson distribution Blue bars denote a histogram of data divided into 1 sec bins. Red curve is a Poisson curve with rate = median count rate of data. |
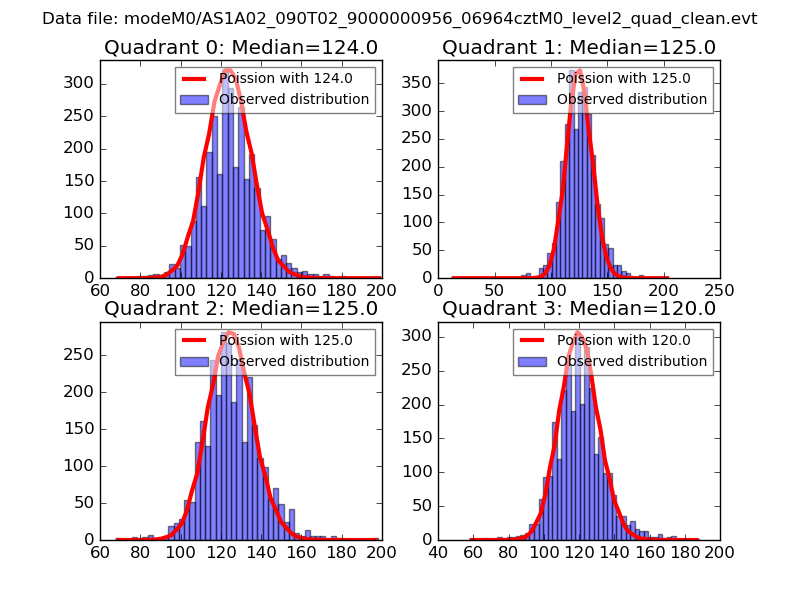 |
 |
| Quadrant-wise count rates Data is divided into 100 sec bins |
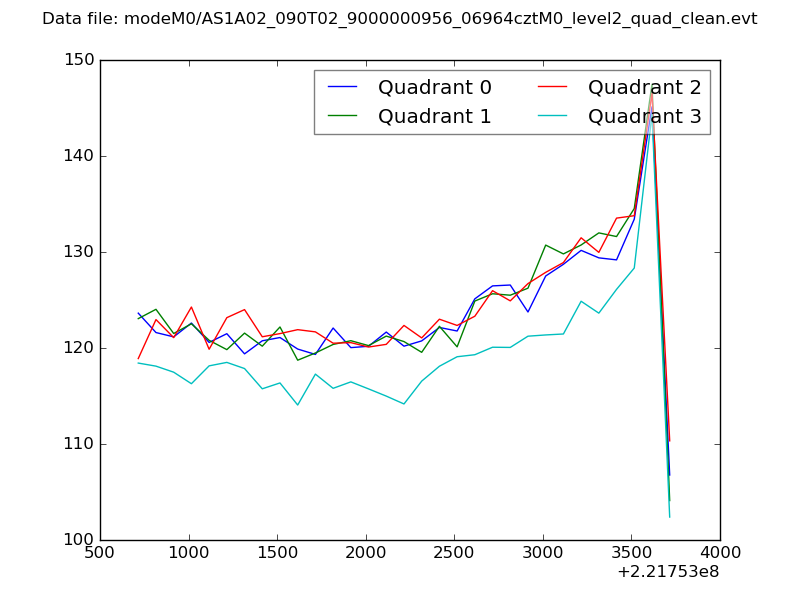 |
|
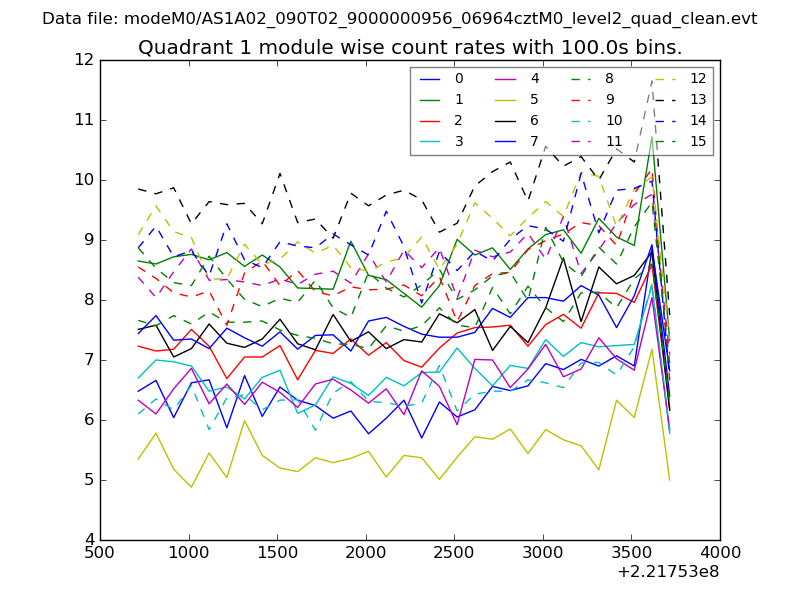
| Module-wise count rates for Quadrant A Data is divided into 100 sec bins |
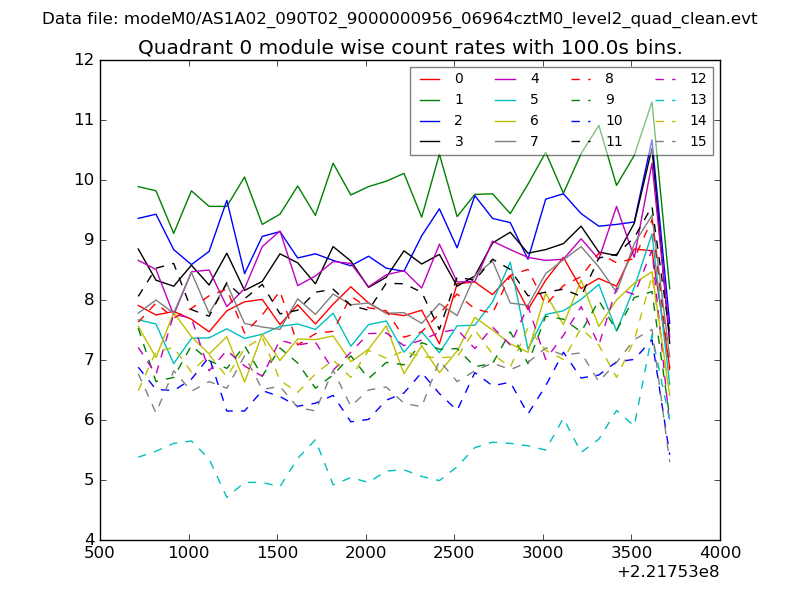 |
 |
| Module-wise count rates for Quadrant B Data is divided into 100 sec bins |
 |
 |
| Module-wise count rates for Quadrant C Data is divided into 100 sec bins |
 |
 |
| Module-wise count rates for Quadrant D Data is divided into 100 sec bins |
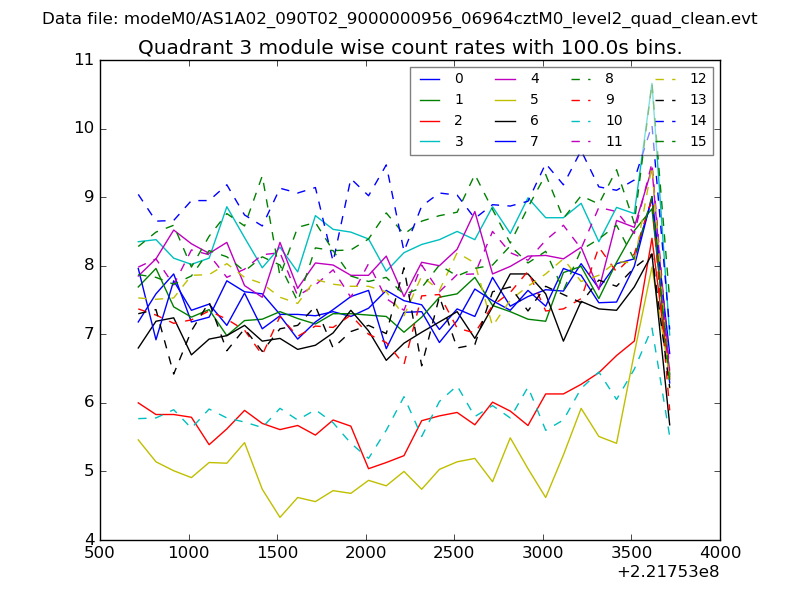 |
 |
| Parameter | Plot |
|---|---|
| CZT HV Monitor | 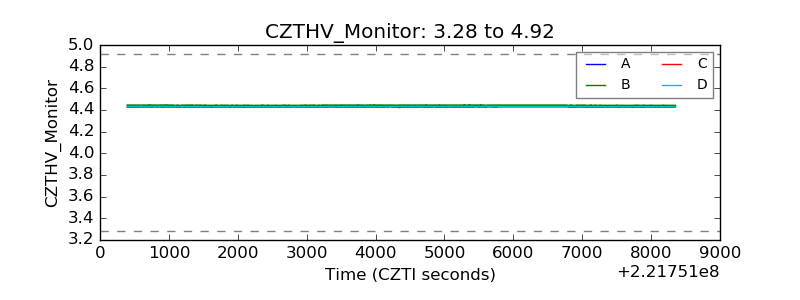 |
| D_VDD | 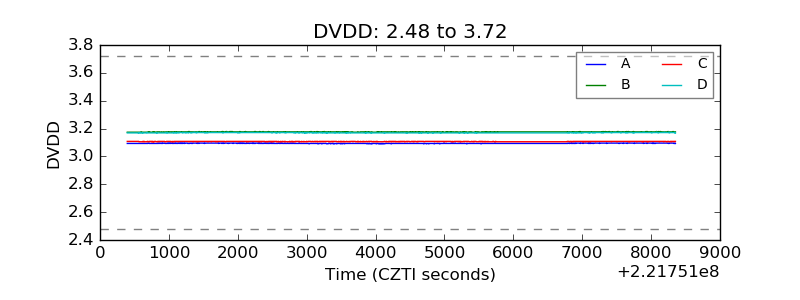 |
| Temperature 1 | 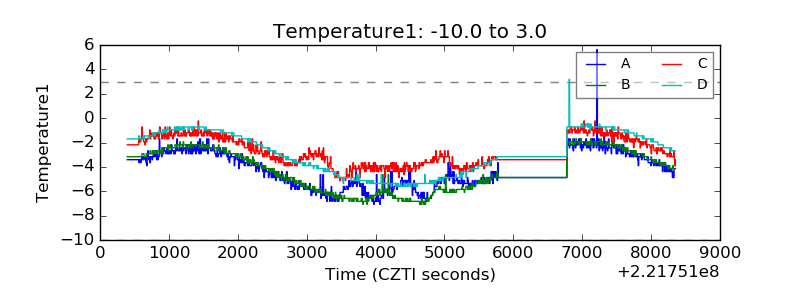 |
| Veto HV Monitor | 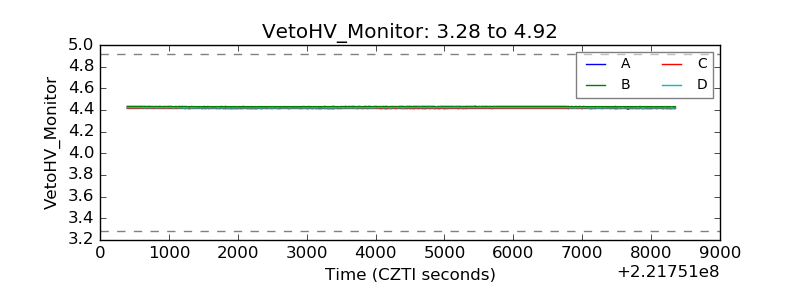 |
| Veto LLD | 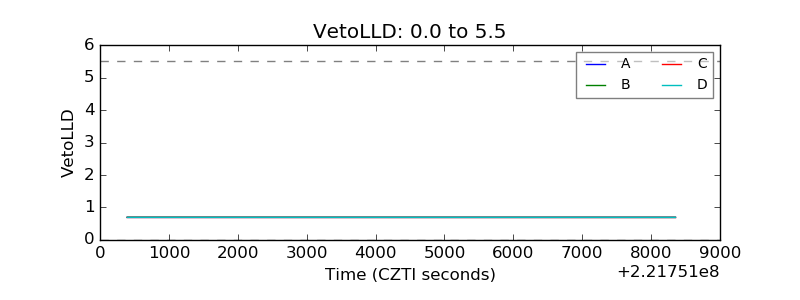 |
| Alpha Counter | 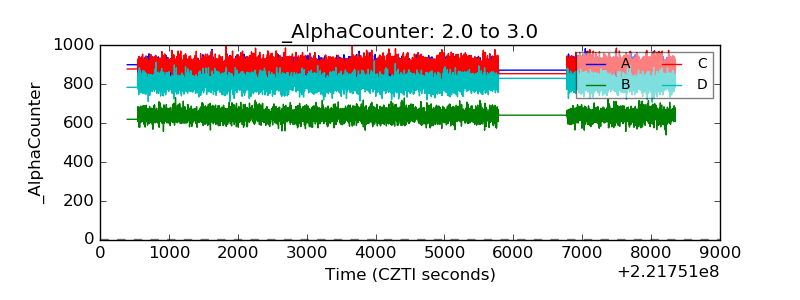 |
| _CPM_Rate | 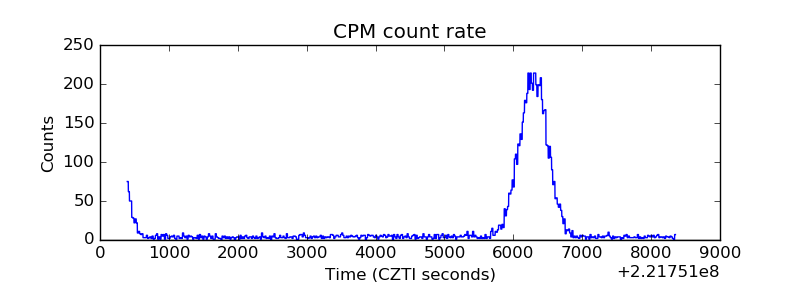 |
| CZT Counter | 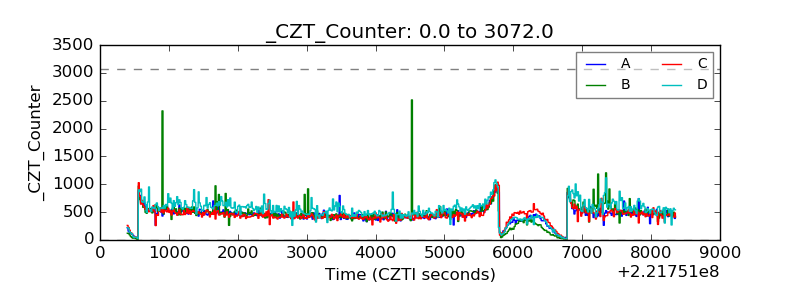 |
| +2.5 Volts monitor |  |
| +5 Volts monitor |  |
| _ROLL_ROT | 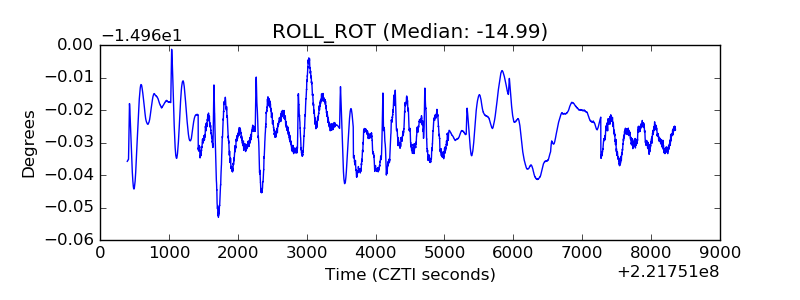 |
| _Roll_DEC | 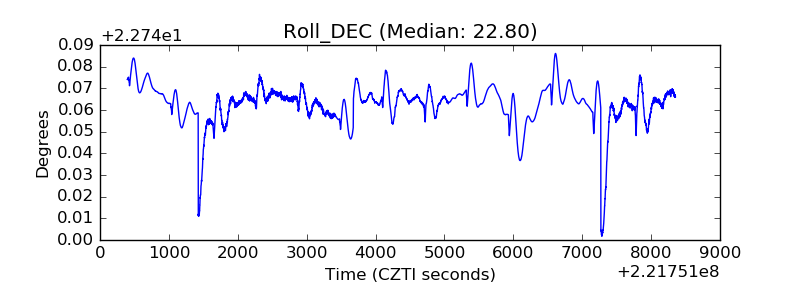 |
| _Roll_RA | 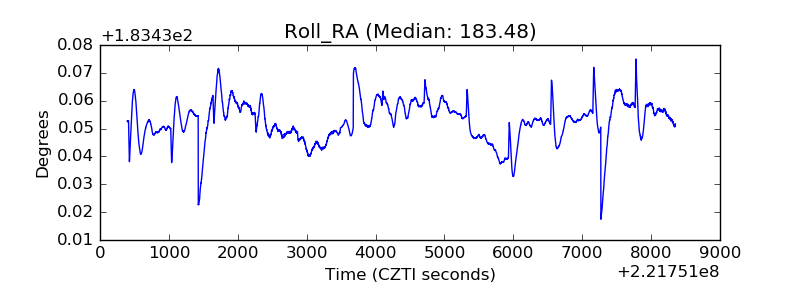 |
| Veto Counter | 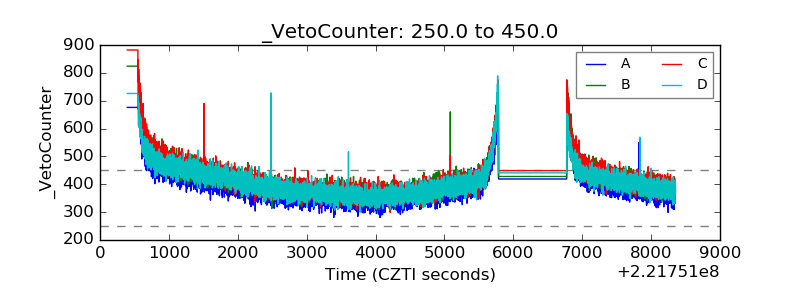 |