| Param | Original file | Final file |
|---|---|---|
| Filename | modeM0/AS1A02_090T02_9000000956_06965cztM0_level2.evt | modeM0/AS1A02_090T02_9000000956_06965cztM0_level2_quad_clean.evt |
| Size (bytes) | 496,673,280 | 75,029,760 |
| Size | 473.7 MB | 71.6 MB |
| Events in quadrant A | 3,328,580 | 446,508 |
| Events in quadrant B | 3,665,949 | 448,914 |
| Events in quadrant C | 3,289,427 | 448,563 |
| Events in quadrant D | 4,273,820 | 431,430 |
| Mode M0 | |||
|---|---|---|---|
| Quadrant | BADHDUFLAG | Total packets | Discarded packets |
| A | 0 | 14715 | 3 |
| B | 0 | 15640 | 2 |
| C | 0 | 14675 | 2 |
| D | 0 | 17292 | 2 |
| Mode SS | |||
|---|---|---|---|
| Quadrant | BADHDUFLAG | Total packets | Discarded packets |
| A | 0 | 144 | 0 |
| B | 0 | 144 | 0 |
| C | 0 | 144 | 0 |
| D | 0 | 144 | 0 |
| Mode M9 | |||
|---|---|---|---|
| Quadrant | BADHDUFLAG | Total packets | Discarded packets |
| A | 0 | 8 | 0 |
| B | 0 | 8 | 0 |
| C | 0 | 8 | 0 |
| D | 0 | 9 | 0 |
| Quadrant | Total seconds | Saturated seconds | Saturation percentage |
|---|---|---|---|
| A | 7123 | 78 | 1.095044% |
| B | 7123 | 130 | 1.825074% |
| C | 7123 | 66 | 0.926576% |
| D | 7123 | 89 | 1.249474% |
Noise dominated data is calculated using 1-second bins in cleaned event files. If a bin has >2000 counts, and if more than 50% of those come from <1% of pixels, then it is considered to be noise-dominated and hence unusable.
| Quadrant | # 1 sec bins | Bins with >0 counts | Bins with >2000 counts | High rate bins dominated by noise | Noise dominated (total time) | Noise dominated (detector-on time) | Marked lightcurve |
|---|---|---|---|---|---|---|---|
| A | 7703 | 7124 | 0 | 0 | 0.00% | 0.00% | 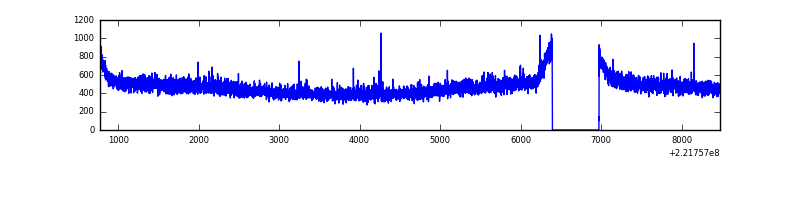 |
| B | 7703 | 7124 | 10 | 10 | 0.13% | 0.14% | 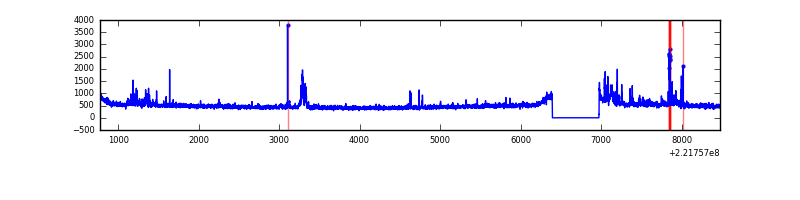 |
| C | 7703 | 7124 | 0 | 0 | 0.00% | 0.00% | 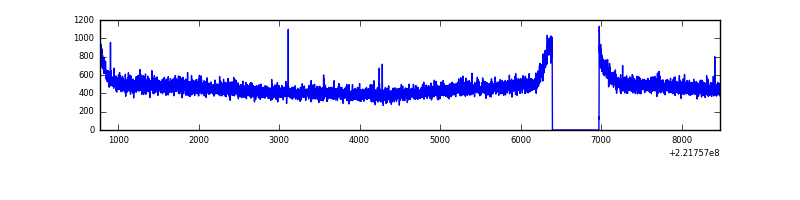 |
| D | 7703 | 7124 | 7 | 7 | 0.09% | 0.10% | 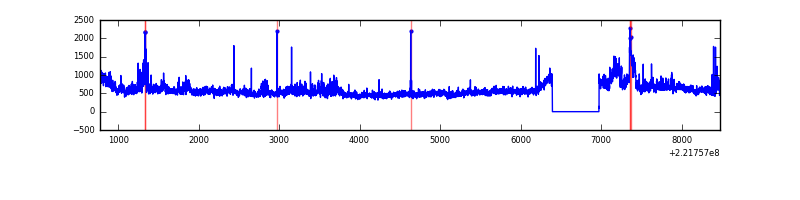 |
Top three noisy pixels from each quadrant. If the there are fewer than three noisy pixels in the level2.evt file, extra rows are filled as -1
| Pixel properties | Quadrant properties | ||||||
|---|---|---|---|---|---|---|---|
| Quadrant | DetID | PixID | Counts | Sigma | Mean | Median | Sigma |
| A | 13 | 14 | 9919 | 51.59 | 859 | 841 | 176.0 |
| A | 0 | 226 | 8281 | 42.28 | 859 | 841 | 176.0 |
| A | 12 | 194 | 7820 | 39.66 | 859 | 841 | 176.0 |
| B | 0 | 228 | 133302 | 795.84 | 863 | 841 | 166.4 |
| B | 0 | 189 | 61344 | 363.51 | 863 | 841 | 166.4 |
| B | 0 | 229 | 38273 | 224.9 | 863 | 841 | 166.4 |
| C | 1 | 16 | 6981 | 31.27 | 839 | 840 | 196.4 |
| C | 13 | 61 | 6621 | 29.43 | 839 | 840 | 196.4 |
| C | 12 | 4 | 3795 | 15.05 | 839 | 840 | 196.4 |
| D | 8 | 195 | 646524 | 3064.38 | 841 | 814 | 210.7 |
| D | 1 | 20 | 199431 | 942.59 | 841 | 814 | 210.7 |
| D | 2 | 136 | 184920 | 873.72 | 841 | 814 | 210.7 |
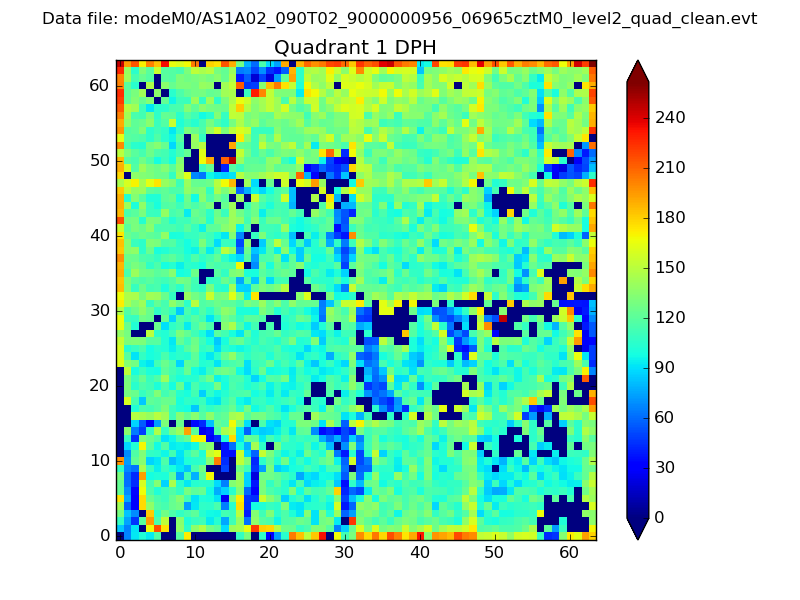
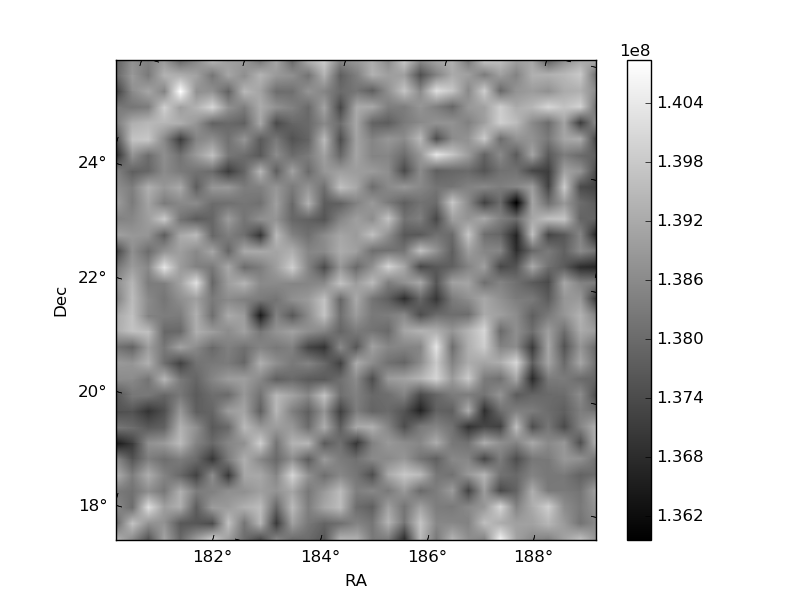
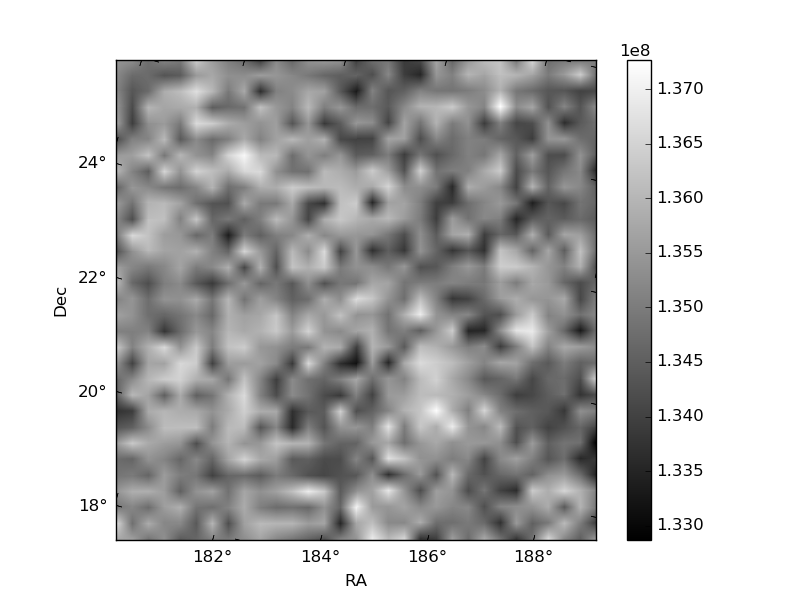
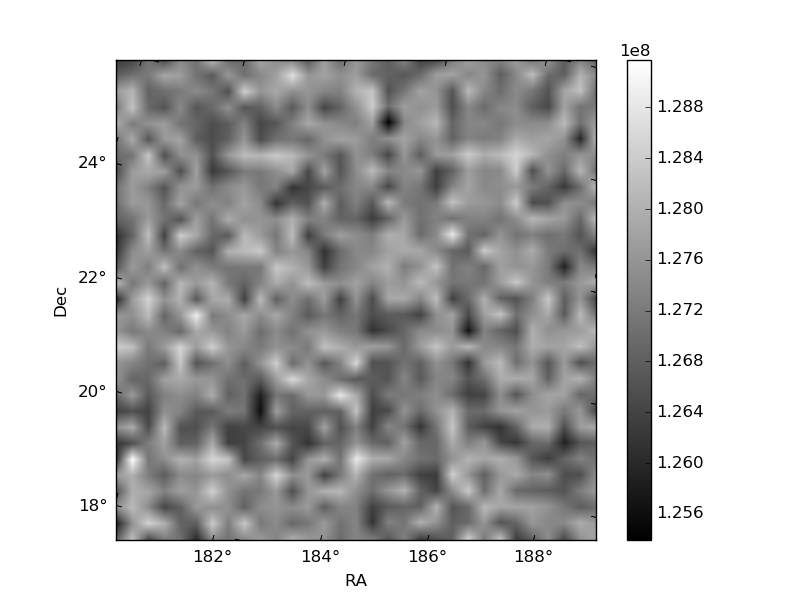
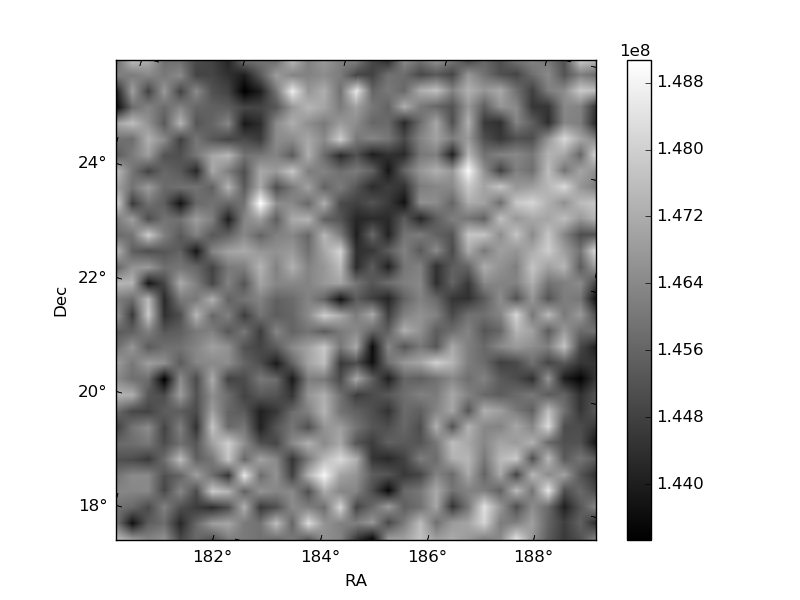
Histogram calculated using DETX and DETY for each event in the final _common_clean file
| Quadrant A |  |
 |
Quadrant B |
|---|---|---|---|
| Quadrant D | 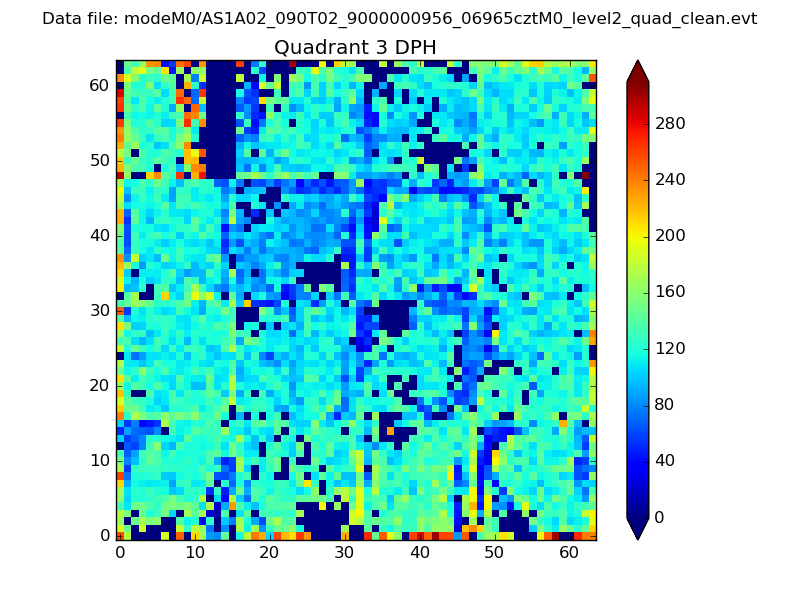 |
 |
Quadrant C |
| Plot type | Count rate plots | Images |
|---|---|---|
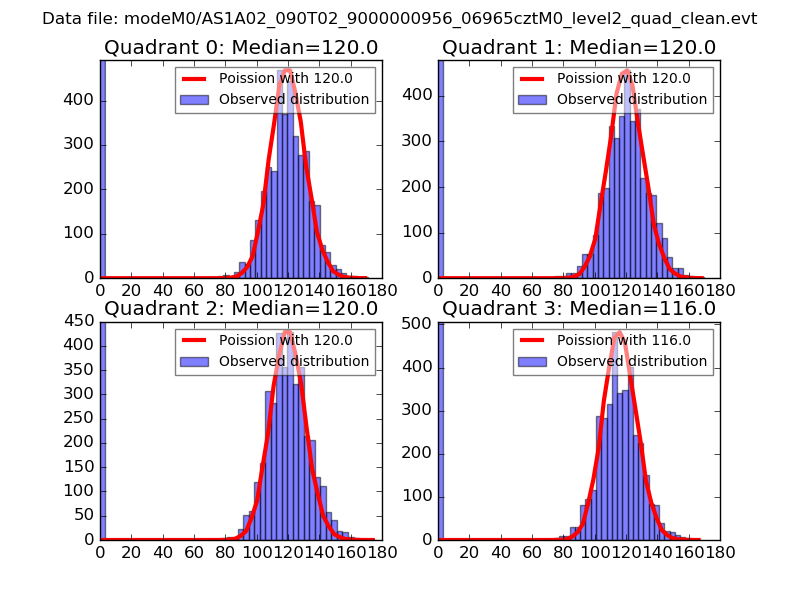
| Comparison with Poisson distribution Blue bars denote a histogram of data divided into 1 sec bins. Red curve is a Poisson curve with rate = median count rate of data. |
 |
 |
| Quadrant-wise count rates Data is divided into 100 sec bins |
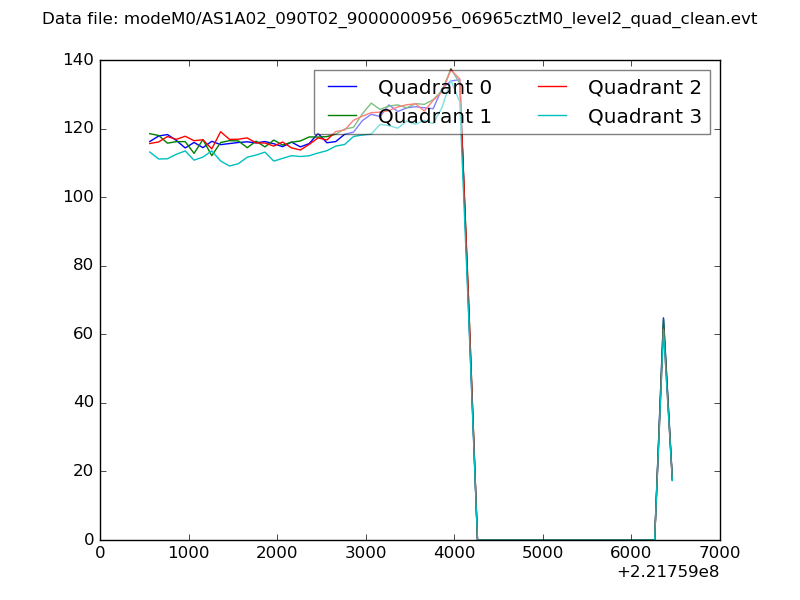 |
|
| Module-wise count rates for Quadrant A Data is divided into 100 sec bins |
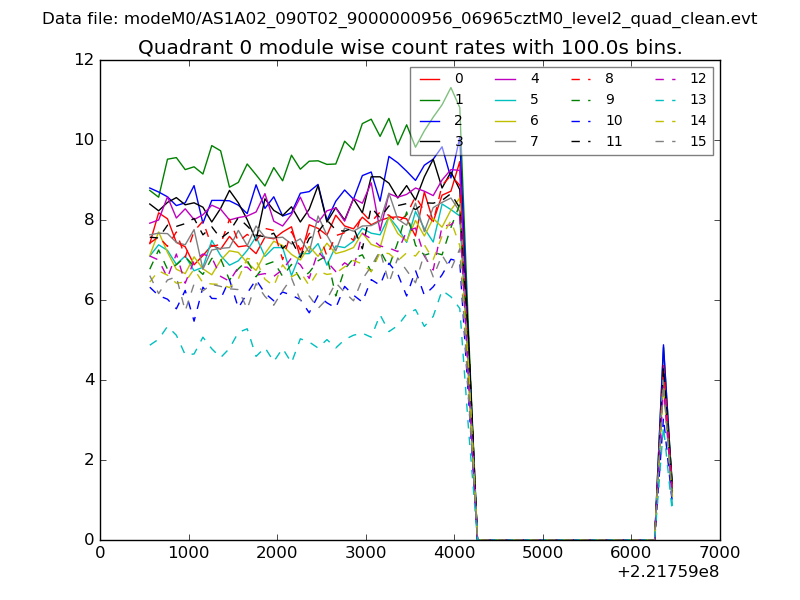 |
 |
| Module-wise count rates for Quadrant B Data is divided into 100 sec bins |
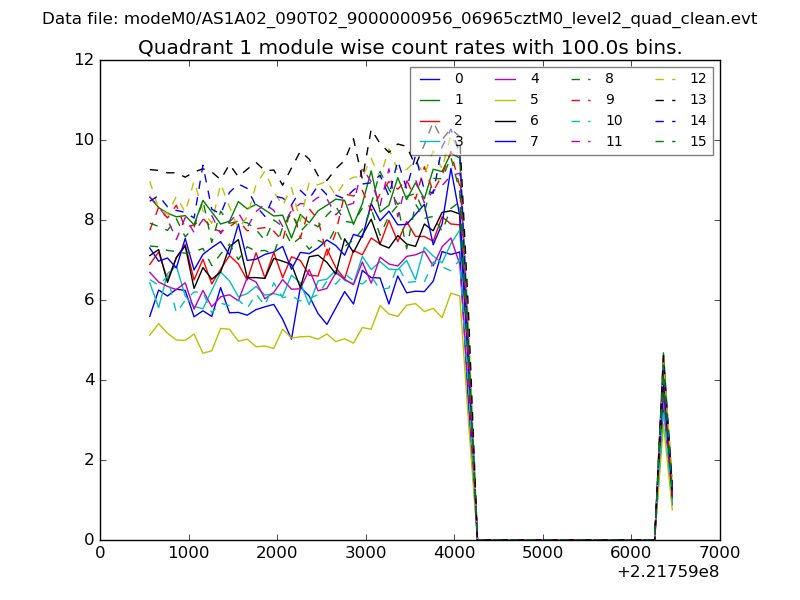 |
 |
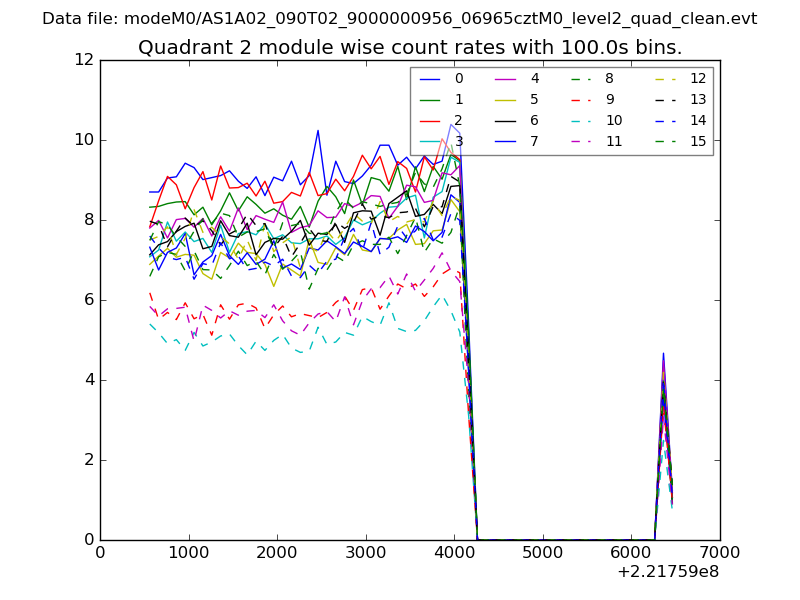
| Module-wise count rates for Quadrant C Data is divided into 100 sec bins |
 |
 |
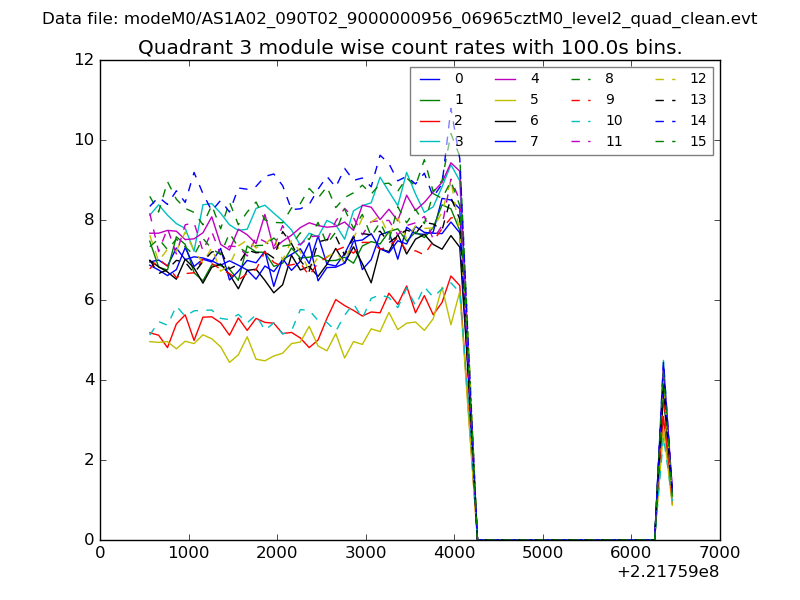
| Module-wise count rates for Quadrant D Data is divided into 100 sec bins |
 |
 |
| Parameter | Plot |
|---|---|
| CZT HV Monitor | 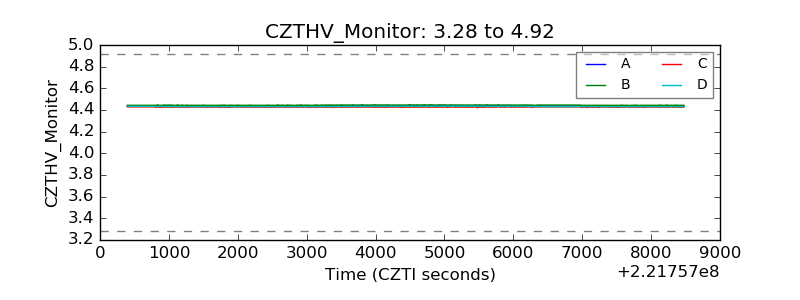 |
| D_VDD | 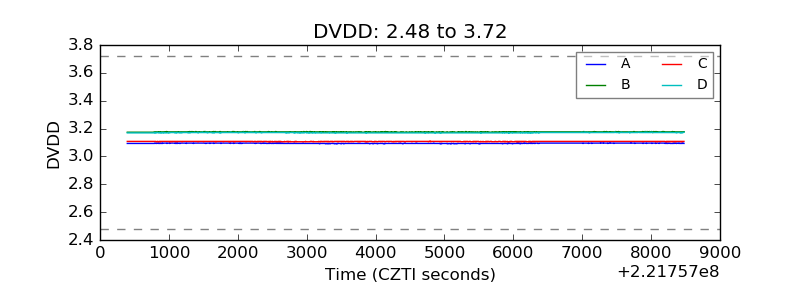 |
| Temperature 1 | 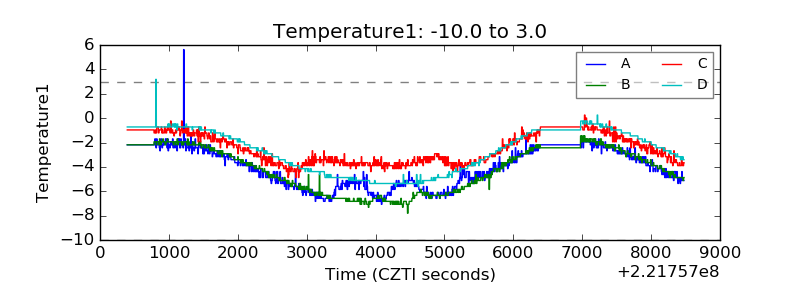 |
| Veto HV Monitor | 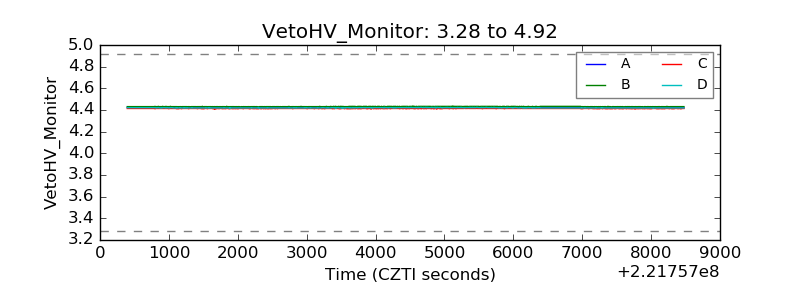 |
| Veto LLD | 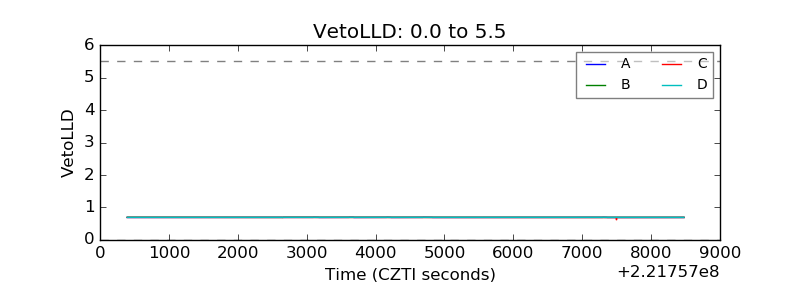 |
| Alpha Counter | 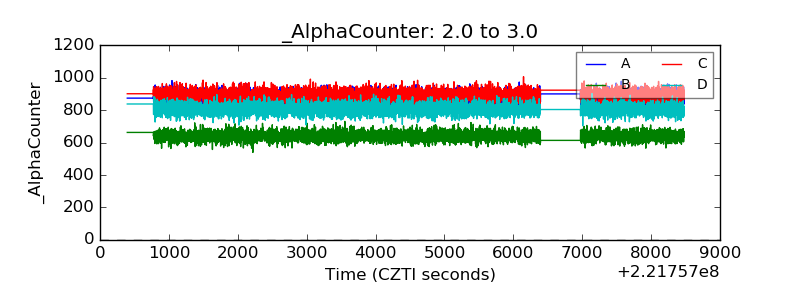 |
| _CPM_Rate | 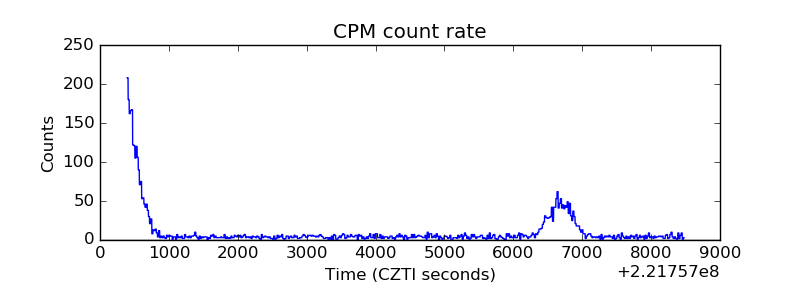 |
| CZT Counter | 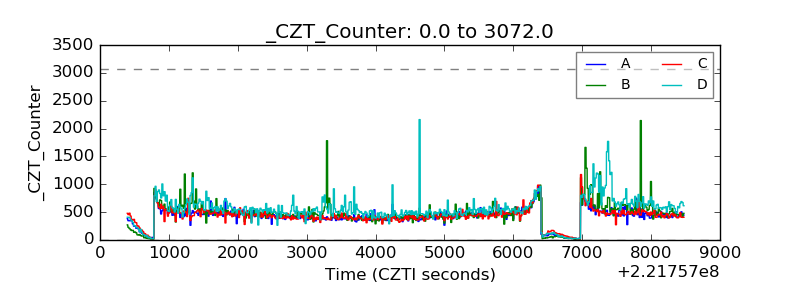 |
| +2.5 Volts monitor |  |
| +5 Volts monitor |  |
| _ROLL_ROT | 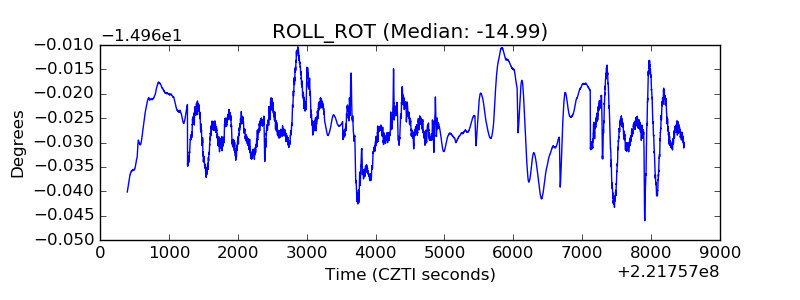 |
| _Roll_DEC | 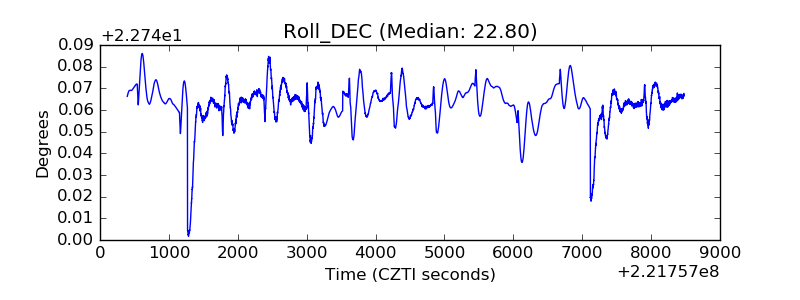 |
| _Roll_RA | 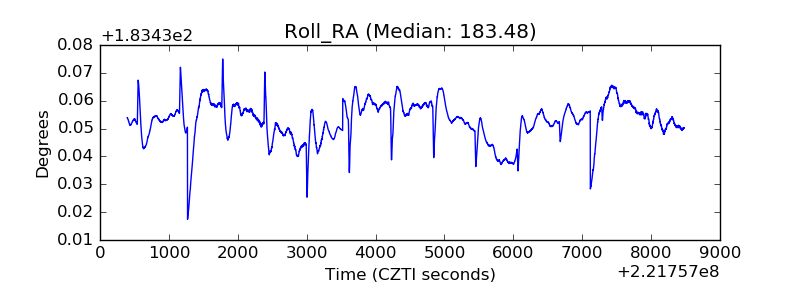 |
| Veto Counter | 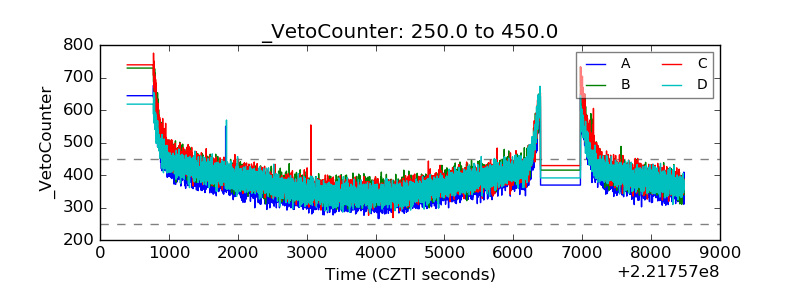 |