| Param | Original file | Final file |
|---|---|---|
| Filename | modeM0/AS1A02_090T02_9000000956_06967cztM0_level2.evt | modeM0/AS1A02_090T02_9000000956_06967cztM0_level2_quad_clean.evt |
| Size (bytes) | 528,454,080 | 86,132,160 |
| Size | 504.0 MB | 82.1 MB |
| Events in quadrant A | 3,653,045 | 520,345 |
| Events in quadrant B | 3,908,348 | 525,930 |
| Events in quadrant C | 3,504,903 | 524,685 |
| Events in quadrant D | 4,418,234 | 504,752 |
| Mode M0 | |||
|---|---|---|---|
| Quadrant | BADHDUFLAG | Total packets | Discarded packets |
| A | 0 | 16028 | 3 |
| B | 0 | 16930 | 2 |
| C | 0 | 15870 | 2 |
| D | 0 | 17986 | 2 |
| Mode SS | |||
|---|---|---|---|
| Quadrant | BADHDUFLAG | Total packets | Discarded packets |
| A | 0 | 158 | 0 |
| B | 0 | 158 | 0 |
| C | 0 | 158 | 0 |
| D | 0 | 158 | 0 |
| Mode M9 | |||
|---|---|---|---|
| Quadrant | BADHDUFLAG | Total packets | Discarded packets |
| A | 0 | 6 | 0 |
| B | 0 | 6 | 0 |
| C | 0 | 6 | 0 |
| D | 0 | 6 | 0 |
| Quadrant | Total seconds | Saturated seconds | Saturation percentage |
|---|---|---|---|
| A | 7658 | 94 | 1.227475% |
| B | 7658 | 192 | 2.507182% |
| C | 7658 | 69 | 0.901019% |
| D | 7658 | 170 | 2.219901% |
Noise dominated data is calculated using 1-second bins in cleaned event files. If a bin has >2000 counts, and if more than 50% of those come from <1% of pixels, then it is considered to be noise-dominated and hence unusable.
| Quadrant | # 1 sec bins | Bins with >0 counts | Bins with >2000 counts | High rate bins dominated by noise | Noise dominated (total time) | Noise dominated (detector-on time) | Marked lightcurve |
|---|---|---|---|---|---|---|---|
| A | 8168 | 7661 | 0 | 0 | 0.00% | 0.00% | 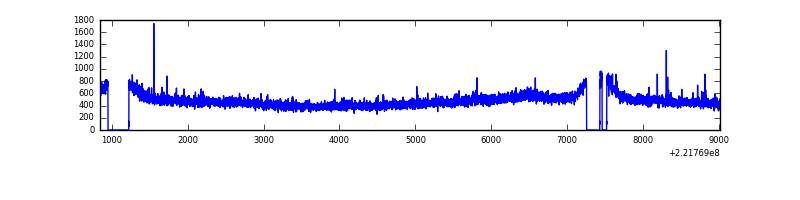 |
| B | 8168 | 7661 | 22 | 22 | 0.27% | 0.29% | 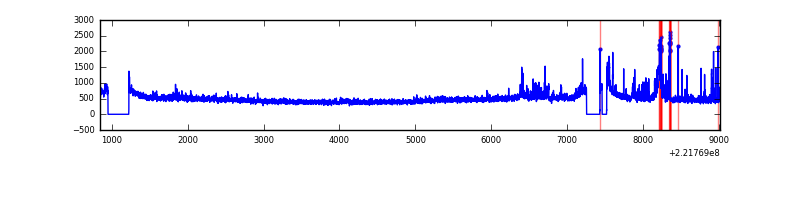 |
| C | 8168 | 7661 | 0 | 0 | 0.00% | 0.00% | 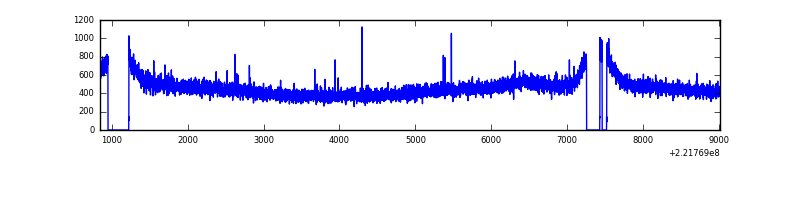 |
| D | 8168 | 7661 | 24 | 24 | 0.29% | 0.31% | 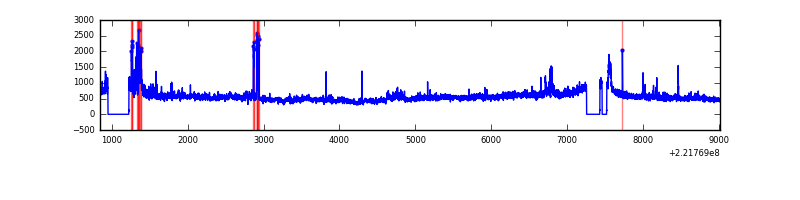 |
Top three noisy pixels from each quadrant. If the there are fewer than three noisy pixels in the level2.evt file, extra rows are filled as -1
| Pixel properties | Quadrant properties | ||||||
|---|---|---|---|---|---|---|---|
| Quadrant | DetID | PixID | Counts | Sigma | Mean | Median | Sigma |
| A | 13 | 14 | 99751 | 519.95 | 915 | 892 | 190.1 |
| A | 6 | 254 | 17665 | 88.22 | 915 | 892 | 190.1 |
| A | 13 | 248 | 9738 | 46.53 | 915 | 892 | 190.1 |
| B | 0 | 228 | 188292 | 1055.61 | 918 | 895 | 177.5 |
| B | 0 | 189 | 67241 | 373.73 | 918 | 895 | 177.5 |
| B | 0 | 197 | 29750 | 162.54 | 918 | 895 | 177.5 |
| C | 1 | 16 | 12445 | 54.96 | 892 | 894 | 210.2 |
| C | 13 | 61 | 6973 | 28.92 | 892 | 894 | 210.2 |
| C | 12 | 4 | 4945 | 19.28 | 892 | 894 | 210.2 |
| D | 8 | 195 | 644860 | 2943.5 | 889 | 861 | 218.8 |
| D | 14 | 34 | 97840 | 443.26 | 889 | 861 | 218.8 |
| D | 2 | 136 | 89829 | 406.64 | 889 | 861 | 218.8 |
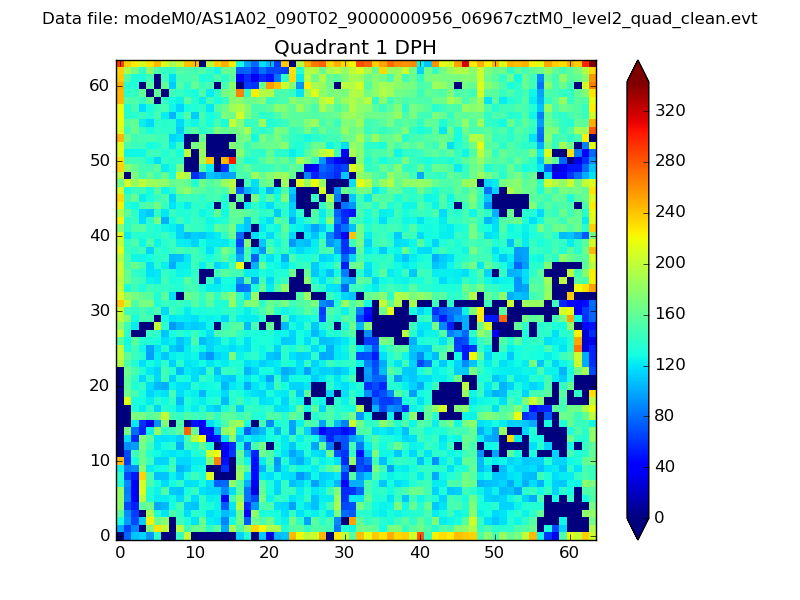
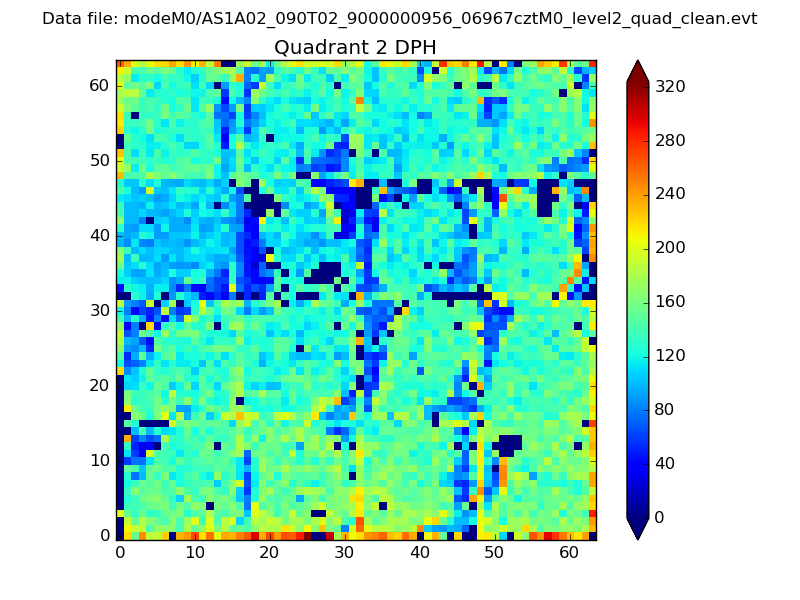
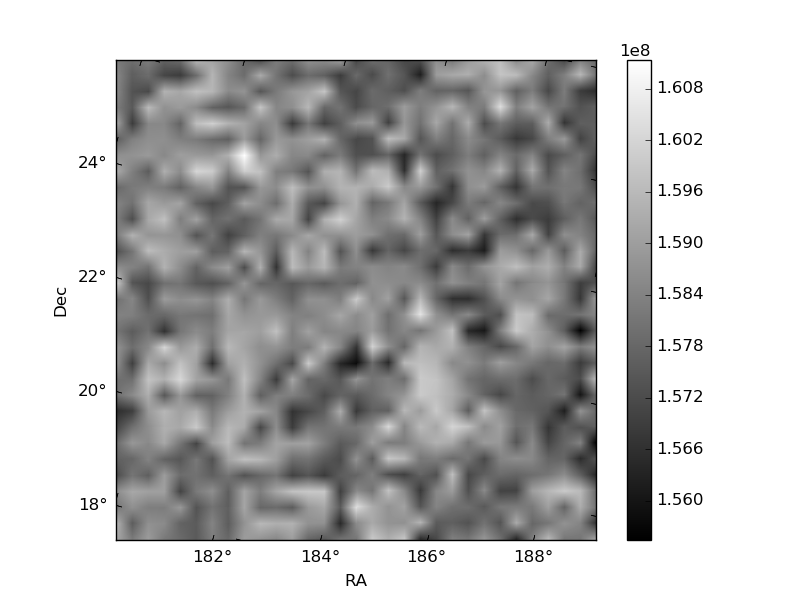
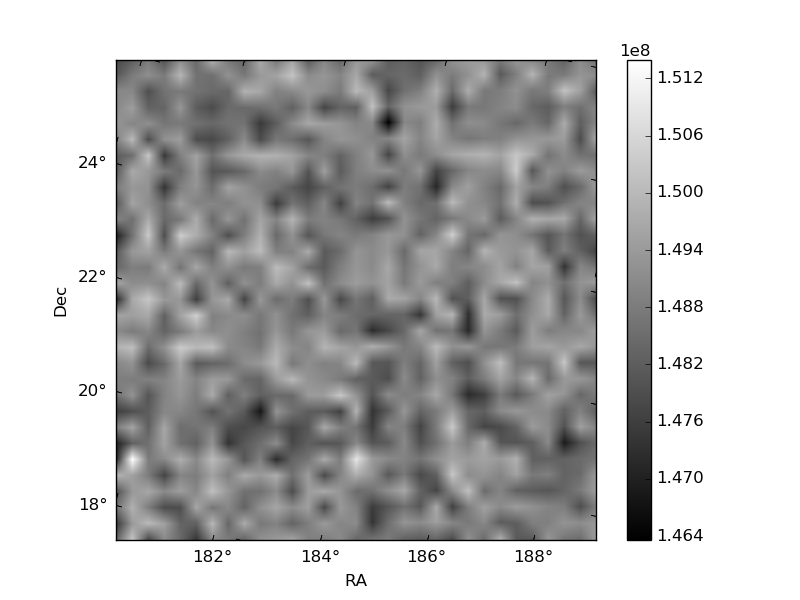
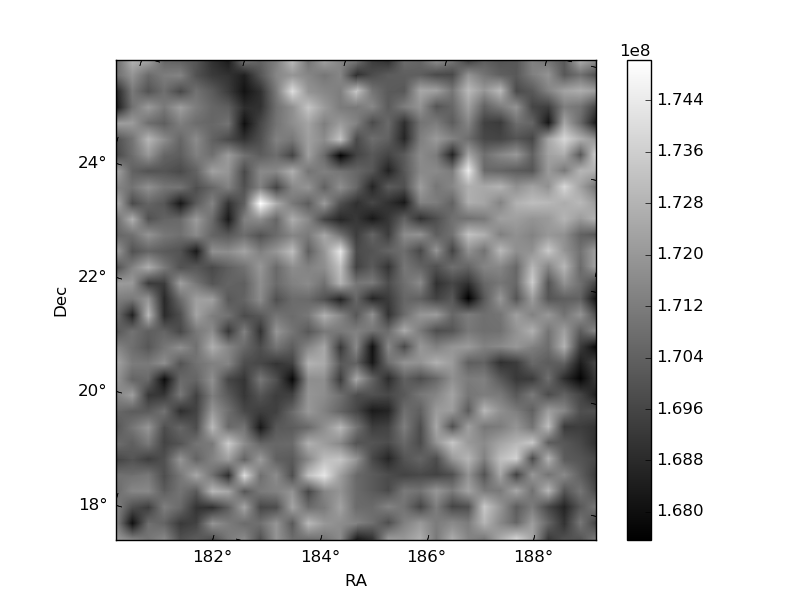
Histogram calculated using DETX and DETY for each event in the final _common_clean file
| Quadrant A |  |
 |
Quadrant B |
|---|---|---|---|
| Quadrant D |  |
 |
Quadrant C |
| Plot type | Count rate plots | Images |
|---|---|---|
| Comparison with Poisson distribution Blue bars denote a histogram of data divided into 1 sec bins. Red curve is a Poisson curve with rate = median count rate of data. |
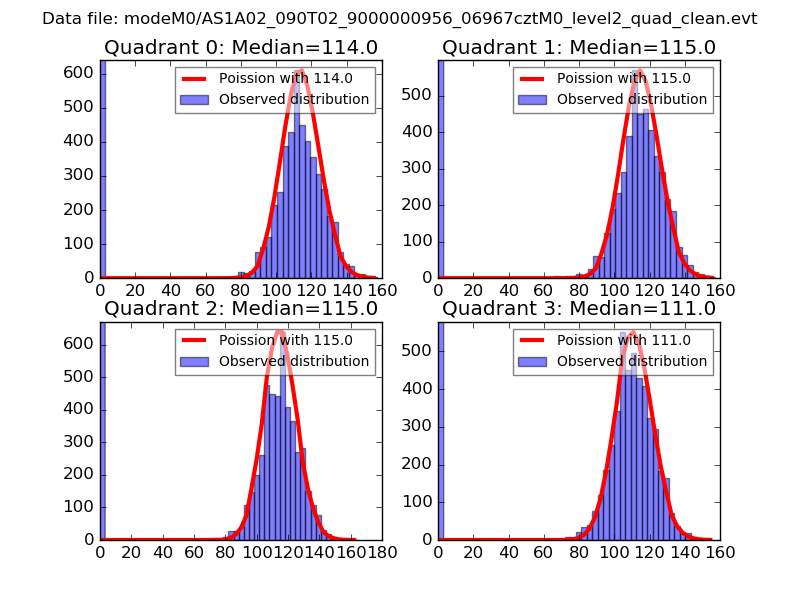 |
 |
| Quadrant-wise count rates Data is divided into 100 sec bins |
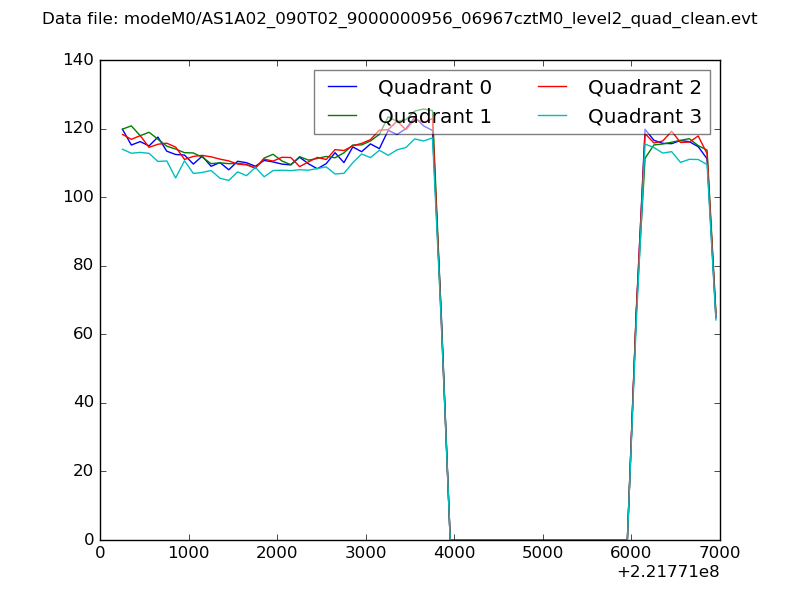 |
|
| Module-wise count rates for Quadrant A Data is divided into 100 sec bins |
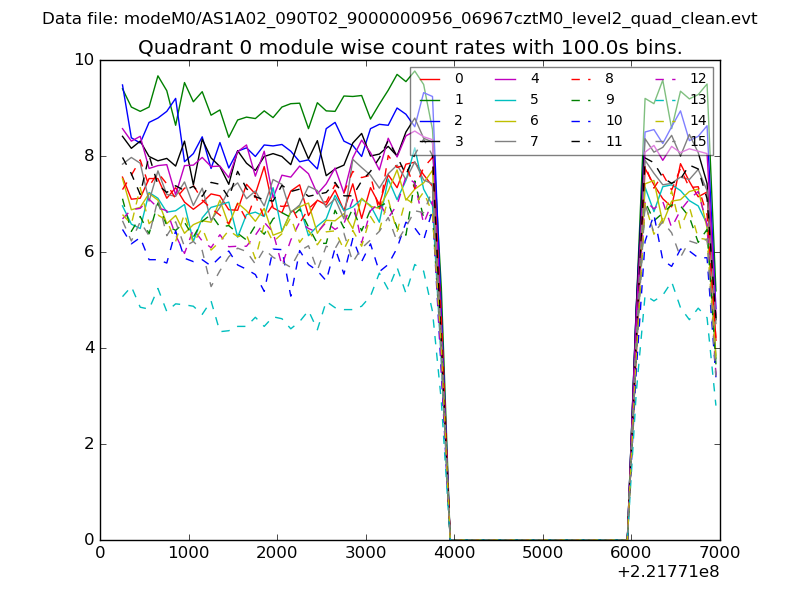 |
 |
| Module-wise count rates for Quadrant B Data is divided into 100 sec bins |
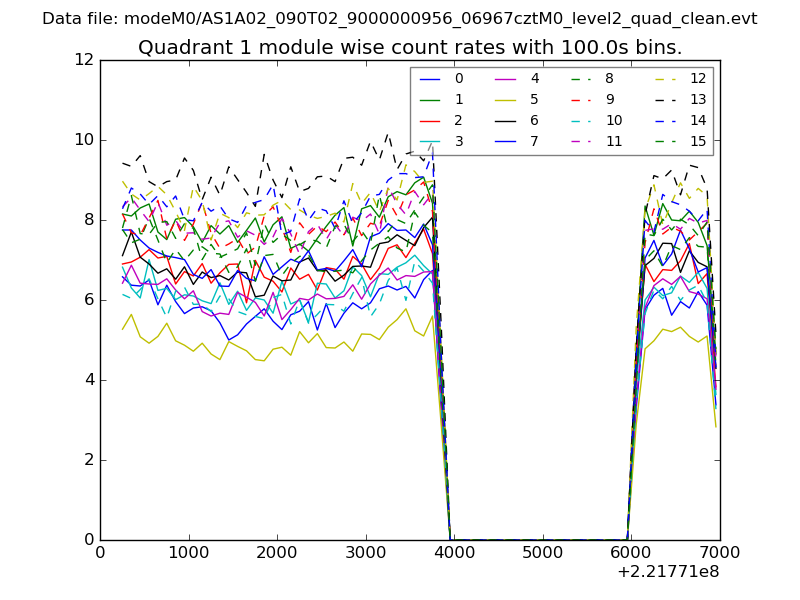 |
 |
| Module-wise count rates for Quadrant C Data is divided into 100 sec bins |
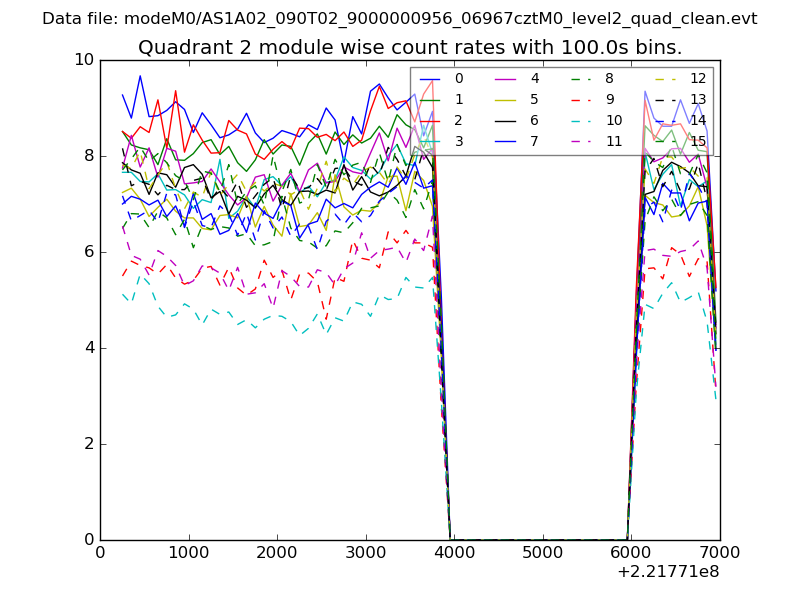 |
 |
| Module-wise count rates for Quadrant D Data is divided into 100 sec bins |
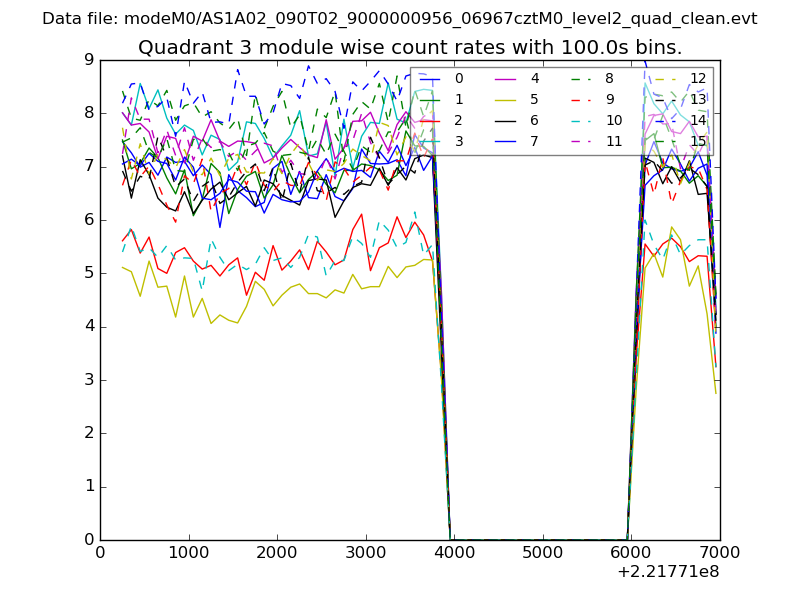 |
 |
| Parameter | Plot |
|---|---|
| CZT HV Monitor | 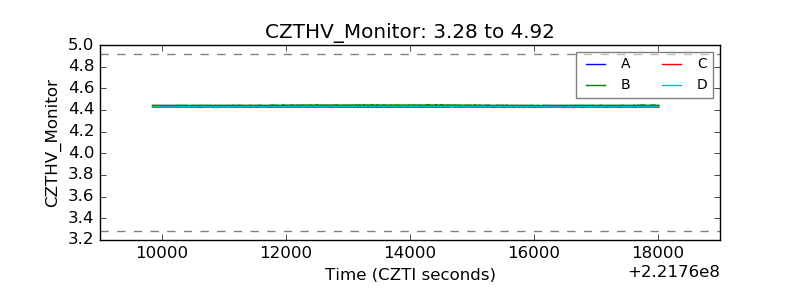 |
| D_VDD | 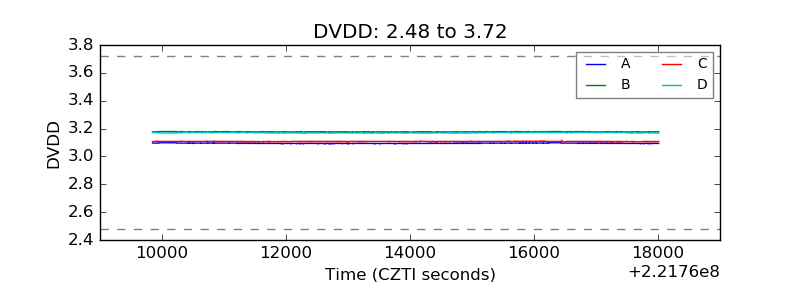 |
| Temperature 1 | 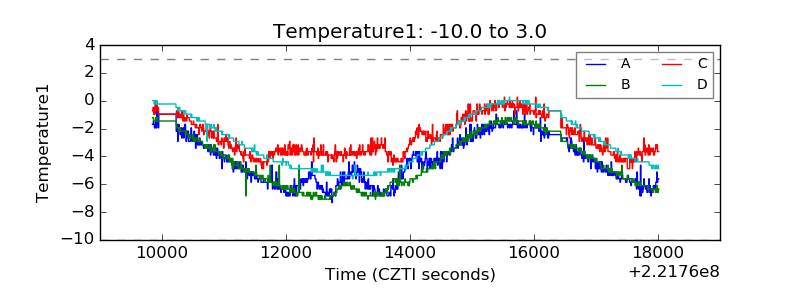 |
| Veto HV Monitor |  |
| Veto LLD | 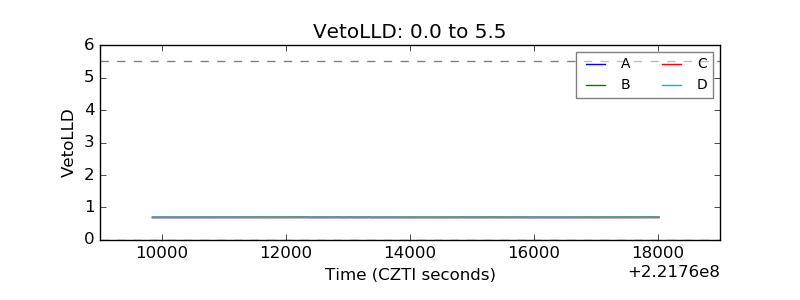 |
| Alpha Counter | 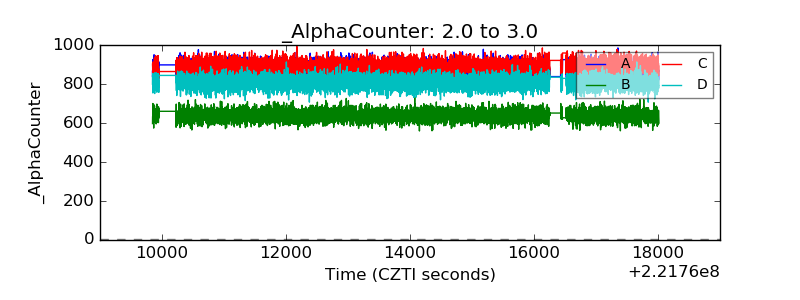 |
| _CPM_Rate | 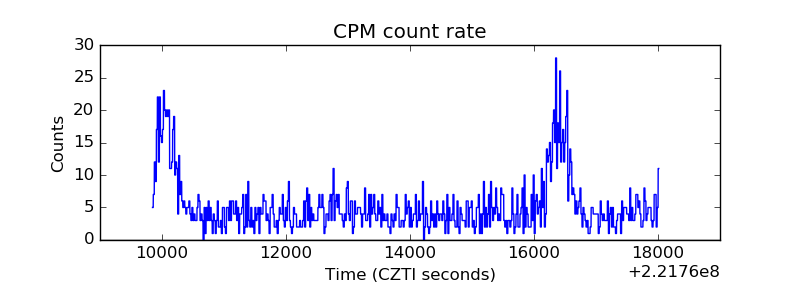 |
| CZT Counter |  |
| +2.5 Volts monitor |  |
| +5 Volts monitor |  |
| _ROLL_ROT | 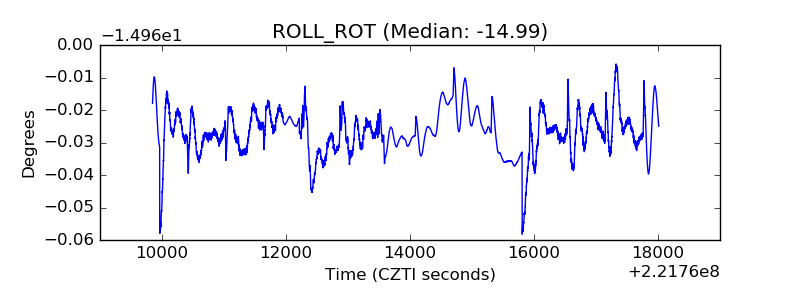 |
| _Roll_DEC | 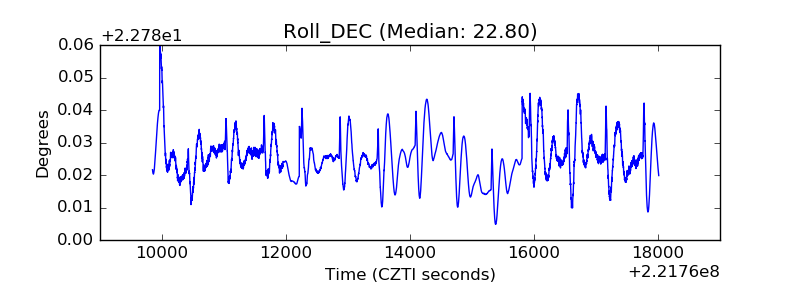 |
| _Roll_RA | 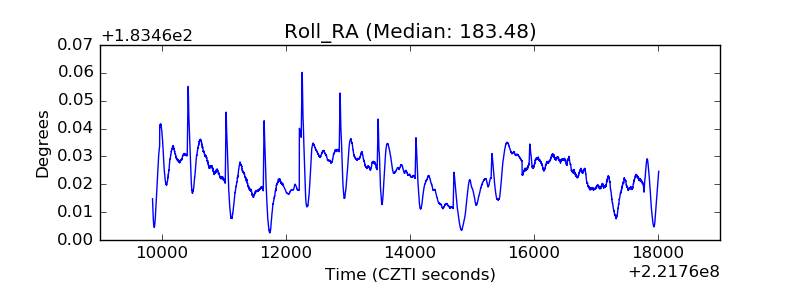 |
| Veto Counter | 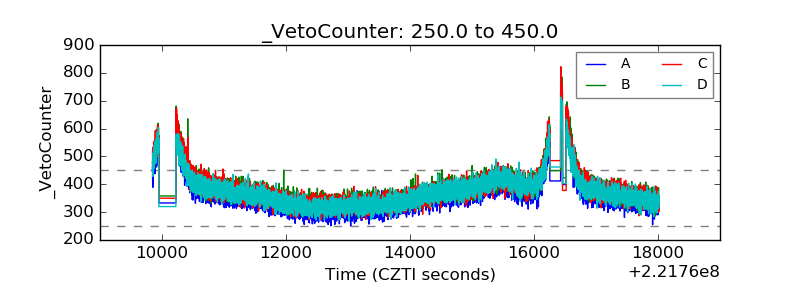 |