| Param | Original file | Final file |
|---|---|---|
| Filename | modeM0/AS1A02_090T02_9000000956_06970cztM0_level2.evt | modeM0/AS1A02_090T02_9000000956_06970cztM0_level2_quad_clean.evt |
| Size (bytes) | 276,822,720 | 57,916,800 |
| Size | 264.0 MB | 55.2 MB |
| Events in quadrant A | 1,934,400 | 364,438 |
| Events in quadrant B | 2,118,265 | 367,537 |
| Events in quadrant C | 1,842,466 | 367,165 |
| Events in quadrant D | 2,198,004 | 355,081 |
| Mode M0 | |||
|---|---|---|---|
| Quadrant | BADHDUFLAG | Total packets | Discarded packets |
| A | 0 | 8849 | 2 |
| B | 0 | 9500 | 1 |
| C | 0 | 8788 | 1 |
| D | 0 | 9491 | 1 |
| Mode SS | |||
|---|---|---|---|
| Quadrant | BADHDUFLAG | Total packets | Discarded packets |
| A | 0 | 88 | 0 |
| B | 0 | 88 | 0 |
| C | 0 | 88 | 0 |
| D | 0 | 88 | 0 |
| Mode M9 | |||
|---|---|---|---|
| Quadrant | BADHDUFLAG | Total packets | Discarded packets |
| A | 0 | 3 | 0 |
| B | 0 | 3 | 0 |
| C | 0 | 3 | 0 |
| D | 0 | 3 | 0 |
| Quadrant | Total seconds | Saturated seconds | Saturation percentage |
|---|---|---|---|
| A | 4254 | 52 | 1.222379% |
| B | 4254 | 133 | 3.126469% |
| C | 4254 | 30 | 0.705219% |
| D | 4254 | 79 | 1.857076% |
Noise dominated data is calculated using 1-second bins in cleaned event files. If a bin has >2000 counts, and if more than 50% of those come from <1% of pixels, then it is considered to be noise-dominated and hence unusable.
| Quadrant | # 1 sec bins | Bins with >0 counts | Bins with >2000 counts | High rate bins dominated by noise | Noise dominated (total time) | Noise dominated (detector-on time) | Marked lightcurve |
|---|---|---|---|---|---|---|---|
| A | 4489 | 4256 | 0 | 0 | 0.00% | 0.00% | 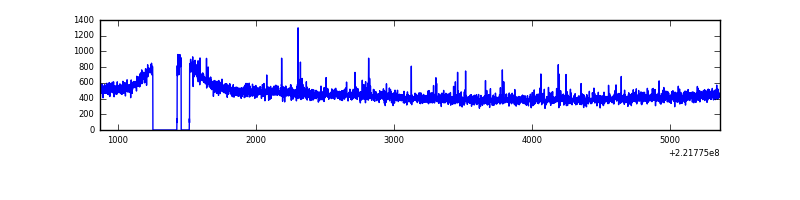 |
| B | 4489 | 4256 | 22 | 22 | 0.49% | 0.52% | 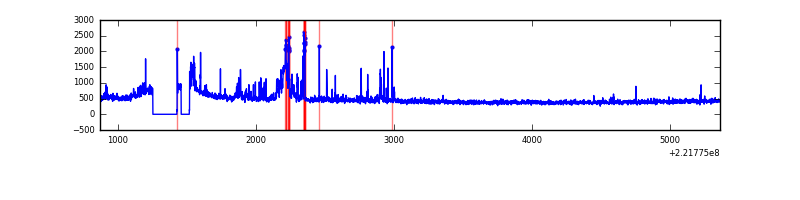 |
| C | 4489 | 4256 | 0 | 0 | 0.00% | 0.00% | 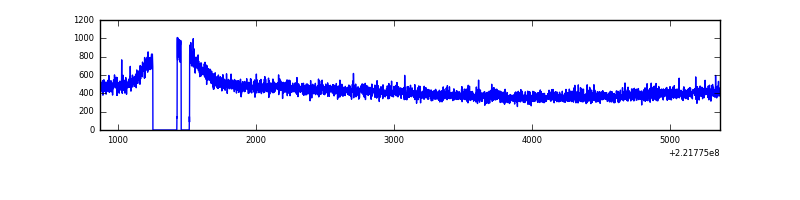 |
| D | 4489 | 4256 | 5 | 5 | 0.11% | 0.12% | 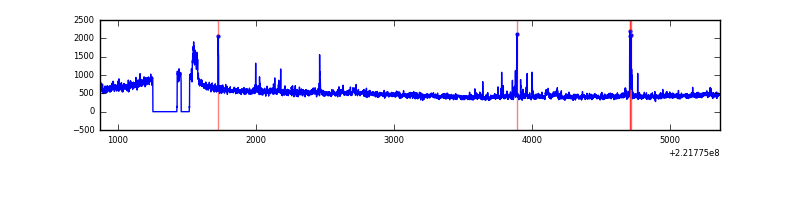 |
Top three noisy pixels from each quadrant. If the there are fewer than three noisy pixels in the level2.evt file, extra rows are filled as -1
| Pixel properties | Quadrant properties | ||||||
|---|---|---|---|---|---|---|---|
| Quadrant | DetID | PixID | Counts | Sigma | Mean | Median | Sigma |
| A | 13 | 14 | 66349 | 657.4 | 481 | 469 | 100.2 |
| A | 0 | 128 | 8794 | 83.07 | 481 | 469 | 100.2 |
| A | 0 | 226 | 4618 | 41.4 | 481 | 469 | 100.2 |
| B | 0 | 228 | 183063 | 1925.5 | 483 | 470 | 94.8 |
| B | 0 | 197 | 20187 | 207.92 | 483 | 470 | 94.8 |
| B | 4 | 81 | 14790 | 151.01 | 483 | 470 | 94.8 |
| C | 1 | 16 | 5467 | 44.9 | 470 | 472 | 111.2 |
| C | 13 | 61 | 3791 | 29.84 | 470 | 472 | 111.2 |
| C | 9 | 68 | 2057 | 14.25 | 470 | 472 | 111.2 |
| D | 8 | 195 | 308887 | 2657.04 | 467 | 453 | 116.1 |
| D | 2 | 14 | 80007 | 685.33 | 467 | 453 | 116.1 |
| D | 2 | 136 | 32015 | 271.89 | 467 | 453 | 116.1 |
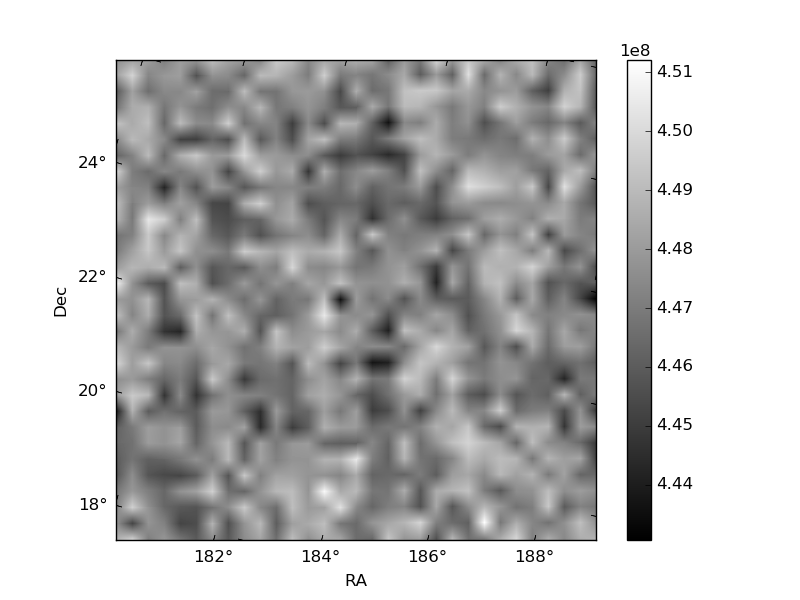
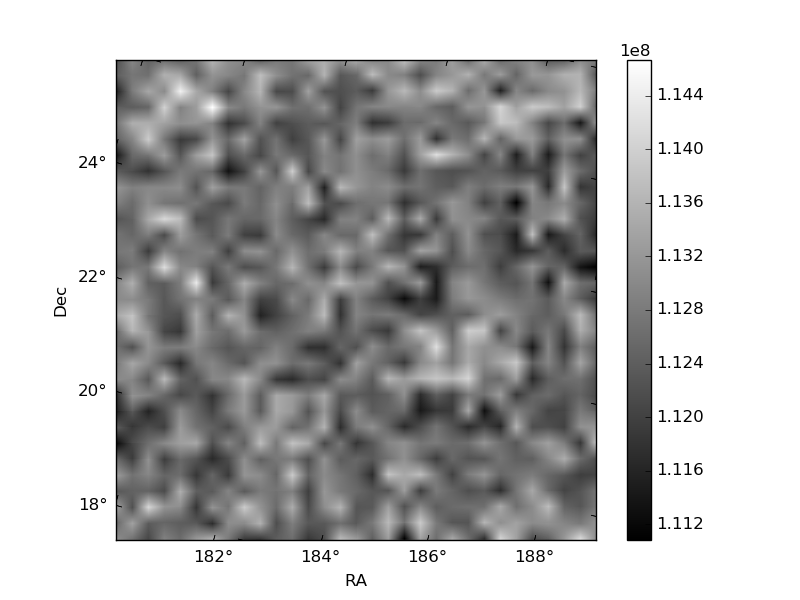
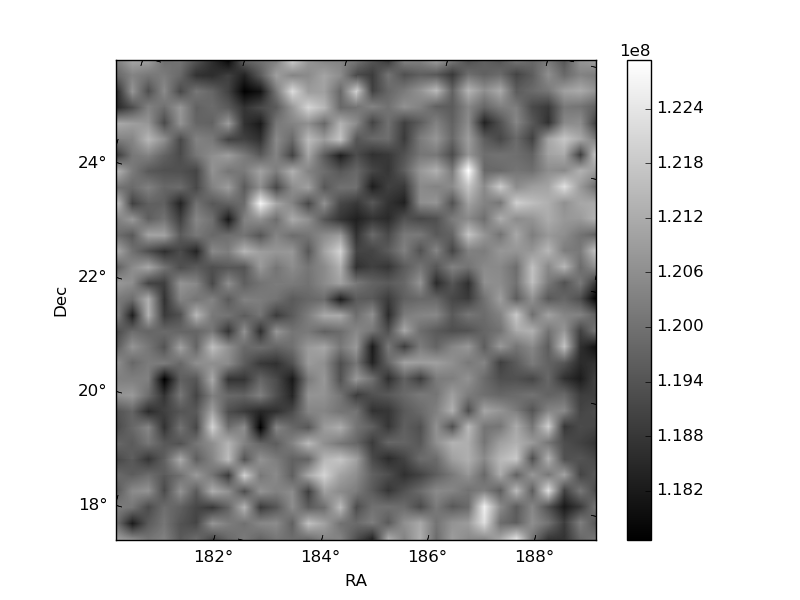
Histogram calculated using DETX and DETY for each event in the final _common_clean file
| Quadrant A |  |
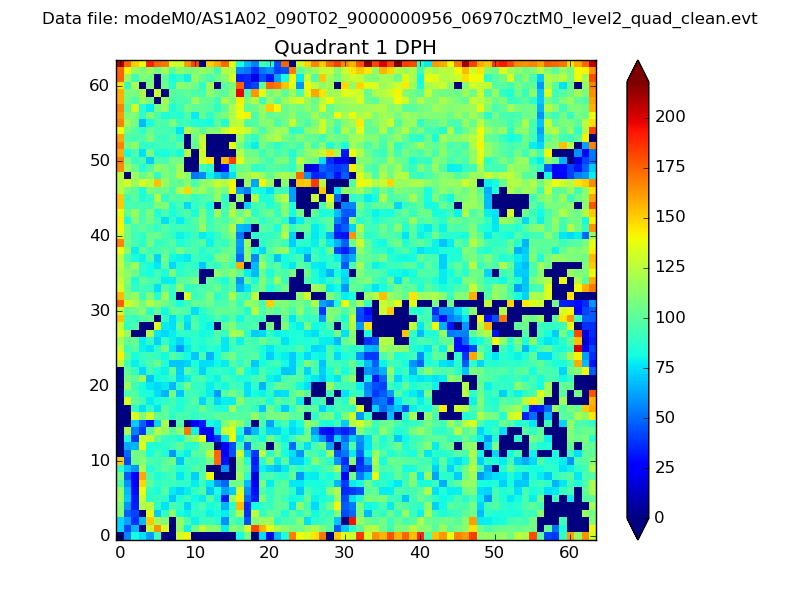 |
Quadrant B |
|---|---|---|---|
| Quadrant D | 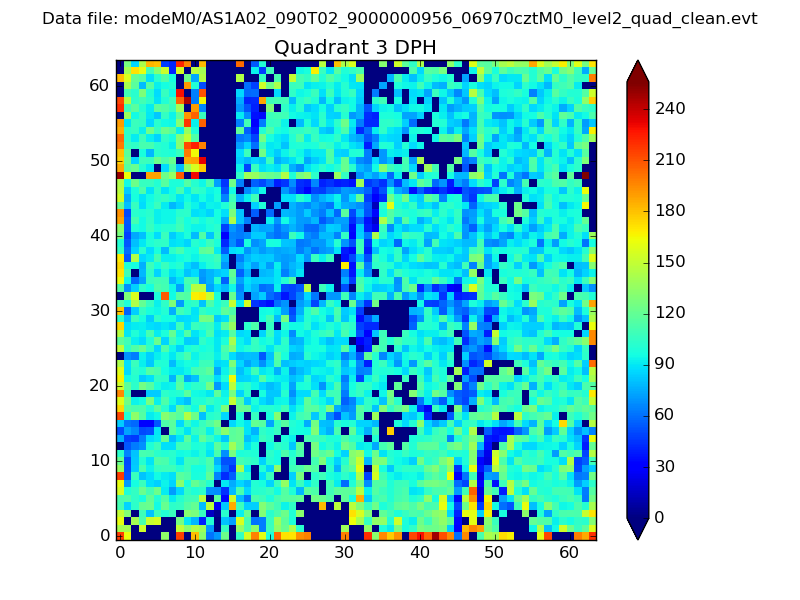 |
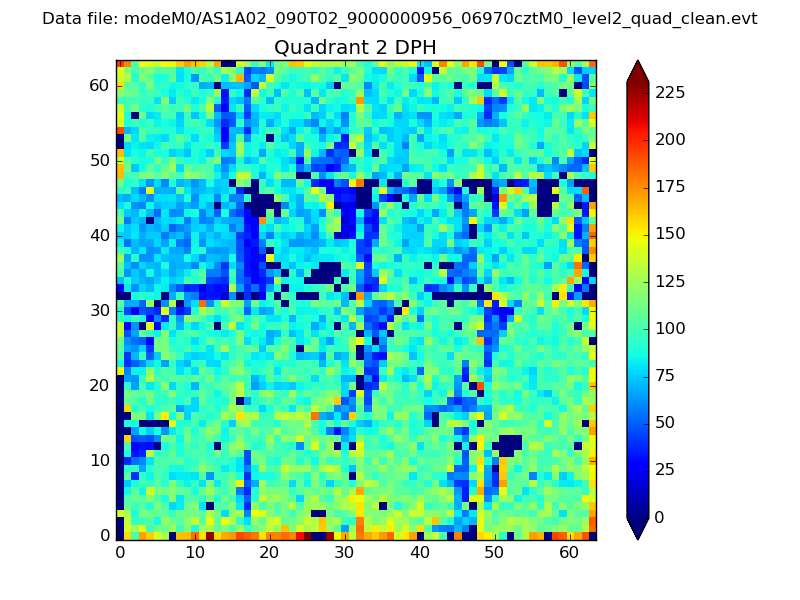 |
Quadrant C |
| Plot type | Count rate plots | Images |
|---|---|---|
| Comparison with Poisson distribution Blue bars denote a histogram of data divided into 1 sec bins. Red curve is a Poisson curve with rate = median count rate of data. |
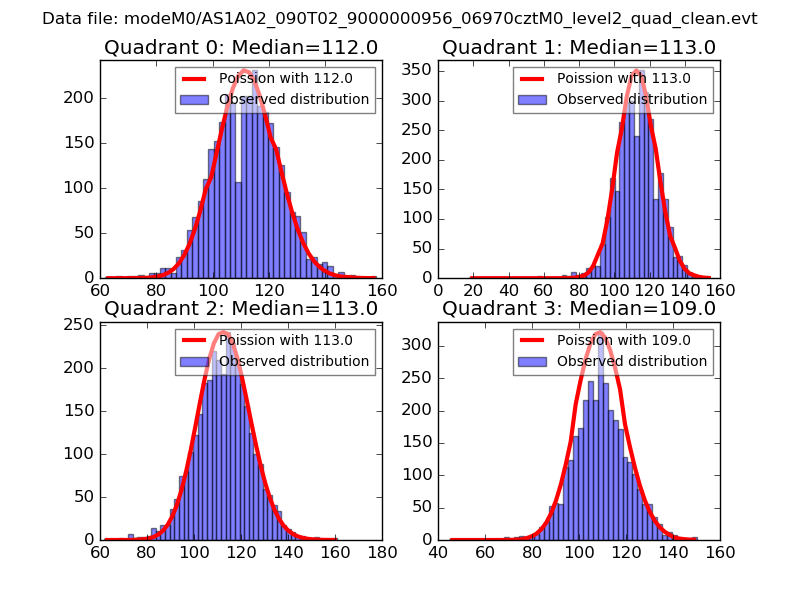 |
 |
| Quadrant-wise count rates Data is divided into 100 sec bins |
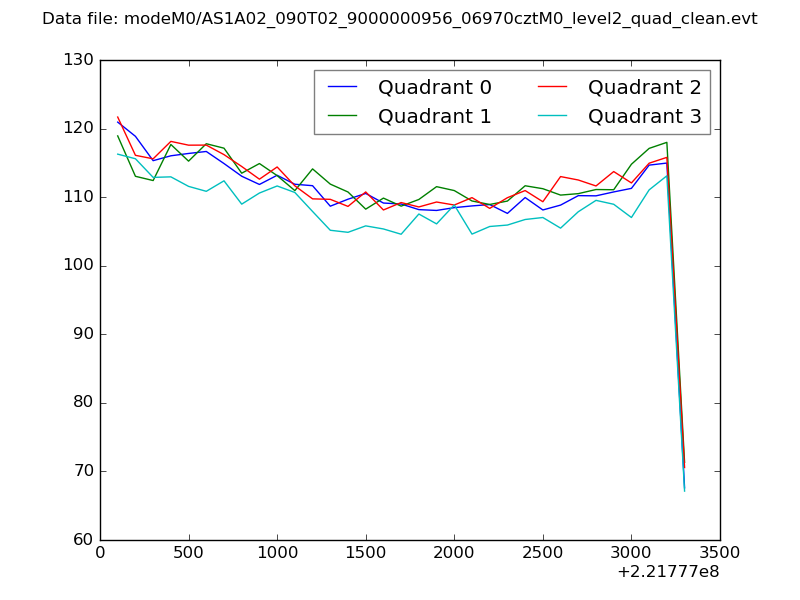 |
|
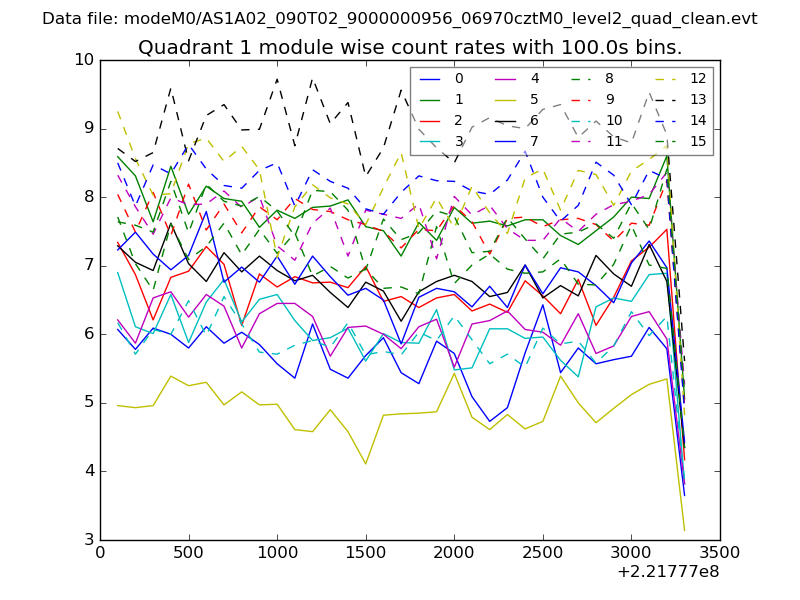
| Module-wise count rates for Quadrant A Data is divided into 100 sec bins |
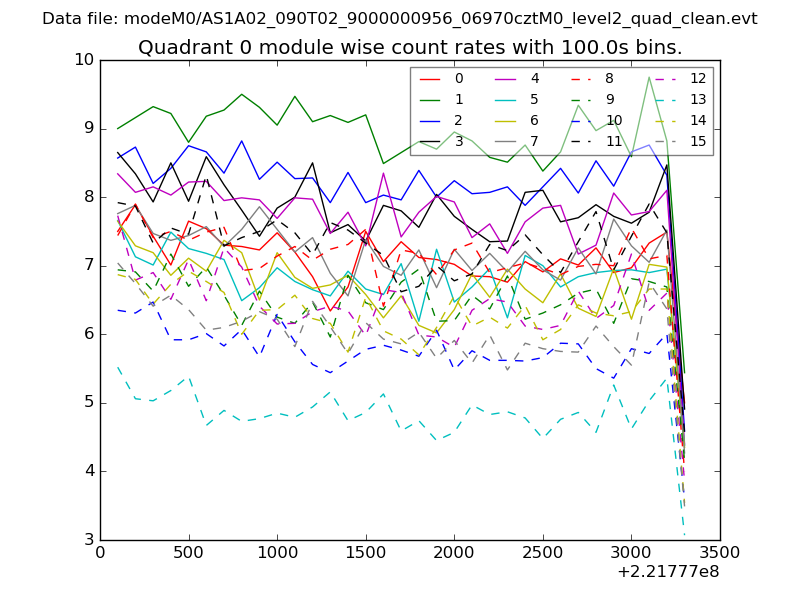 |
 |
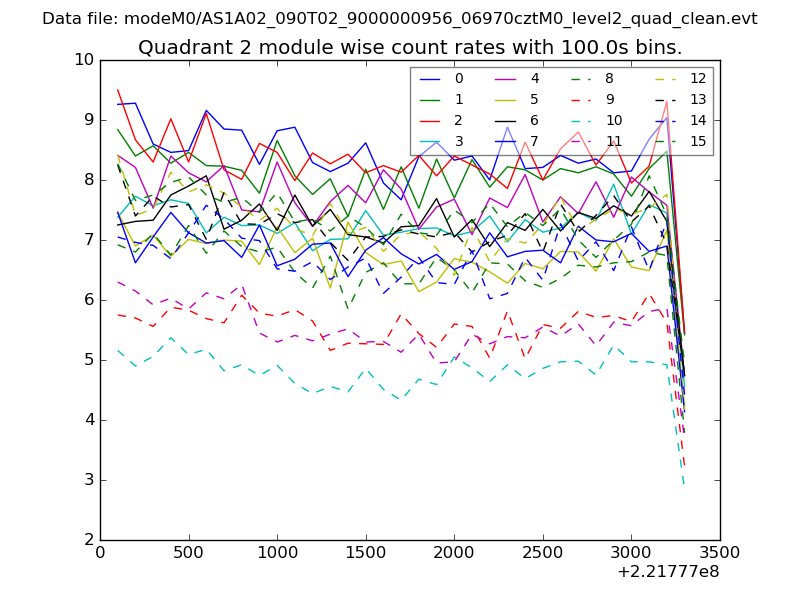
| Module-wise count rates for Quadrant B Data is divided into 100 sec bins |
 |
 |
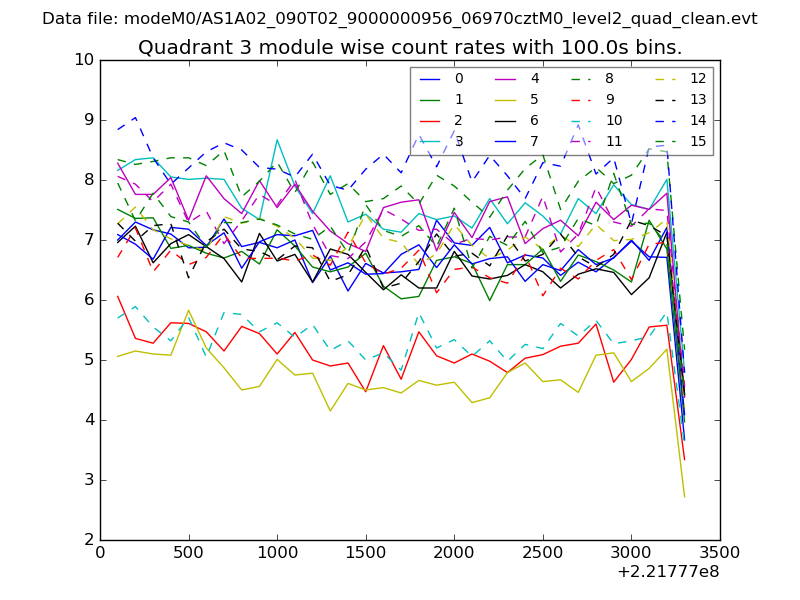
| Module-wise count rates for Quadrant C Data is divided into 100 sec bins |
 |
 |
| Module-wise count rates for Quadrant D Data is divided into 100 sec bins |
 |
 |
| Parameter | Plot |
|---|---|
| CZT HV Monitor | 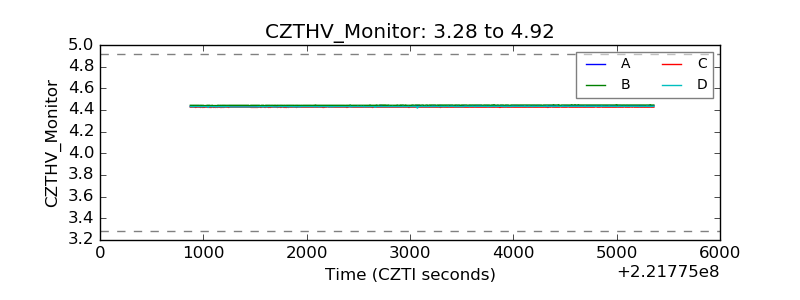 |
| D_VDD | 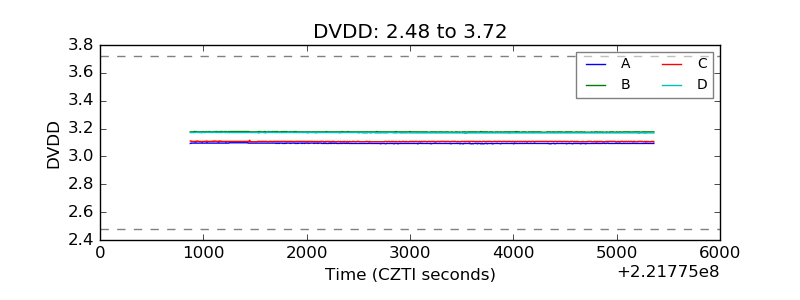 |
| Temperature 1 | 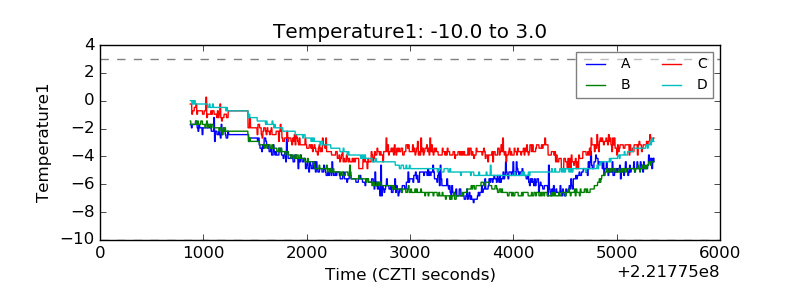 |
| Veto HV Monitor | 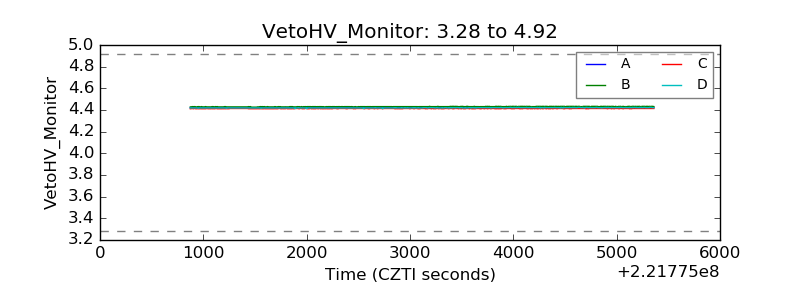 |
| Veto LLD | 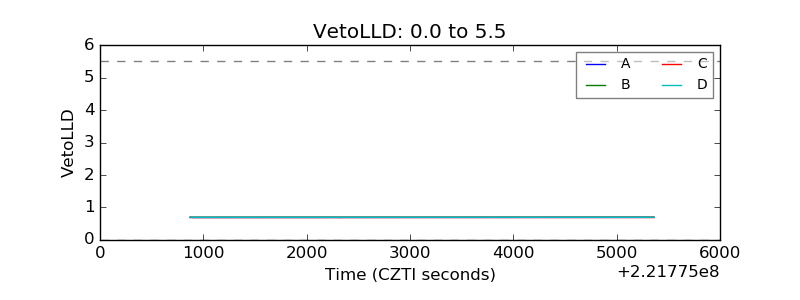 |
| Alpha Counter | 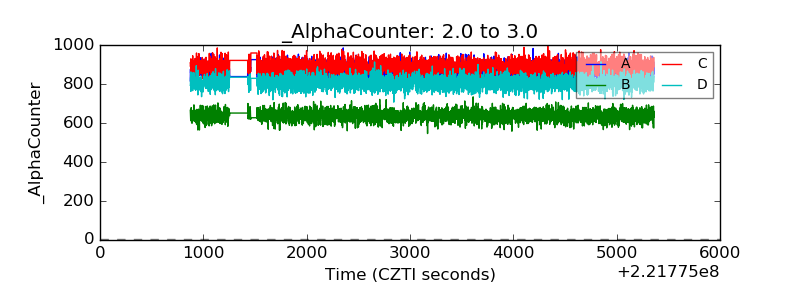 |
| _CPM_Rate | 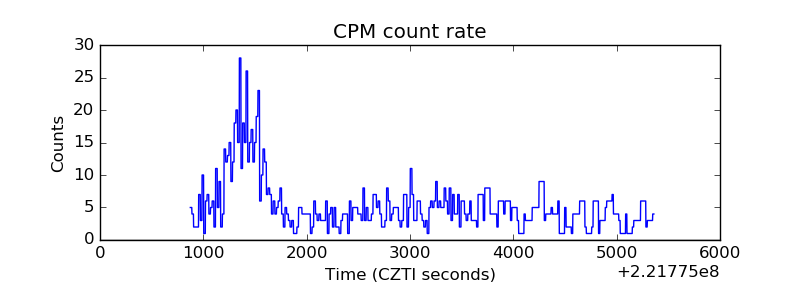 |
| CZT Counter | 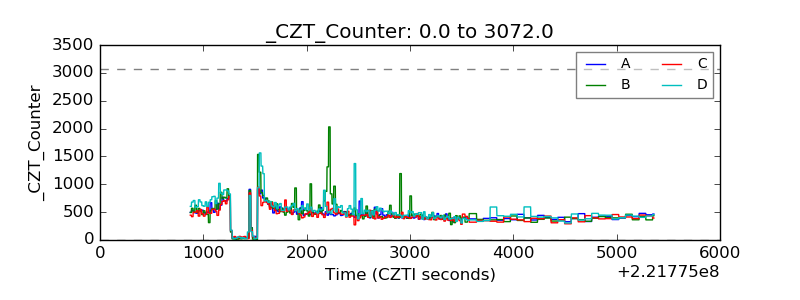 |
| +2.5 Volts monitor |  |
| +5 Volts monitor |  |
| _ROLL_ROT | 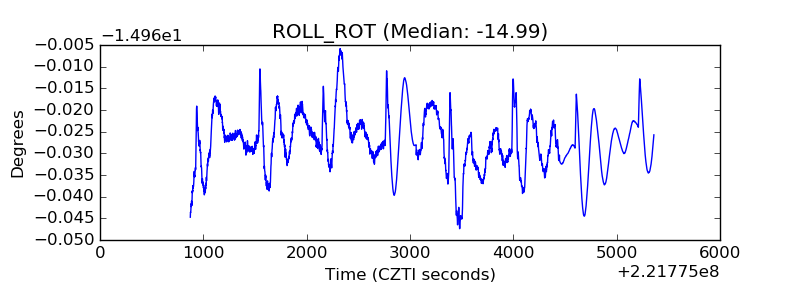 |
| _Roll_DEC | 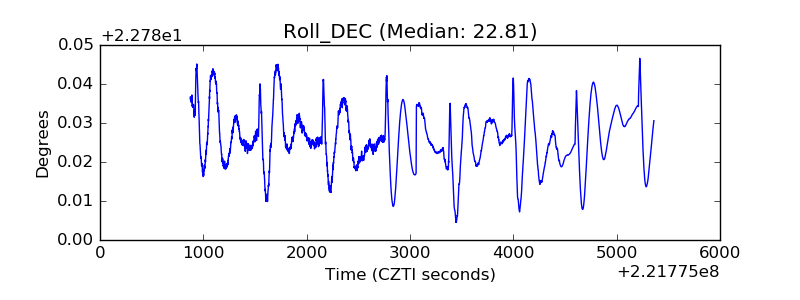 |
| _Roll_RA | 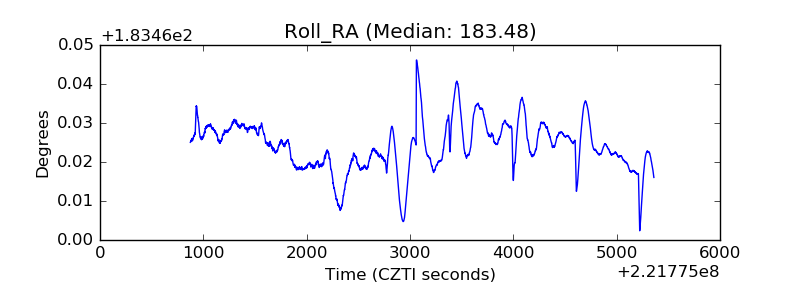 |
| Veto Counter | 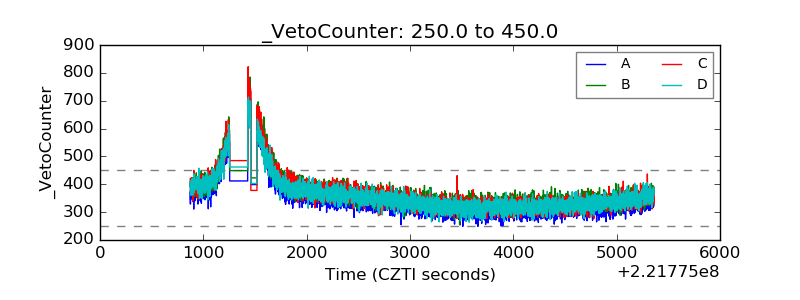 |