| Param | Original file | Final file |
|---|---|---|
| Filename | modeM0/AS1A02_090T02_9000000956_06973cztM0_level2.evt | modeM0/AS1A02_090T02_9000000956_06973cztM0_level2_quad_clean.evt |
| Size (bytes) | 392,561,280 | 78,952,320 |
| Size | 374.4 MB | 75.3 MB |
| Events in quadrant A | 2,785,888 | 493,398 |
| Events in quadrant B | 2,800,071 | 498,099 |
| Events in quadrant C | 2,707,743 | 494,390 |
| Events in quadrant D | 3,177,522 | 476,718 |
| Mode M0 | |||
|---|---|---|---|
| Quadrant | BADHDUFLAG | Total packets | Discarded packets |
| A | 0 | 12482 | 2 |
| B | 0 | 12512 | 1 |
| C | 0 | 12435 | 1 |
| D | 0 | 13534 | 1 |
| Mode SS | |||
|---|---|---|---|
| Quadrant | BADHDUFLAG | Total packets | Discarded packets |
| A | 0 | 126 | 0 |
| B | 0 | 126 | 0 |
| C | 0 | 126 | 0 |
| D | 0 | 126 | 0 |
| Mode M9 | |||
|---|---|---|---|
| Quadrant | BADHDUFLAG | Total packets | Discarded packets |
| A | 0 | 10 | 0 |
| B | 0 | 10 | 0 |
| C | 0 | 10 | 0 |
| D | 0 | 10 | 0 |
| Quadrant | Total seconds | Saturated seconds | Saturation percentage |
|---|---|---|---|
| A | 6128 | 38 | 0.620104% |
| B | 6128 | 34 | 0.554830% |
| C | 6128 | 19 | 0.310052% |
| D | 6128 | 32 | 0.522193% |
Noise dominated data is calculated using 1-second bins in cleaned event files. If a bin has >2000 counts, and if more than 50% of those come from <1% of pixels, then it is considered to be noise-dominated and hence unusable.
| Quadrant | # 1 sec bins | Bins with >0 counts | Bins with >2000 counts | High rate bins dominated by noise | Noise dominated (total time) | Noise dominated (detector-on time) | Marked lightcurve |
|---|---|---|---|---|---|---|---|
| A | 7194 | 6129 | 0 | 0 | 0.00% | 0.00% | 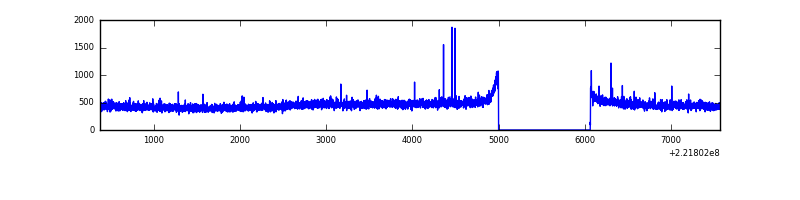 |
| B | 7194 | 6129 | 5 | 5 | 0.07% | 0.08% | 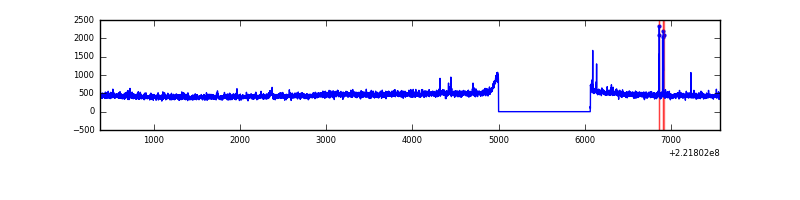 |
| C | 7194 | 6129 | 0 | 0 | 0.00% | 0.00% | 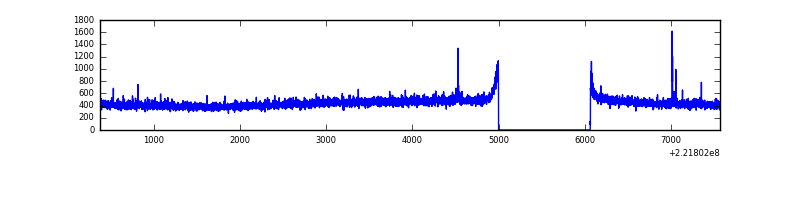 |
| D | 7194 | 6129 | 5 | 5 | 0.07% | 0.08% | 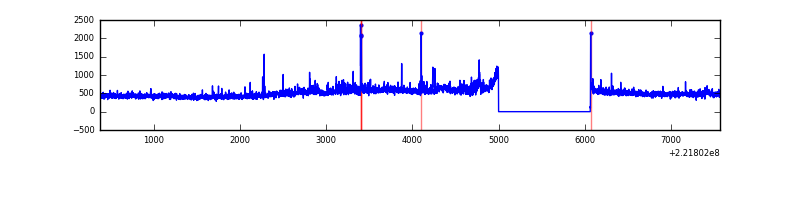 |
Top three noisy pixels from each quadrant. If the there are fewer than three noisy pixels in the level2.evt file, extra rows are filled as -1
| Pixel properties | Quadrant properties | ||||||
|---|---|---|---|---|---|---|---|
| Quadrant | DetID | PixID | Counts | Sigma | Mean | Median | Sigma |
| A | 13 | 14 | 18366 | 121.03 | 714 | 699 | 146.0 |
| A | 4 | 2 | 9689 | 61.59 | 714 | 699 | 146.0 |
| A | 0 | 226 | 6748 | 41.44 | 714 | 699 | 146.0 |
| B | 0 | 219 | 29094 | 206.57 | 713 | 694 | 137.5 |
| B | 12 | 111 | 13971 | 96.57 | 713 | 694 | 137.5 |
| B | 11 | 111 | 11150 | 76.05 | 713 | 694 | 137.5 |
| C | 7 | 247 | 13096 | 77.29 | 689 | 694 | 160.5 |
| C | 13 | 61 | 5233 | 28.29 | 689 | 694 | 160.5 |
| C | 3 | 233 | 4110 | 21.29 | 689 | 694 | 160.5 |
| D | 8 | 195 | 369998 | 2184.21 | 691 | 667 | 169.1 |
| D | 1 | 239 | 90030 | 528.49 | 691 | 667 | 169.1 |
| D | 2 | 136 | 64420 | 377.03 | 691 | 667 | 169.1 |
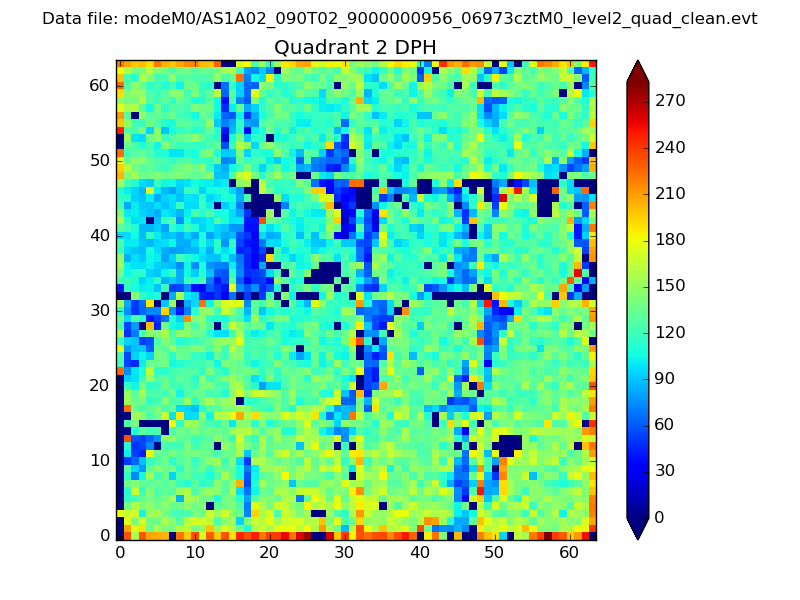
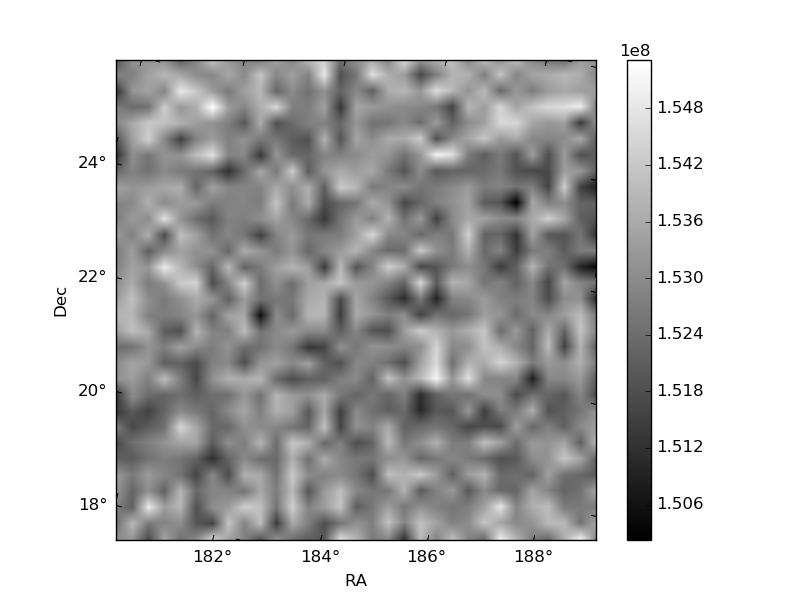
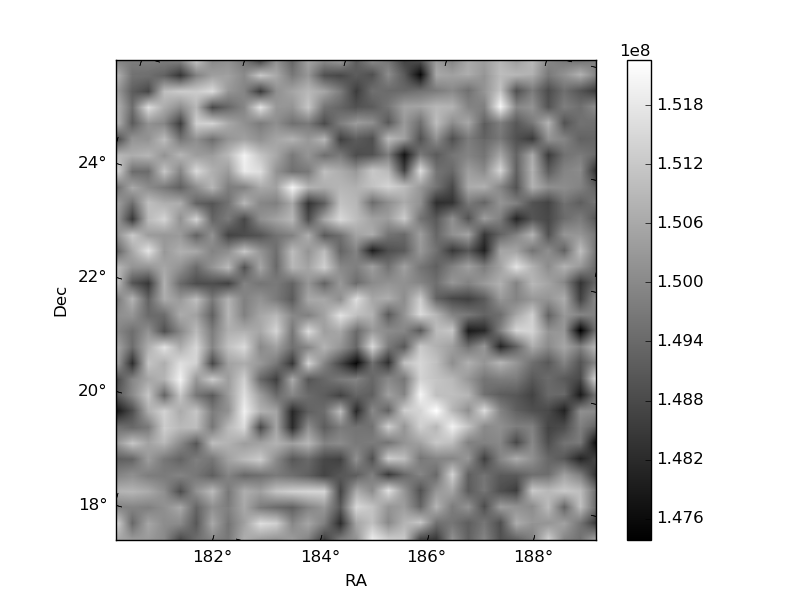
Histogram calculated using DETX and DETY for each event in the final _common_clean file
| Quadrant A | 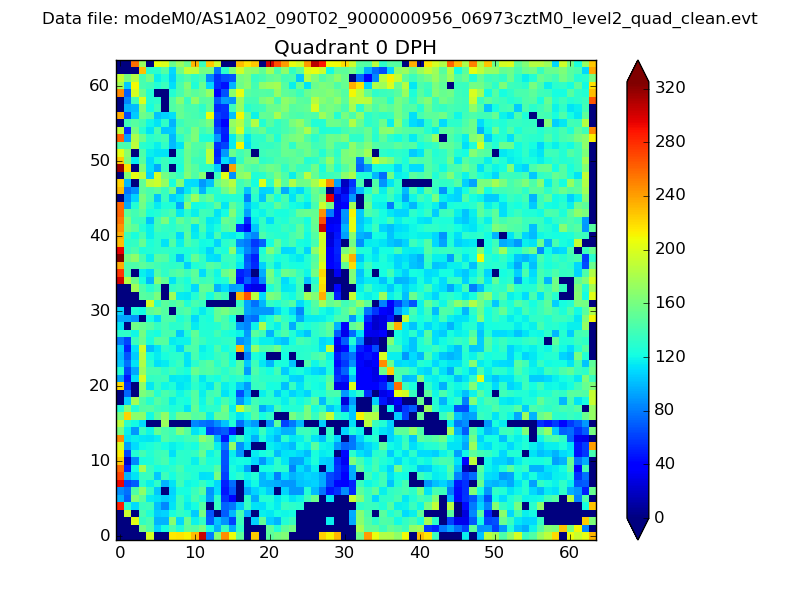 |
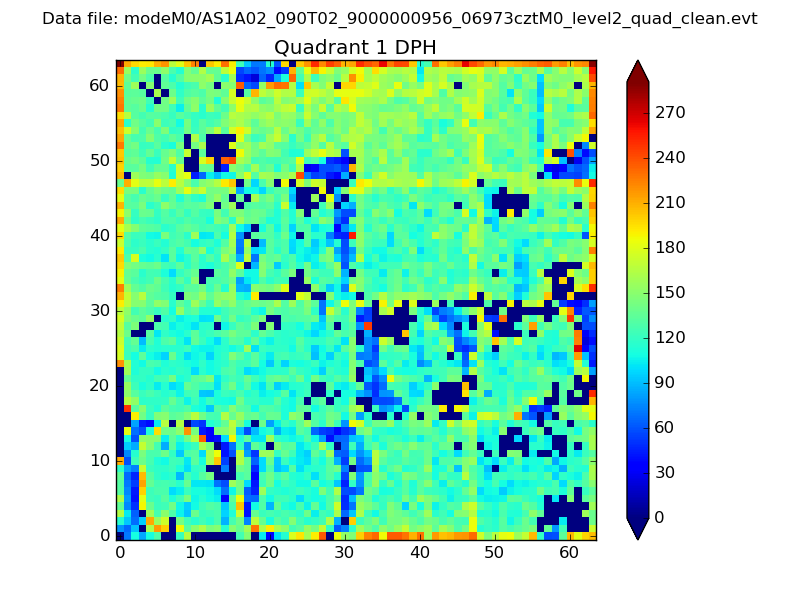 |
Quadrant B |
|---|---|---|---|
| Quadrant D | 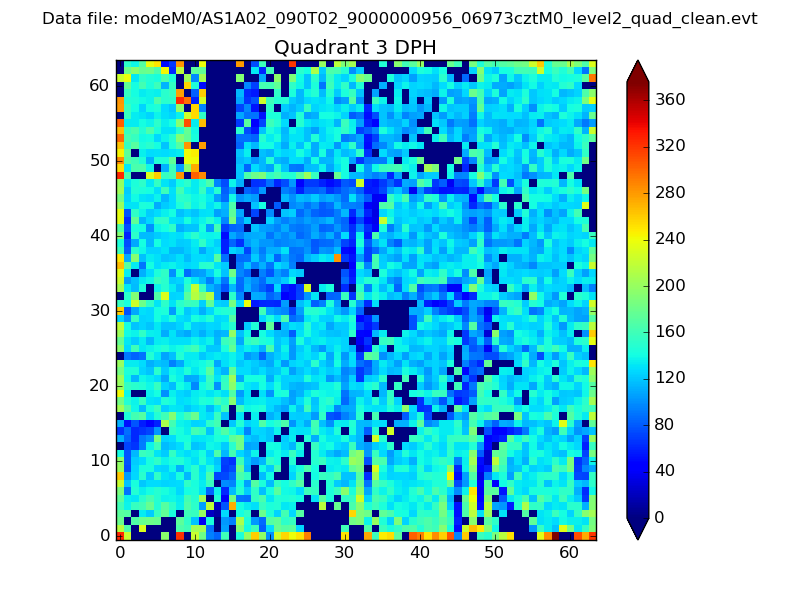 |
 |
Quadrant C |
| Plot type | Count rate plots | Images |
|---|---|---|
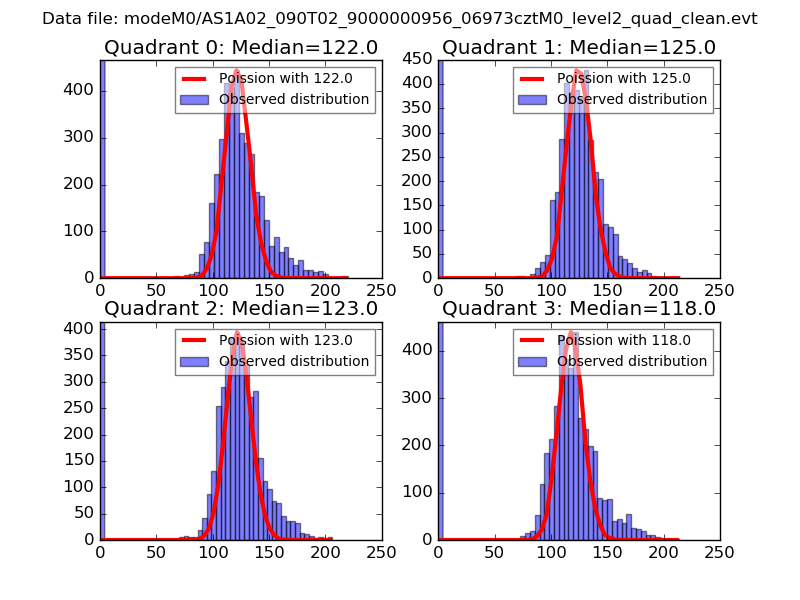
| Comparison with Poisson distribution Blue bars denote a histogram of data divided into 1 sec bins. Red curve is a Poisson curve with rate = median count rate of data. |
 |
 |
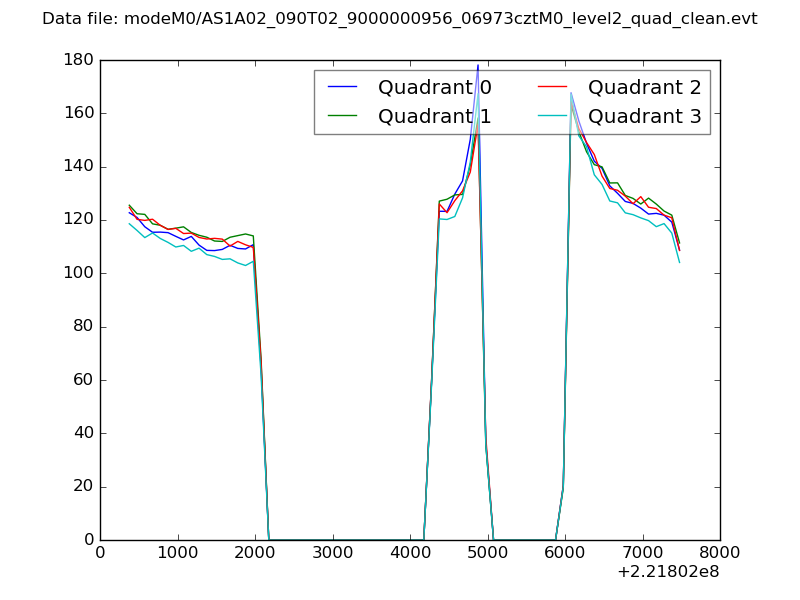
| Quadrant-wise count rates Data is divided into 100 sec bins |
 |
|
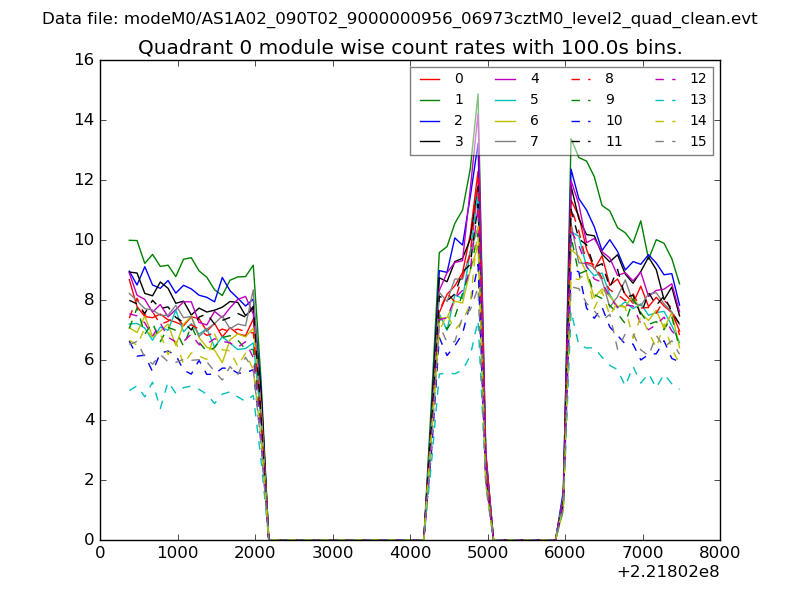
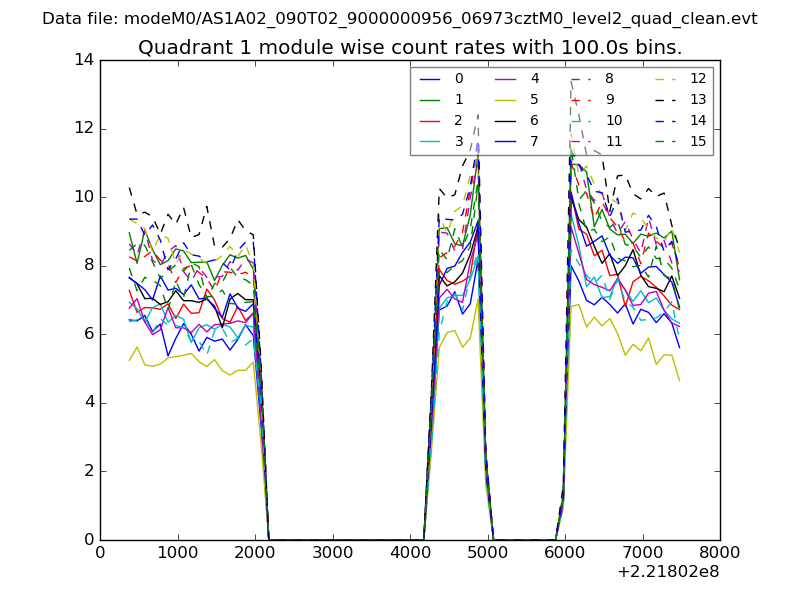
| Module-wise count rates for Quadrant A Data is divided into 100 sec bins |
 |
 |
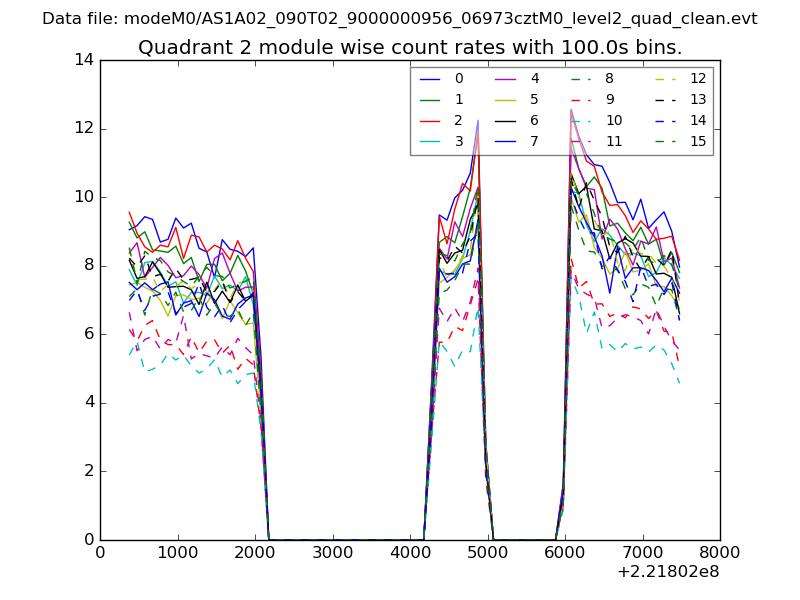
| Module-wise count rates for Quadrant B Data is divided into 100 sec bins |
 |
 |
| Module-wise count rates for Quadrant C Data is divided into 100 sec bins |
 |
 |
| Module-wise count rates for Quadrant D Data is divided into 100 sec bins |
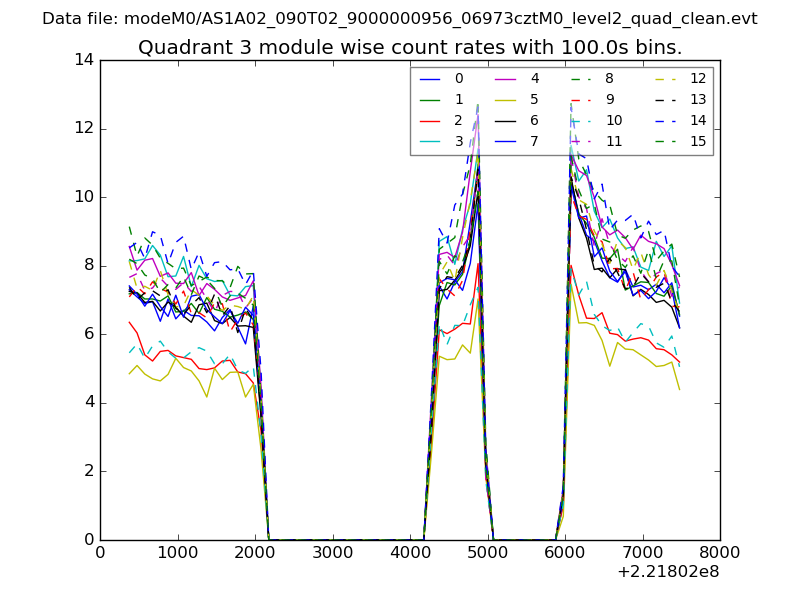 |
 |
| Parameter | Plot |
|---|---|
| CZT HV Monitor | 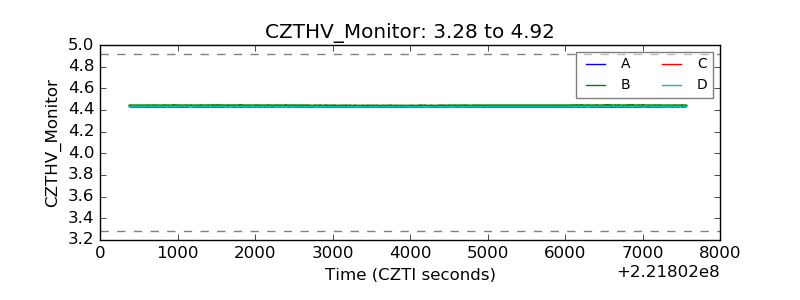 |
| D_VDD | 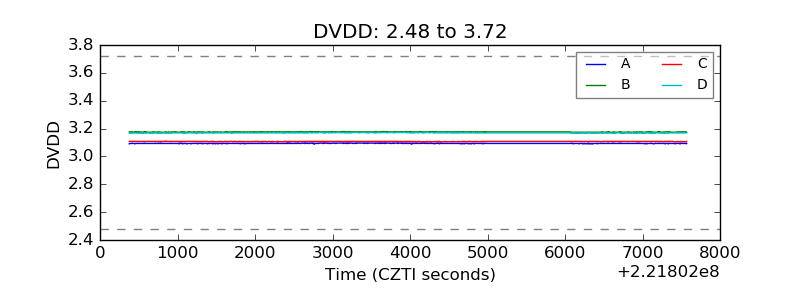 |
| Temperature 1 | 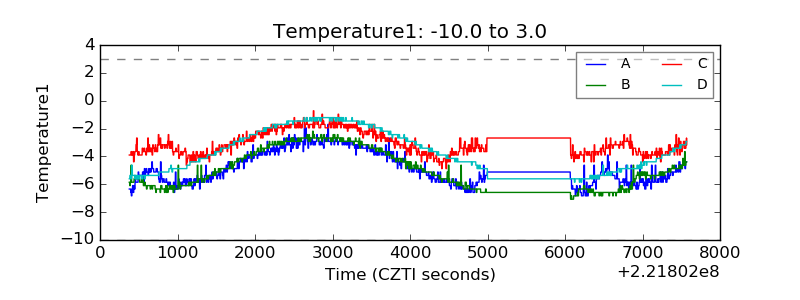 |
| Veto HV Monitor | 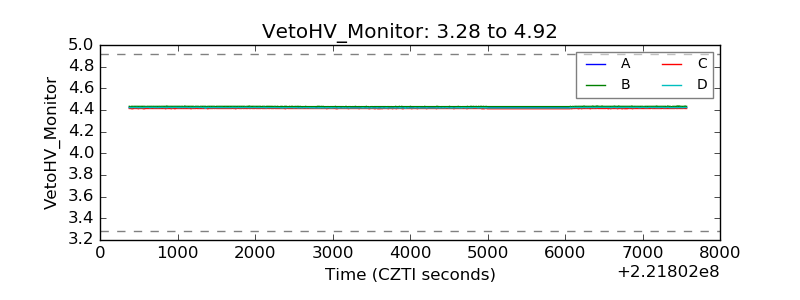 |
| Veto LLD | 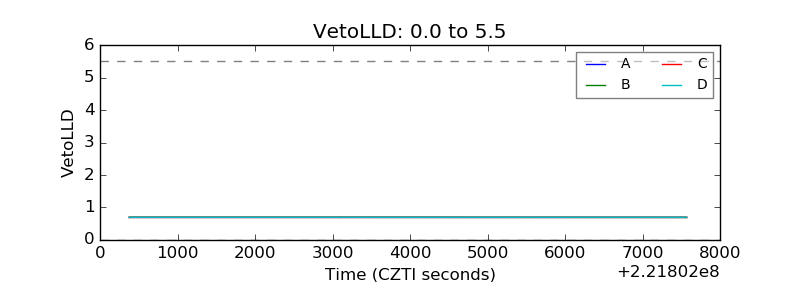 |
| Alpha Counter | 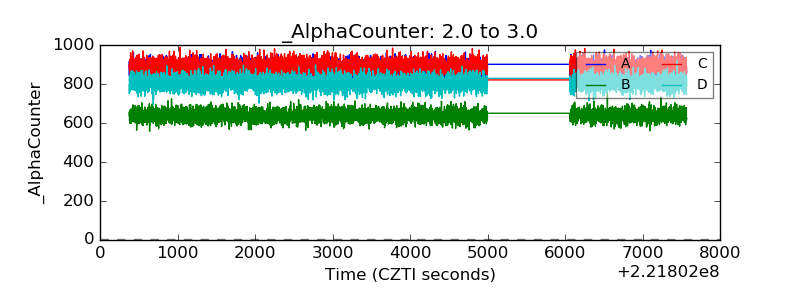 |
| _CPM_Rate | 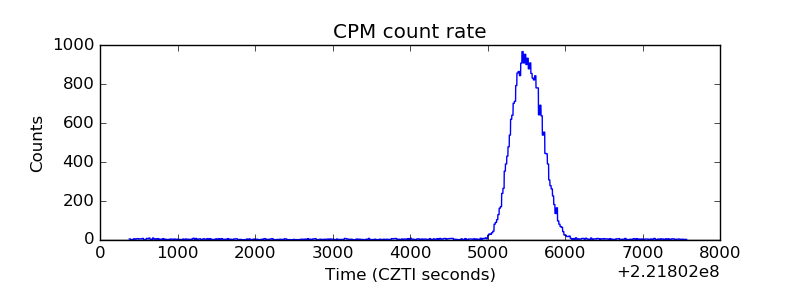 |
| CZT Counter | 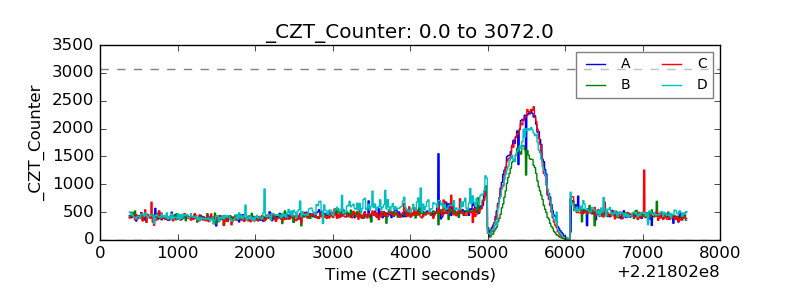 |
| +2.5 Volts monitor |  |
| +5 Volts monitor | 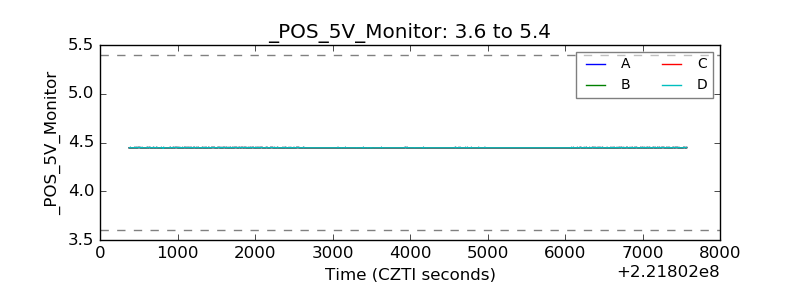 |
| _ROLL_ROT | 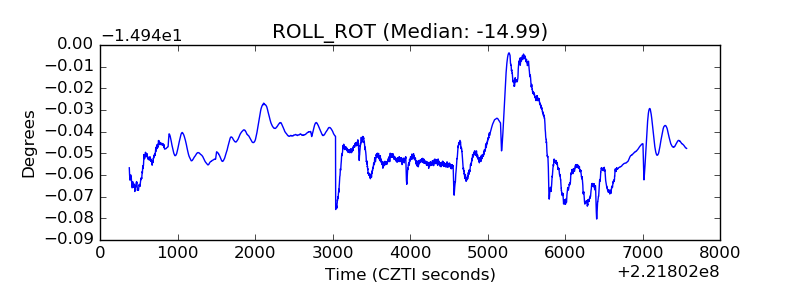 |
| _Roll_DEC | 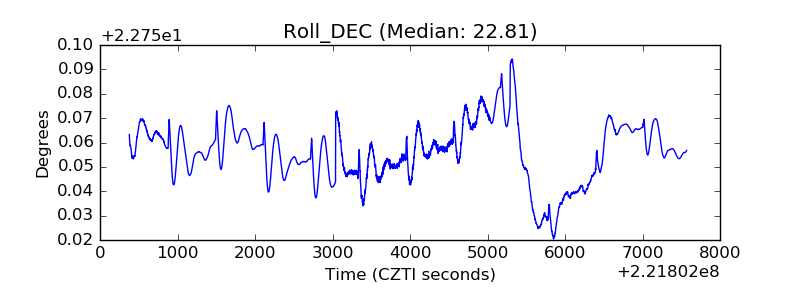 |
| _Roll_RA | 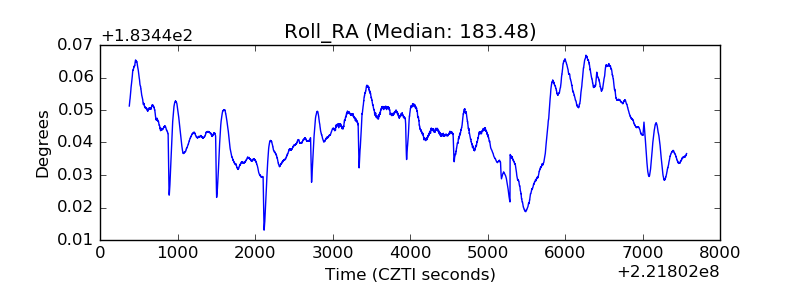 |
| Veto Counter | 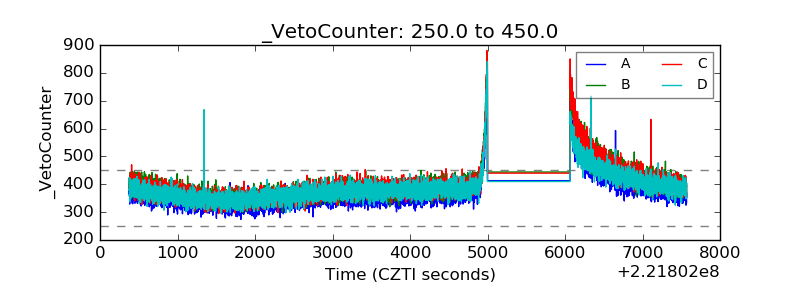 |