| Param | Original file | Final file |
|---|---|---|
| Filename | modeM0/AS1A02_090T02_9000000956_06974cztM0_level2.evt | modeM0/AS1A02_090T02_9000000956_06974cztM0_level2_quad_clean.evt |
| Size (bytes) | 442,560,960 | 86,546,880 |
| Size | 422.1 MB | 82.5 MB |
| Events in quadrant A | 3,017,864 | 548,051 |
| Events in quadrant B | 3,039,184 | 557,156 |
| Events in quadrant C | 2,911,287 | 553,207 |
| Events in quadrant D | 4,005,234 | 521,556 |
| Mode M0 | |||
|---|---|---|---|
| Quadrant | BADHDUFLAG | Total packets | Discarded packets |
| A | 0 | 13013 | 2 |
| B | 0 | 13018 | 1 |
| C | 0 | 12871 | 1 |
| D | 0 | 15589 | 1 |
| Mode SS | |||
|---|---|---|---|
| Quadrant | BADHDUFLAG | Total packets | Discarded packets |
| A | 0 | 128 | 0 |
| B | 0 | 128 | 0 |
| C | 0 | 128 | 0 |
| D | 0 | 128 | 0 |
| Mode M9 | |||
|---|---|---|---|
| Quadrant | BADHDUFLAG | Total packets | Discarded packets |
| A | 0 | 12 | 0 |
| B | 0 | 12 | 0 |
| C | 0 | 12 | 0 |
| D | 0 | 12 | 0 |
| Quadrant | Total seconds | Saturated seconds | Saturation percentage |
|---|---|---|---|
| A | 6318 | 73 | 1.155429% |
| B | 6318 | 72 | 1.139601% |
| C | 6318 | 35 | 0.553973% |
| D | 6318 | 294 | 4.653371% |
Noise dominated data is calculated using 1-second bins in cleaned event files. If a bin has >2000 counts, and if more than 50% of those come from <1% of pixels, then it is considered to be noise-dominated and hence unusable.
| Quadrant | # 1 sec bins | Bins with >0 counts | Bins with >2000 counts | High rate bins dominated by noise | Noise dominated (total time) | Noise dominated (detector-on time) | Marked lightcurve |
|---|---|---|---|---|---|---|---|
| A | 7468 | 6319 | 2 | 2 | 0.03% | 0.03% | 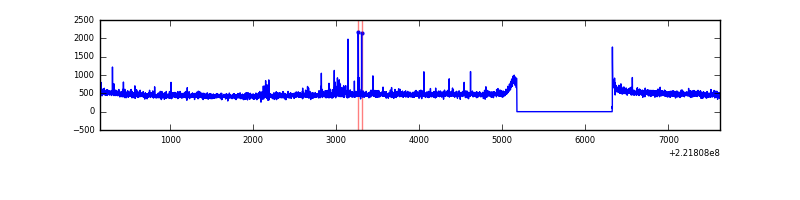 |
| B | 7468 | 6319 | 10 | 10 | 0.13% | 0.16% | 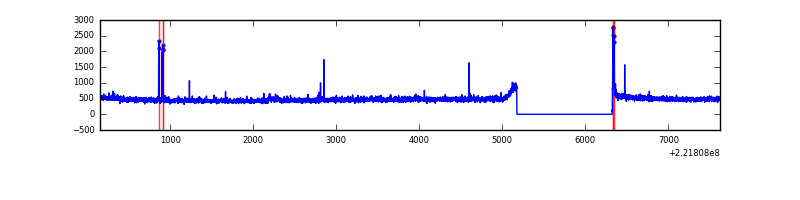 |
| C | 7468 | 6319 | 1 | 1 | 0.01% | 0.02% | 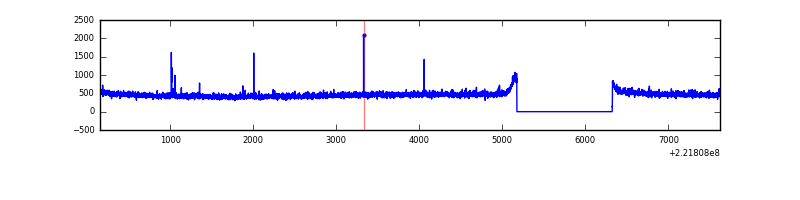 |
| D | 7468 | 6319 | 238 | 238 | 3.19% | 3.77% | 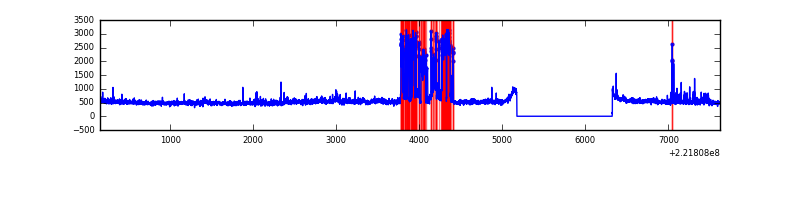 |
Top three noisy pixels from each quadrant. If the there are fewer than three noisy pixels in the level2.evt file, extra rows are filled as -1
| Pixel properties | Quadrant properties | ||||||
|---|---|---|---|---|---|---|---|
| Quadrant | DetID | PixID | Counts | Sigma | Mean | Median | Sigma |
| A | 14 | 239 | 36765 | 233.48 | 765 | 751 | 154.2 |
| A | 0 | 23 | 20055 | 125.15 | 765 | 751 | 154.2 |
| A | 0 | 226 | 8630 | 51.08 | 765 | 751 | 154.2 |
| B | 0 | 219 | 50600 | 341.8 | 764 | 747 | 145.9 |
| B | 0 | 228 | 15536 | 101.4 | 764 | 747 | 145.9 |
| B | 12 | 111 | 14734 | 95.9 | 764 | 747 | 145.9 |
| C | 7 | 247 | 8785 | 47.13 | 740 | 745 | 170.6 |
| C | 1 | 16 | 6734 | 35.11 | 740 | 745 | 170.6 |
| C | 13 | 61 | 5677 | 28.91 | 740 | 745 | 170.6 |
| D | 1 | 239 | 716502 | 3934.66 | 732 | 709 | 181.9 |
| D | 8 | 195 | 426348 | 2339.71 | 732 | 709 | 181.9 |
| D | 2 | 136 | 91985 | 501.74 | 732 | 709 | 181.9 |
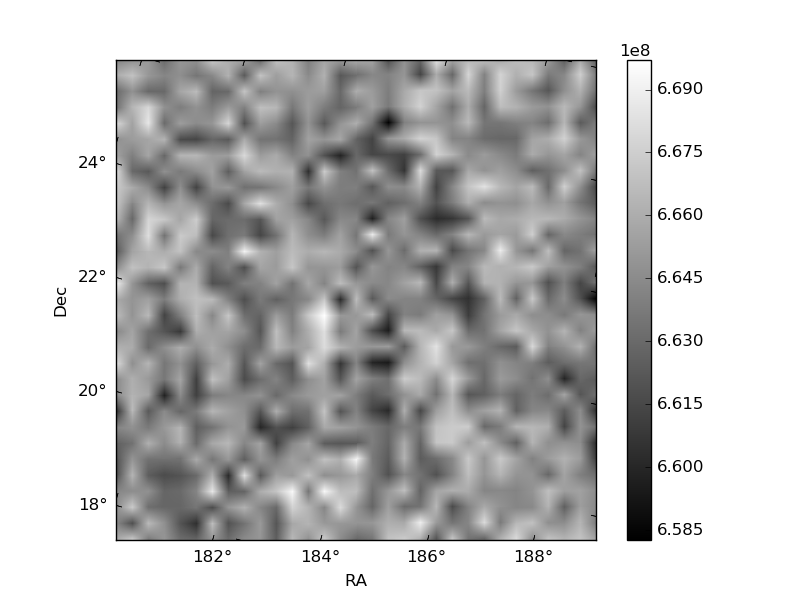
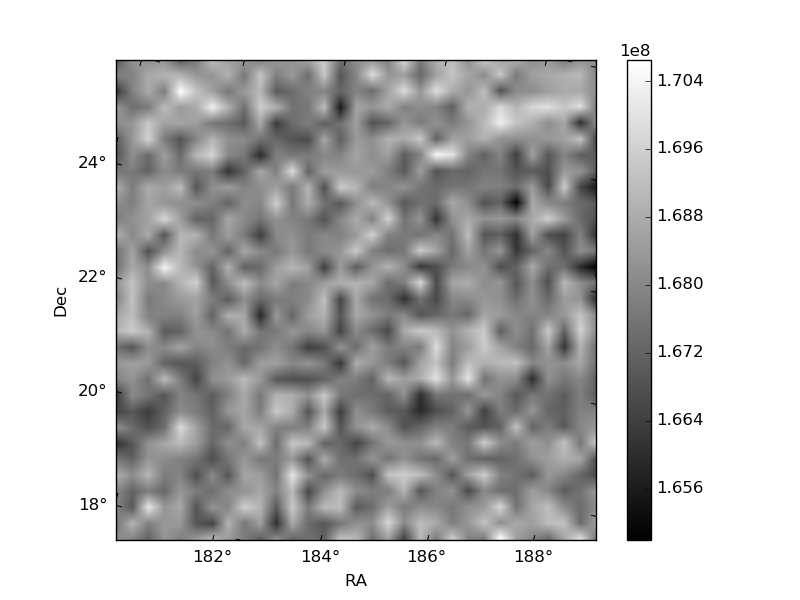
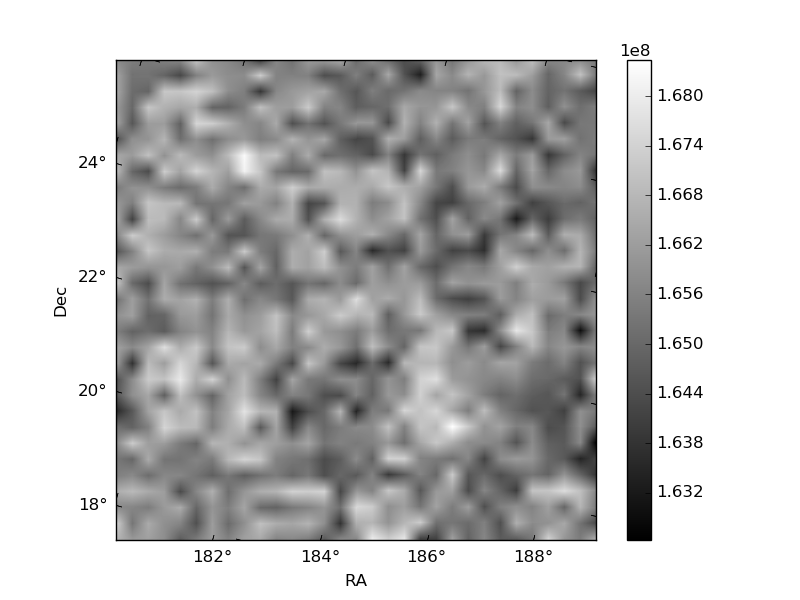
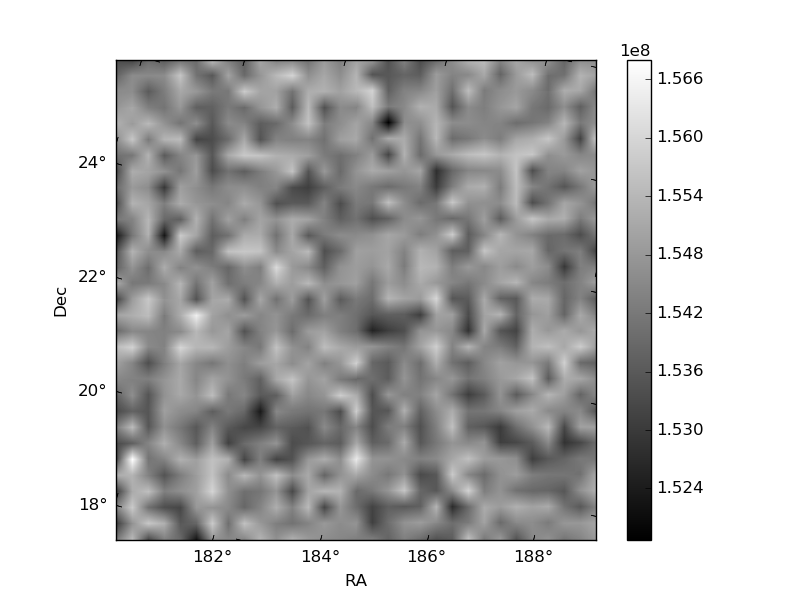
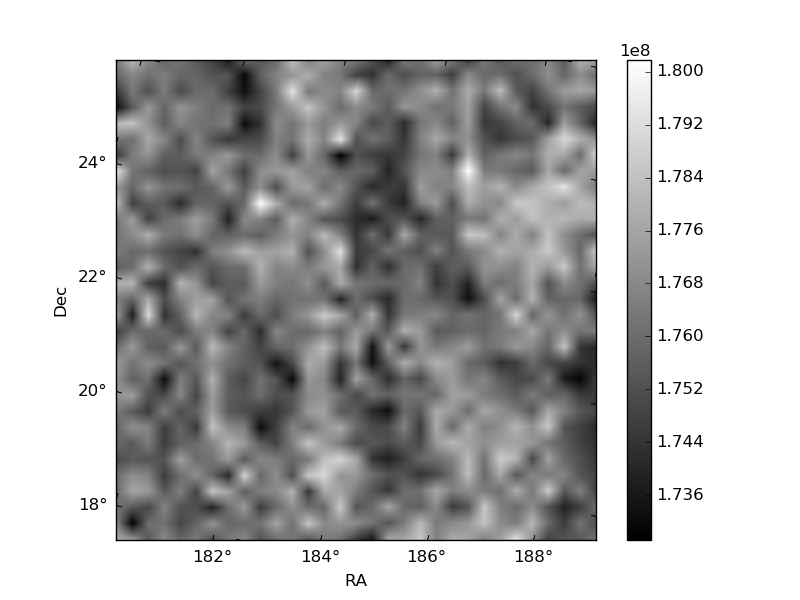
Histogram calculated using DETX and DETY for each event in the final _common_clean file
| Quadrant A | 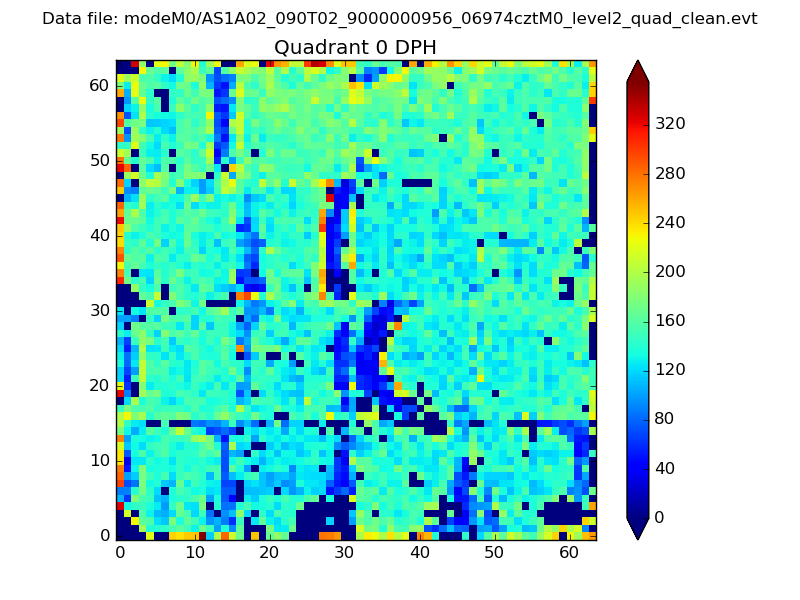 |
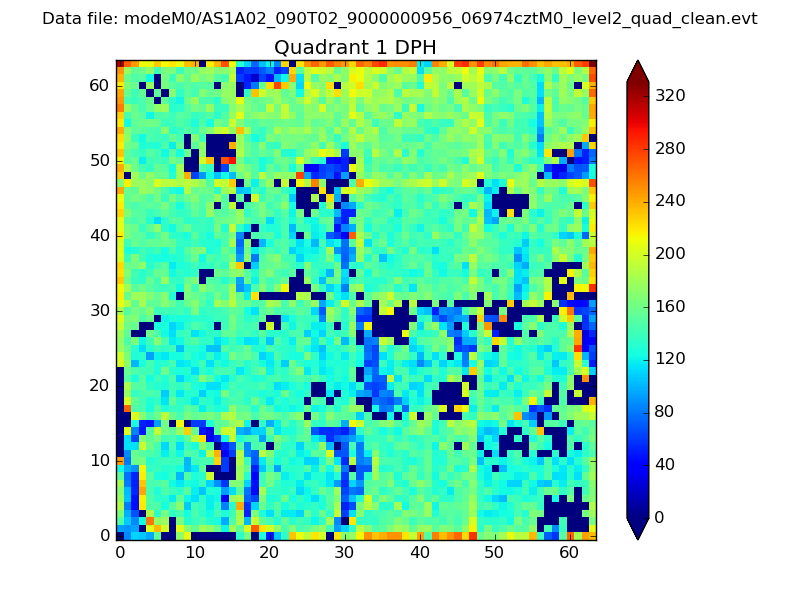 |
Quadrant B |
|---|---|---|---|
| Quadrant D | 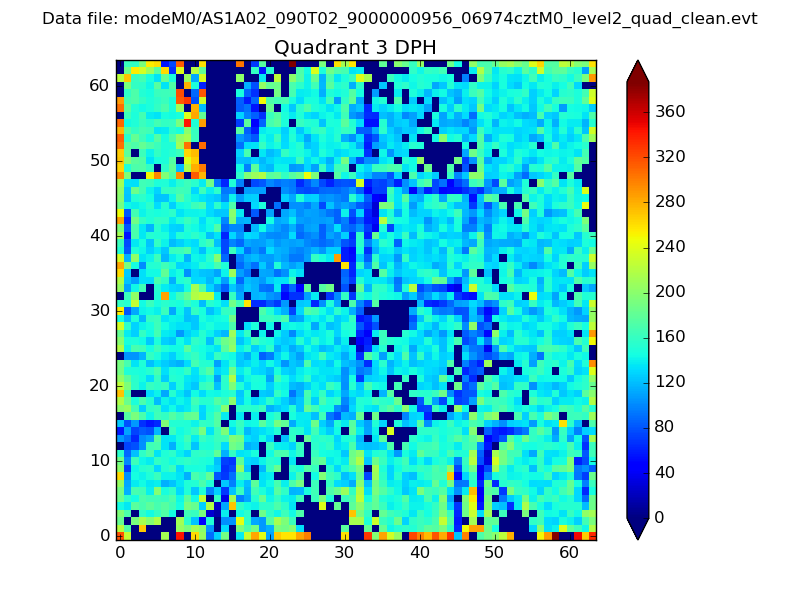 |
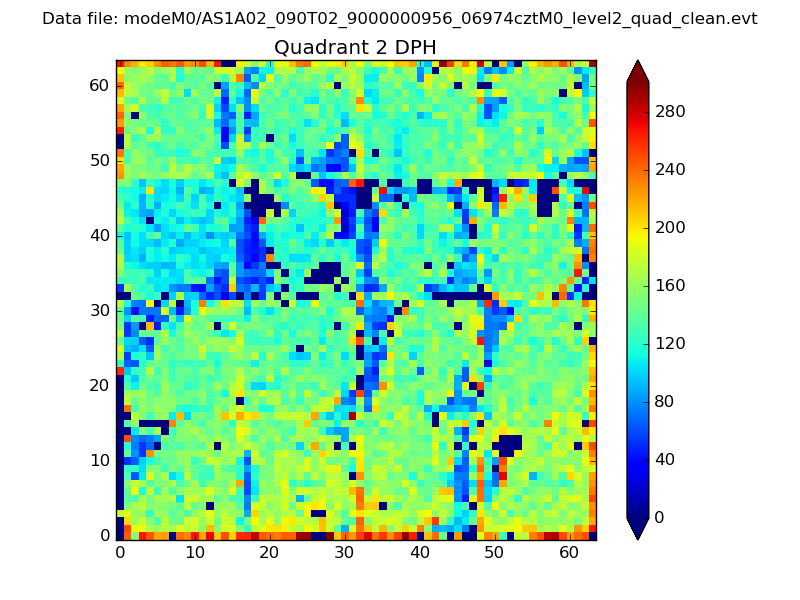 |
Quadrant C |
| Plot type | Count rate plots | Images |
|---|---|---|
| Comparison with Poisson distribution Blue bars denote a histogram of data divided into 1 sec bins. Red curve is a Poisson curve with rate = median count rate of data. |
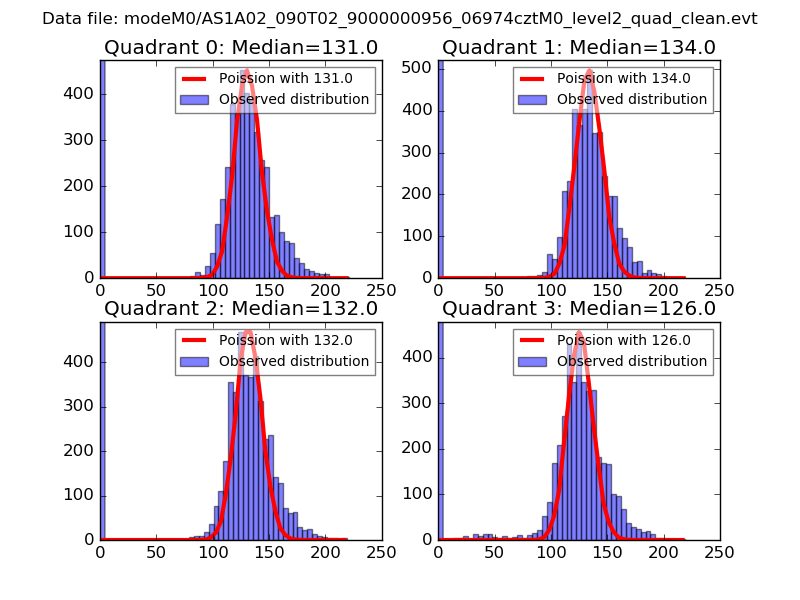 |
 |
| Quadrant-wise count rates Data is divided into 100 sec bins |
 |
|
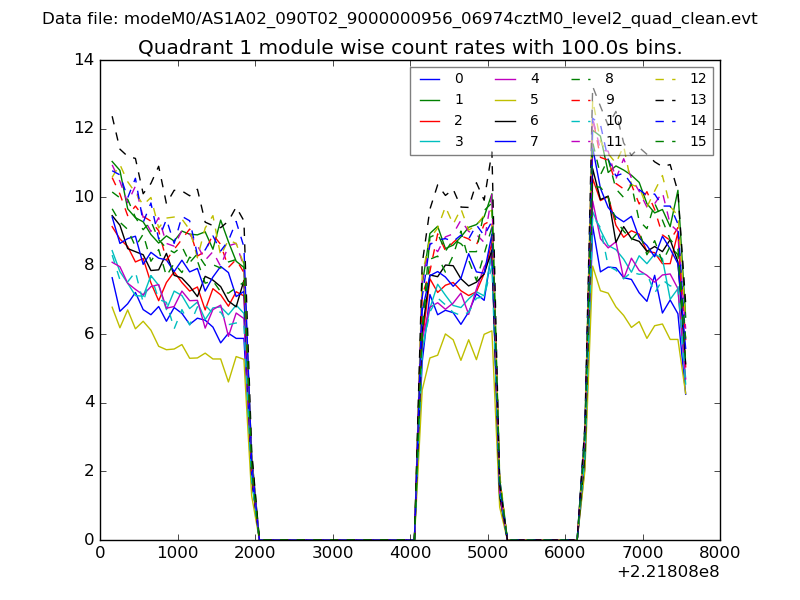
| Module-wise count rates for Quadrant A Data is divided into 100 sec bins |
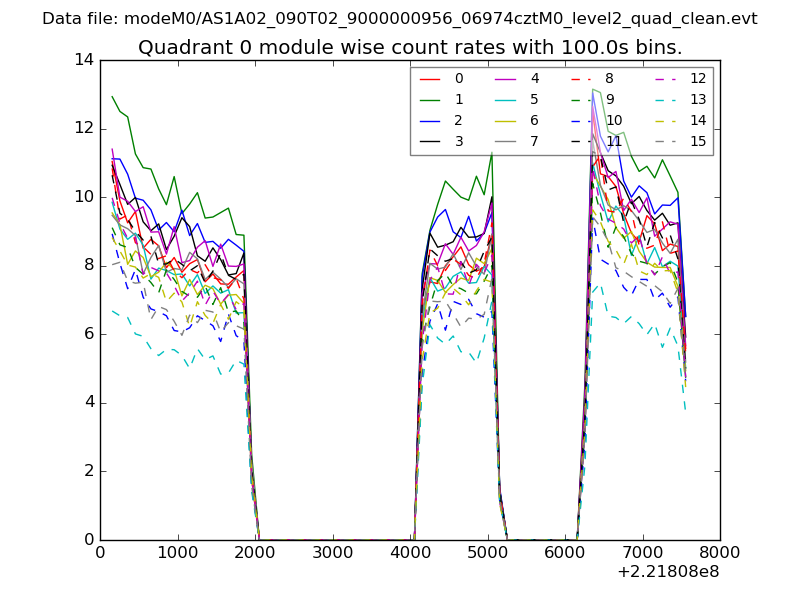 |
 |
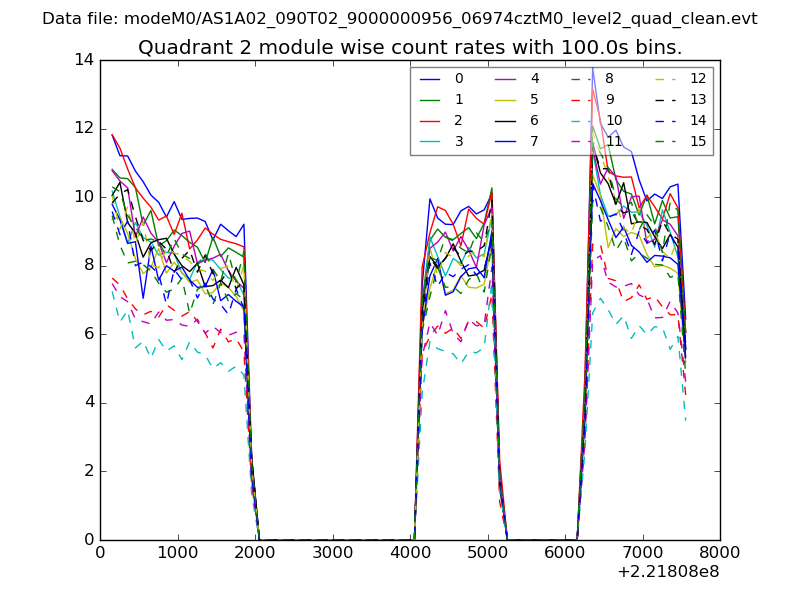
| Module-wise count rates for Quadrant B Data is divided into 100 sec bins |
 |
 |
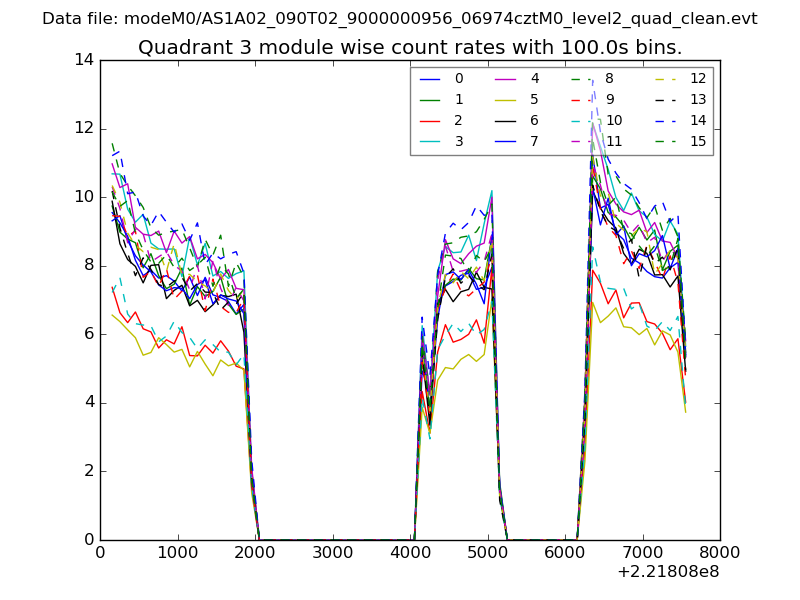
| Module-wise count rates for Quadrant C Data is divided into 100 sec bins |
 |
 |
| Module-wise count rates for Quadrant D Data is divided into 100 sec bins |
 |
 |
| Parameter | Plot |
|---|---|
| CZT HV Monitor | 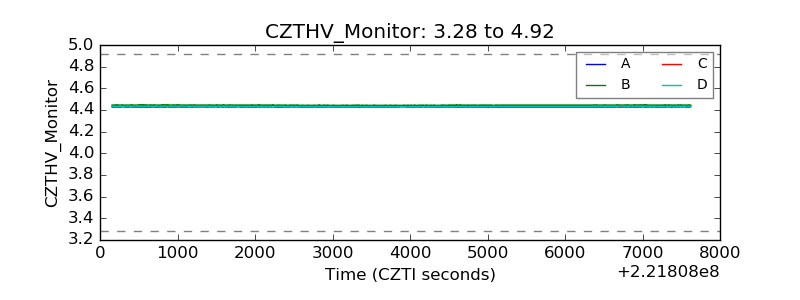 |
| D_VDD | 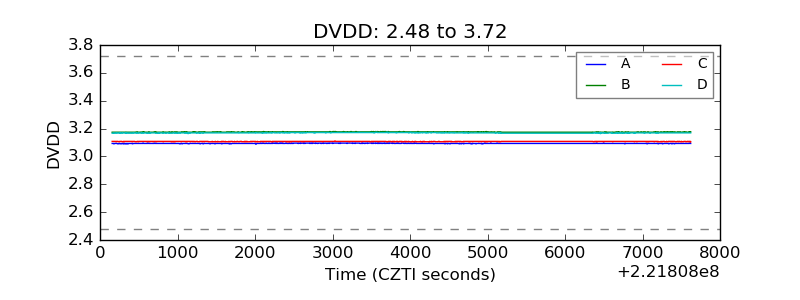 |
| Temperature 1 | 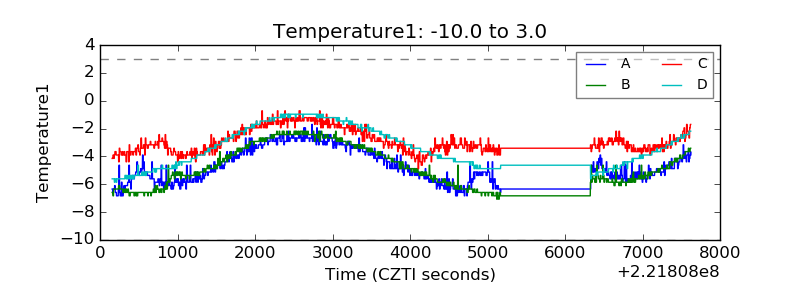 |
| Veto HV Monitor | 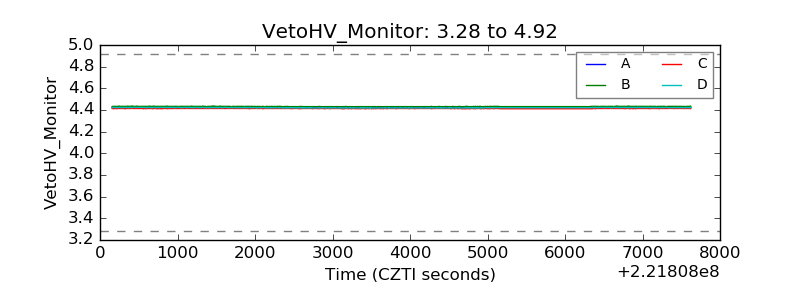 |
| Veto LLD | 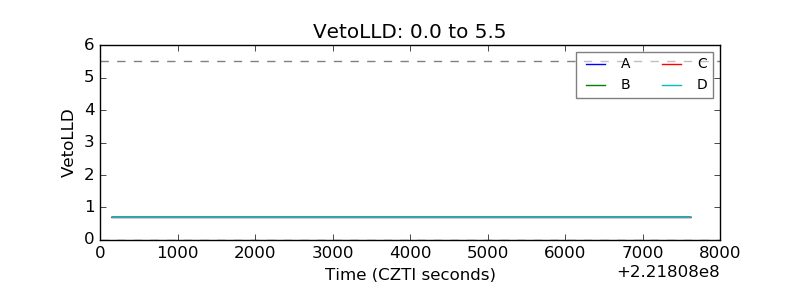 |
| Alpha Counter | 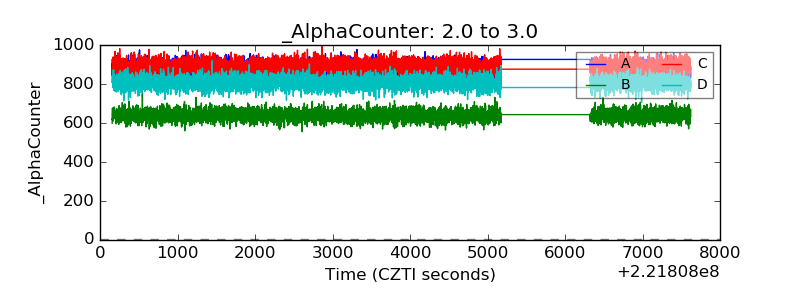 |
| _CPM_Rate | 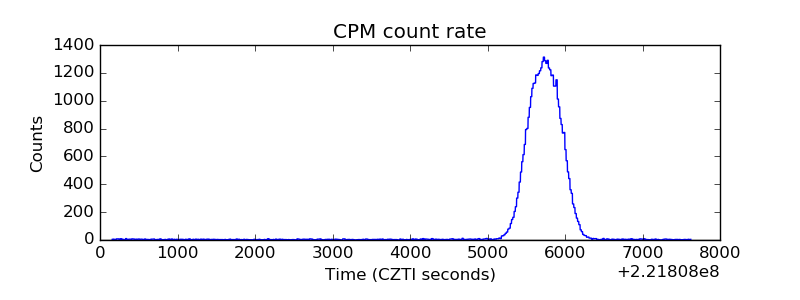 |
| CZT Counter | 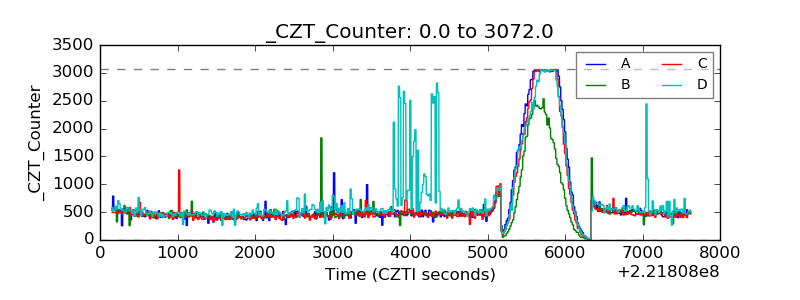 |
| +2.5 Volts monitor | 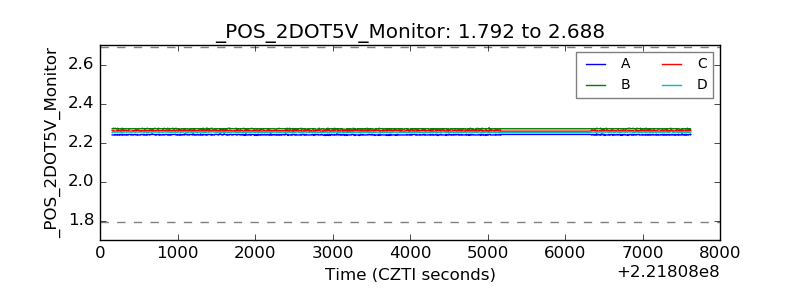 |
| +5 Volts monitor |  |
| _ROLL_ROT | 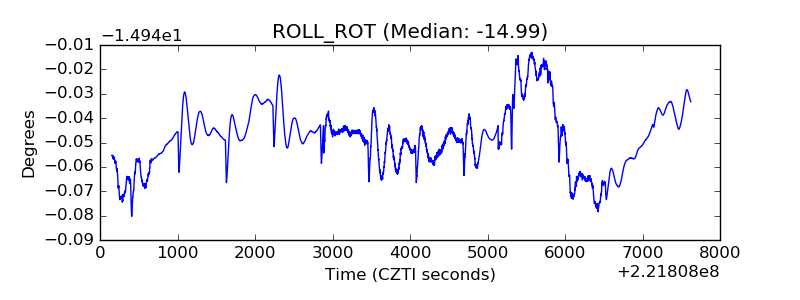 |
| _Roll_DEC | 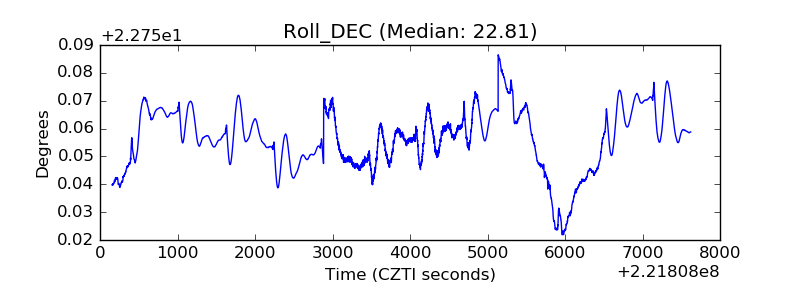 |
| _Roll_RA | 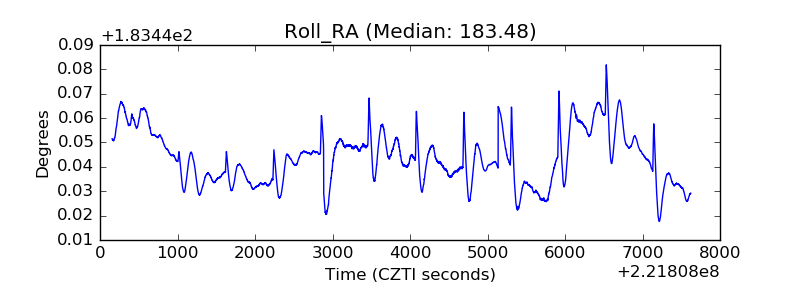 |
| Veto Counter | 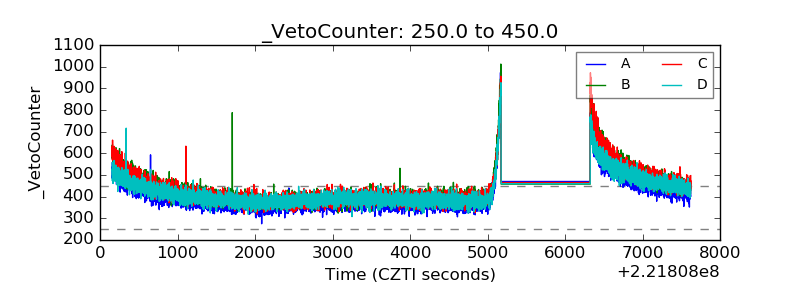 |