| Param | Original file | Final file |
|---|---|---|
| Filename | modeM0/AS1A02_090T02_9000000956_06976cztM0_level2.evt | modeM0/AS1A02_090T02_9000000956_06976cztM0_level2_quad_clean.evt |
| Size (bytes) | 438,312,960 | 77,952,960 |
| Size | 418.0 MB | 74.3 MB |
| Events in quadrant A | 3,147,881 | 484,715 |
| Events in quadrant B | 3,383,202 | 491,340 |
| Events in quadrant C | 3,012,522 | 488,348 |
| Events in quadrant D | 3,310,995 | 464,912 |
| Mode M0 | |||
|---|---|---|---|
| Quadrant | BADHDUFLAG | Total packets | Discarded packets |
| A | 0 | 12941 | 2 |
| B | 0 | 13639 | 1 |
| C | 0 | 12677 | 1 |
| D | 0 | 13434 | 1 |
| Mode SS | |||
|---|---|---|---|
| Quadrant | BADHDUFLAG | Total packets | Discarded packets |
| A | 0 | 126 | 0 |
| B | 0 | 126 | 0 |
| C | 0 | 126 | 0 |
| D | 0 | 126 | 0 |
| Mode M9 | |||
|---|---|---|---|
| Quadrant | BADHDUFLAG | Total packets | Discarded packets |
| A | 0 | 13 | 0 |
| B | 0 | 13 | 0 |
| C | 0 | 13 | 0 |
| D | 0 | 13 | 0 |
| Quadrant | Total seconds | Saturated seconds | Saturation percentage |
|---|---|---|---|
| A | 6175 | 73 | 1.182186% |
| B | 6175 | 119 | 1.927126% |
| C | 6175 | 40 | 0.647773% |
| D | 6175 | 86 | 1.392713% |
Noise dominated data is calculated using 1-second bins in cleaned event files. If a bin has >2000 counts, and if more than 50% of those come from <1% of pixels, then it is considered to be noise-dominated and hence unusable.
| Quadrant | # 1 sec bins | Bins with >0 counts | Bins with >2000 counts | High rate bins dominated by noise | Noise dominated (total time) | Noise dominated (detector-on time) | Marked lightcurve |
|---|---|---|---|---|---|---|---|
| A | 7470 | 6176 | 0 | 0 | 0.00% | 0.00% | 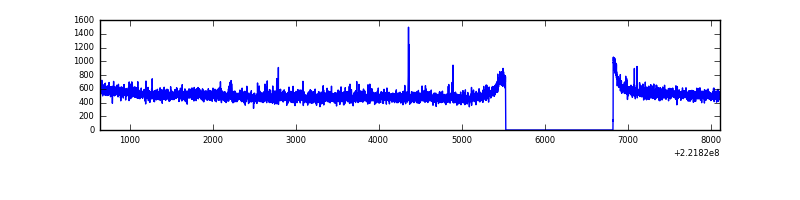 |
| B | 7470 | 6176 | 45 | 45 | 0.60% | 0.73% | 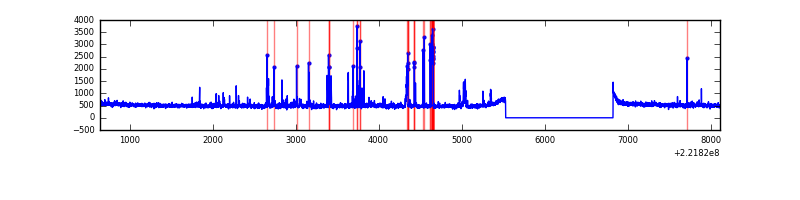 |
| C | 7470 | 6176 | 0 | 0 | 0.00% | 0.00% | 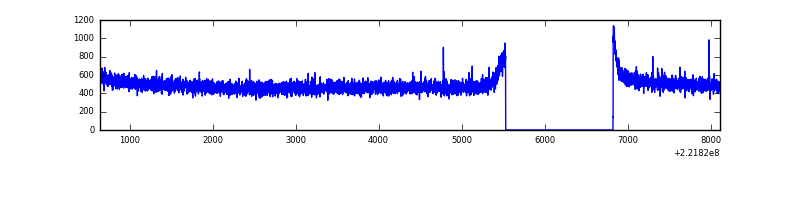 |
| D | 7470 | 6176 | 20 | 20 | 0.27% | 0.32% | 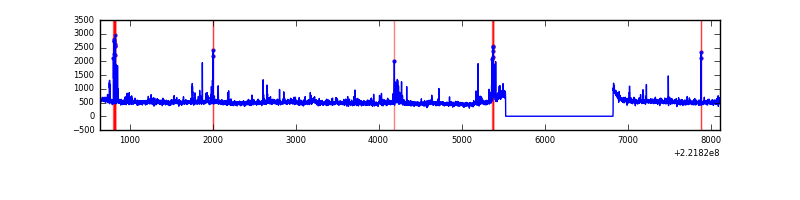 |
Top three noisy pixels from each quadrant. If the there are fewer than three noisy pixels in the level2.evt file, extra rows are filled as -1
| Pixel properties | Quadrant properties | ||||||
|---|---|---|---|---|---|---|---|
| Quadrant | DetID | PixID | Counts | Sigma | Mean | Median | Sigma |
| A | 13 | 14 | 48499 | 293.11 | 798 | 782 | 162.8 |
| A | 0 | 23 | 19181 | 113.02 | 798 | 782 | 162.8 |
| A | 0 | 226 | 9066 | 50.89 | 798 | 782 | 162.8 |
| B | 10 | 252 | 221428 | 1487.27 | 789 | 772 | 148.4 |
| B | 0 | 228 | 40442 | 267.38 | 789 | 772 | 148.4 |
| B | 0 | 214 | 26643 | 174.38 | 789 | 772 | 148.4 |
| C | 13 | 61 | 6002 | 29.7 | 770 | 775 | 176.0 |
| C | 1 | 16 | 5241 | 25.37 | 770 | 775 | 176.0 |
| C | 8 | 222 | 2598 | 10.36 | 770 | 775 | 176.0 |
| D | 8 | 195 | 155378 | 812.23 | 776 | 750 | 190.4 |
| D | 2 | 14 | 106608 | 556.05 | 776 | 750 | 190.4 |
| D | 12 | 233 | 72405 | 376.39 | 776 | 750 | 190.4 |
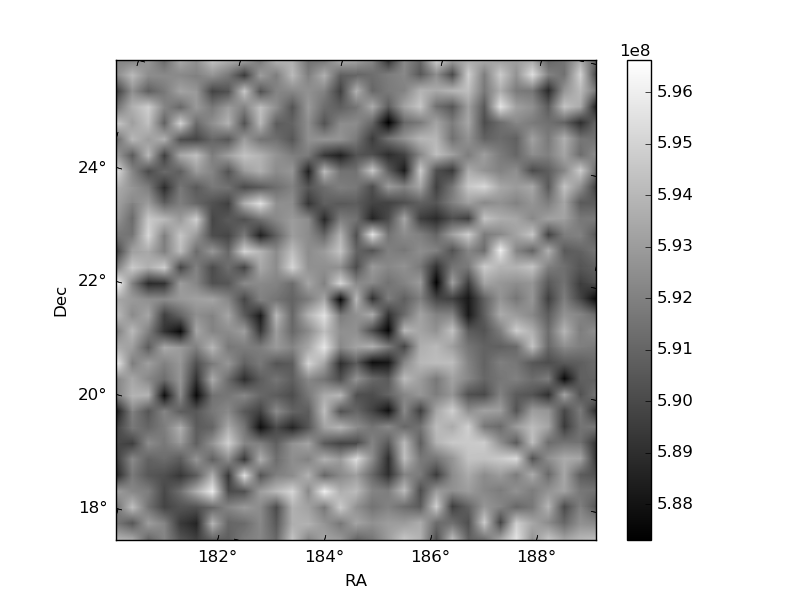
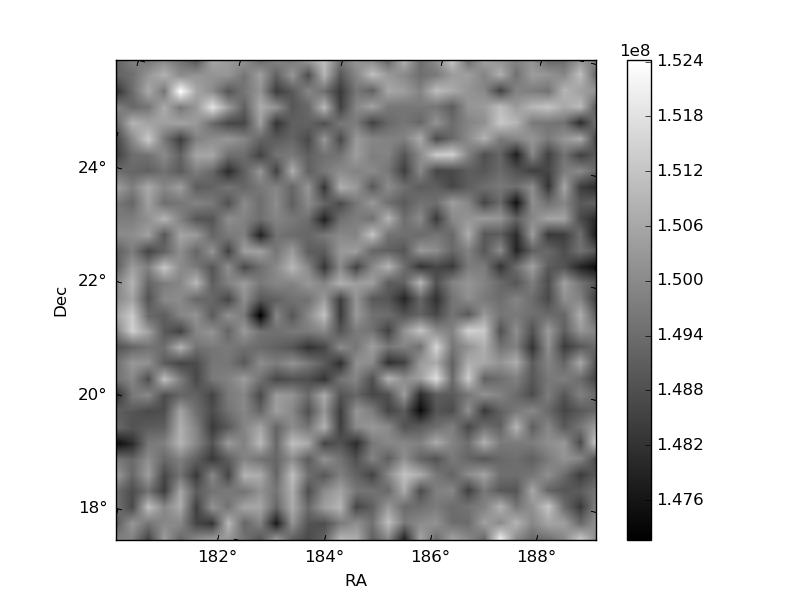
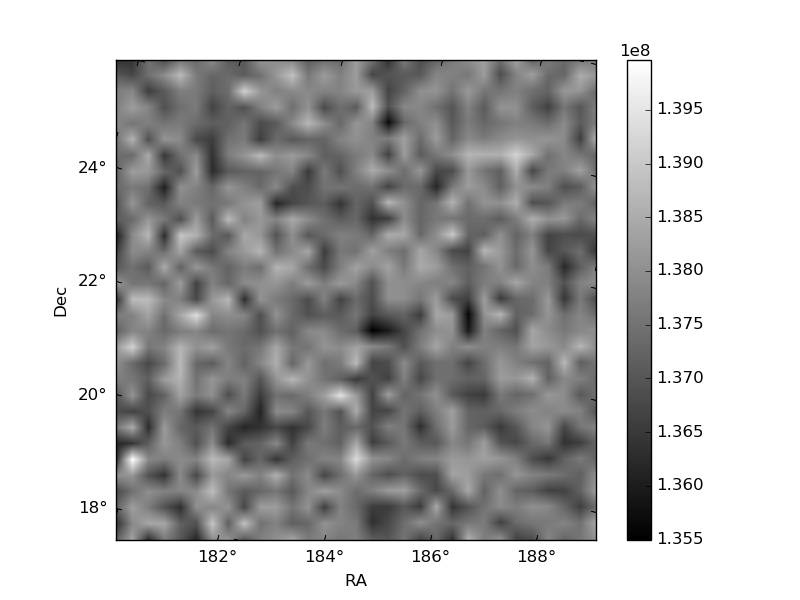
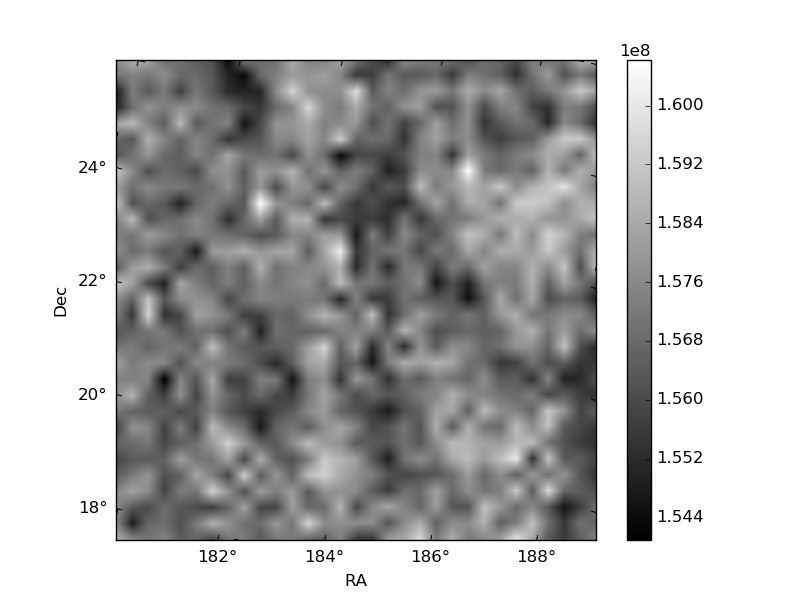
Histogram calculated using DETX and DETY for each event in the final _common_clean file
| Quadrant A | 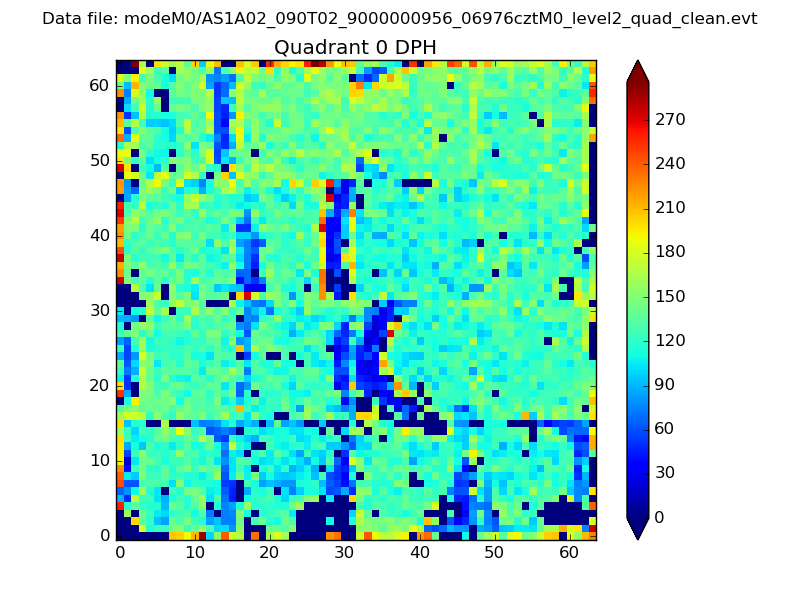 |
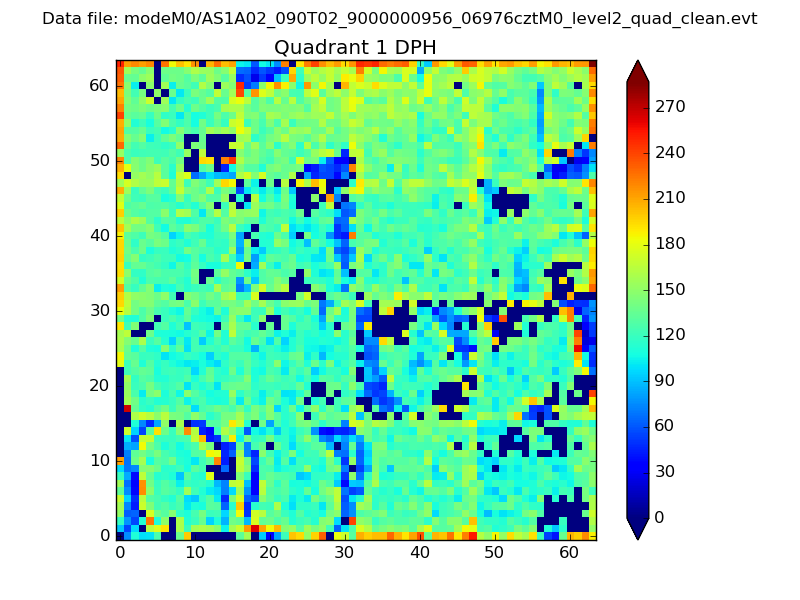 |
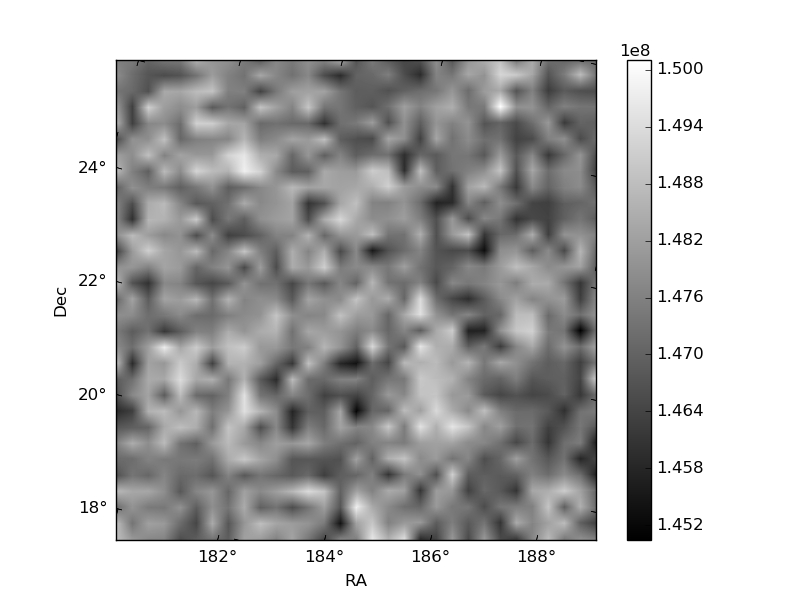
Quadrant B |
|---|---|---|---|
| Quadrant D | 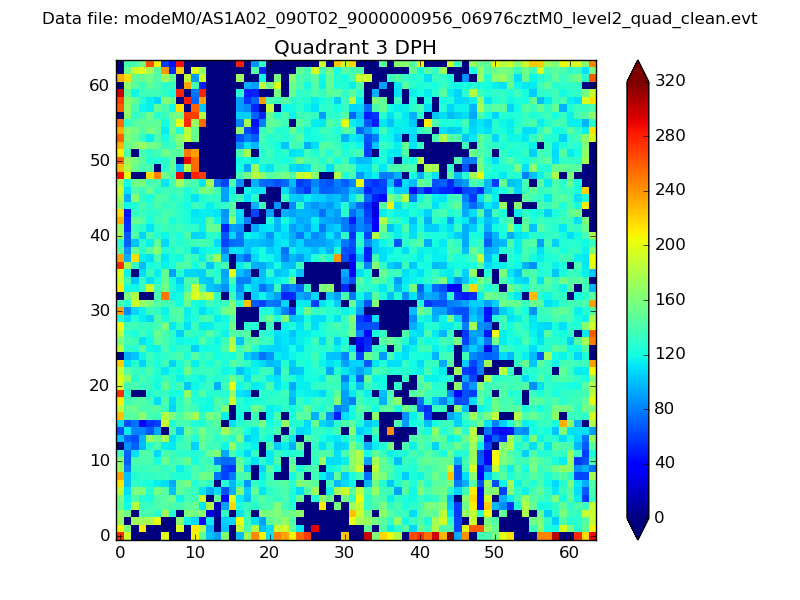 |
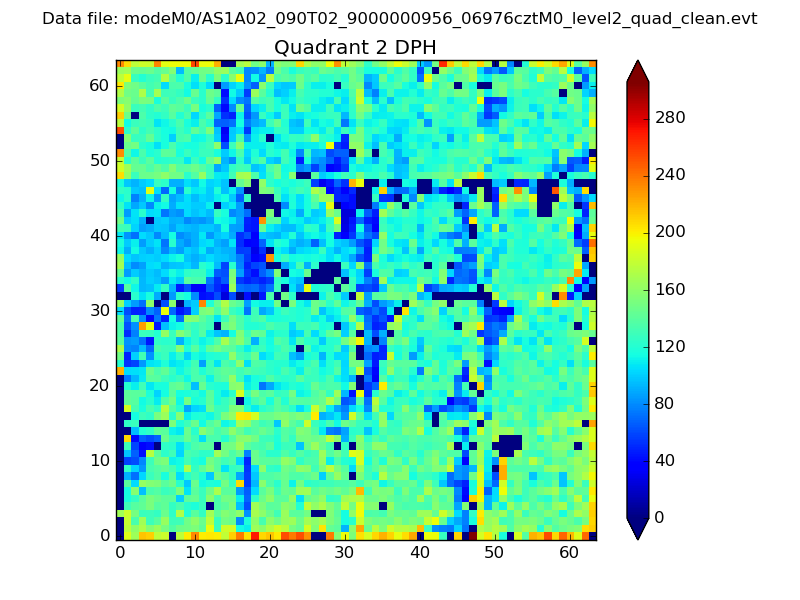 |
Quadrant C |
| Plot type | Count rate plots | Images |
|---|---|---|
| Comparison with Poisson distribution Blue bars denote a histogram of data divided into 1 sec bins. Red curve is a Poisson curve with rate = median count rate of data. |
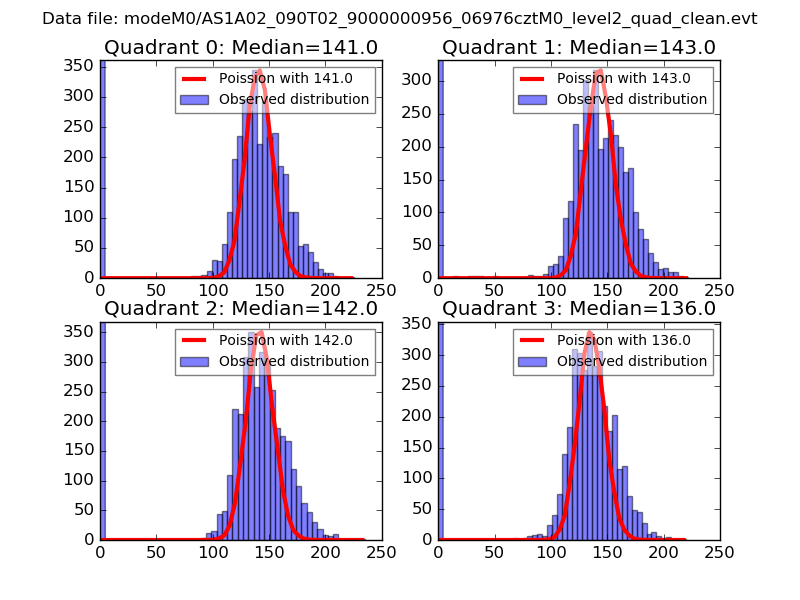 |
 |
| Quadrant-wise count rates Data is divided into 100 sec bins |
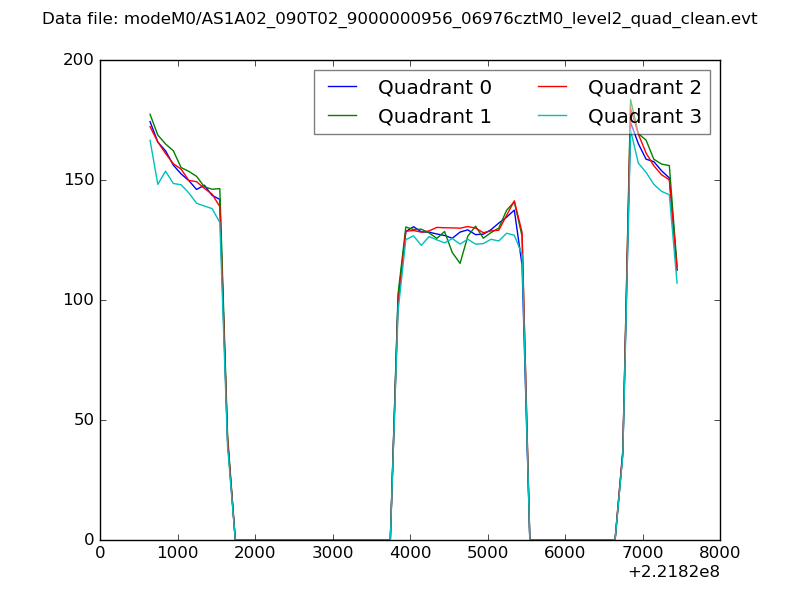 |
|
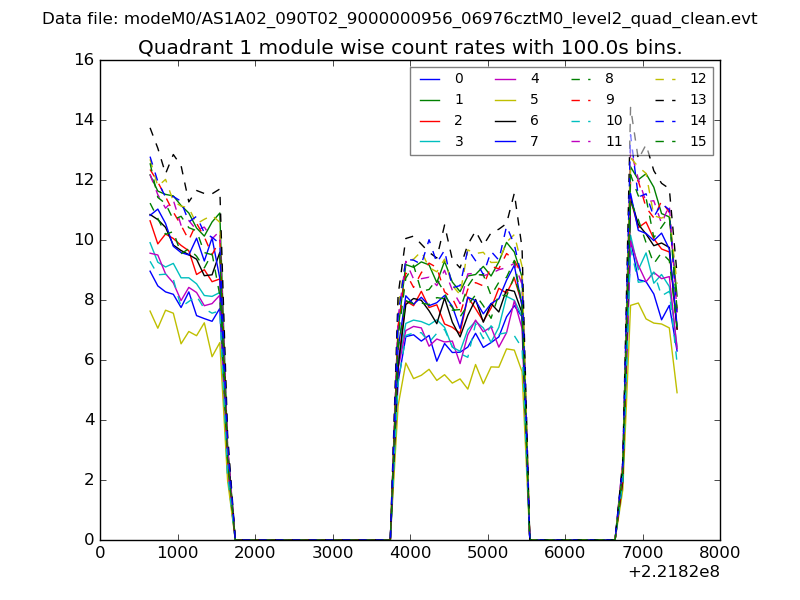
| Module-wise count rates for Quadrant A Data is divided into 100 sec bins |
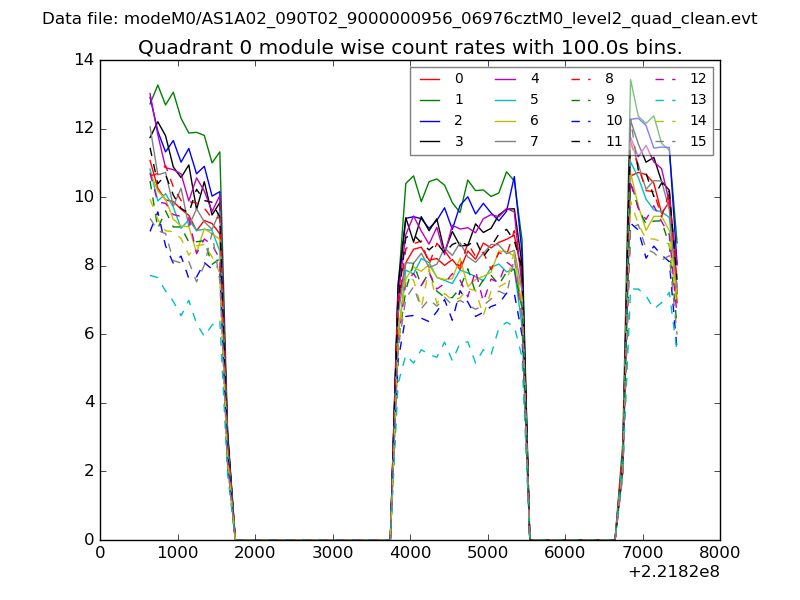 |
 |
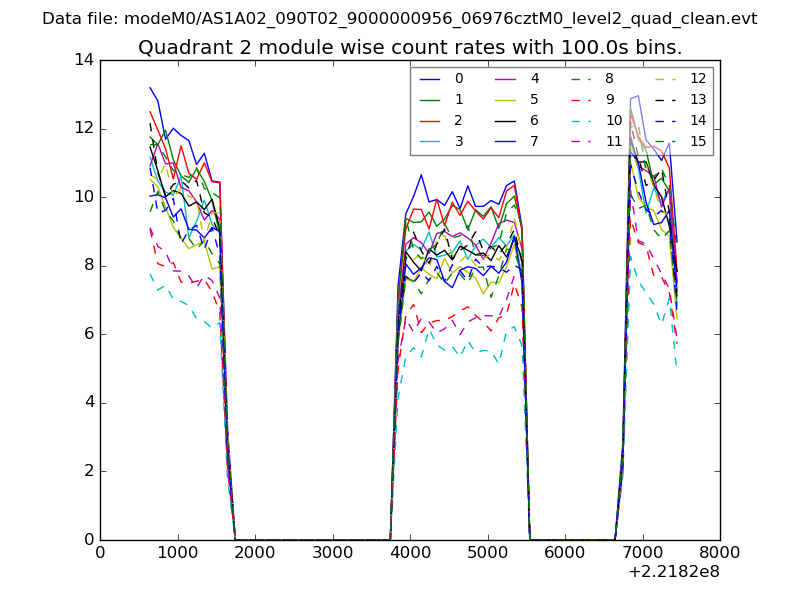
| Module-wise count rates for Quadrant B Data is divided into 100 sec bins |
 |
 |
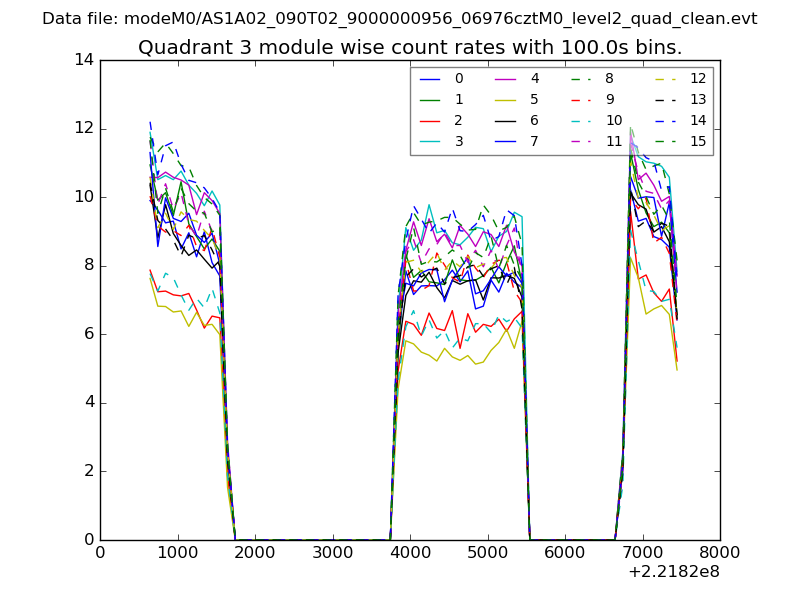
| Module-wise count rates for Quadrant C Data is divided into 100 sec bins |
 |
 |
| Module-wise count rates for Quadrant D Data is divided into 100 sec bins |
 |
 |
| Parameter | Plot |
|---|---|
| CZT HV Monitor | 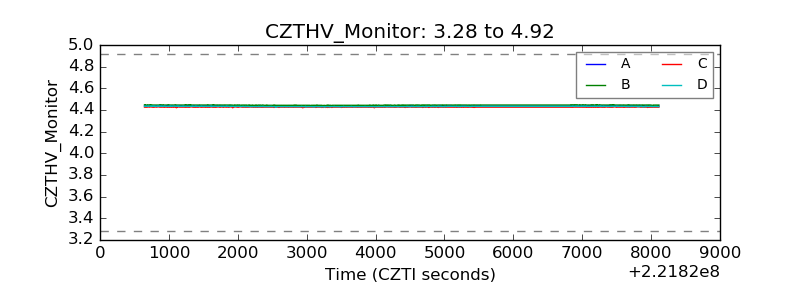 |
| D_VDD | 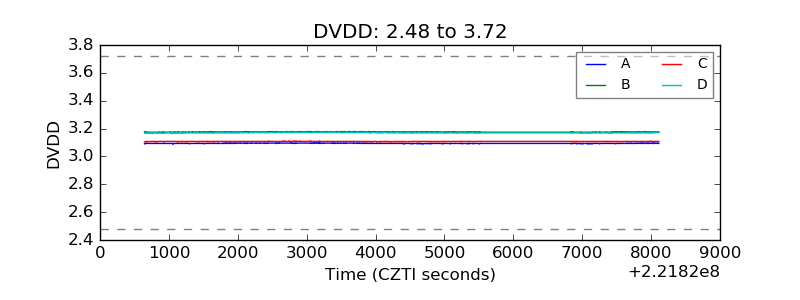 |
| Temperature 1 | 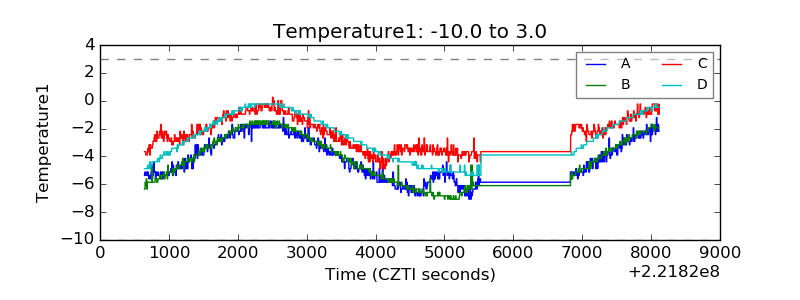 |
| Veto HV Monitor | 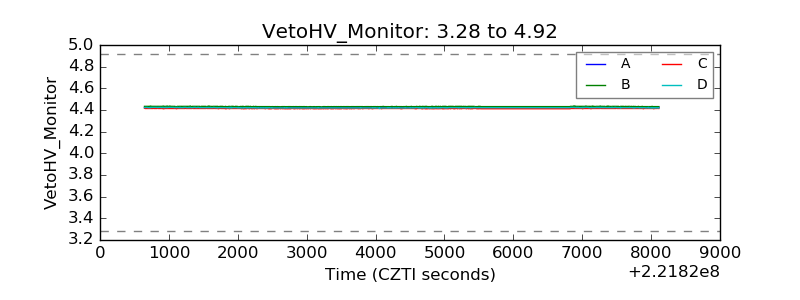 |
| Veto LLD | 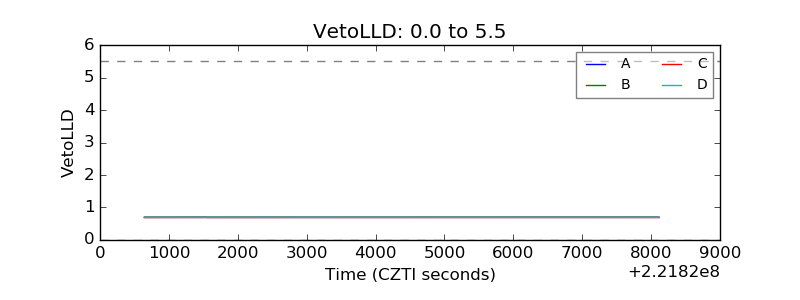 |
| Alpha Counter | 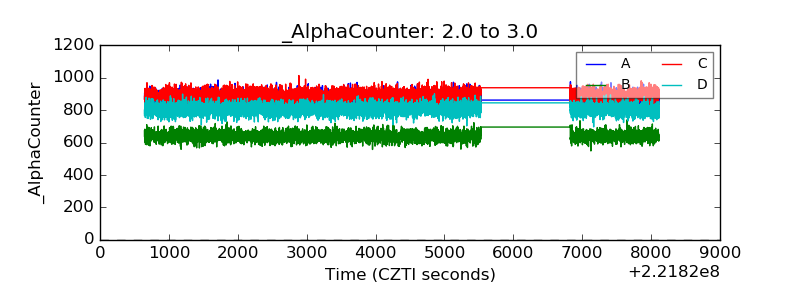 |
| _CPM_Rate | 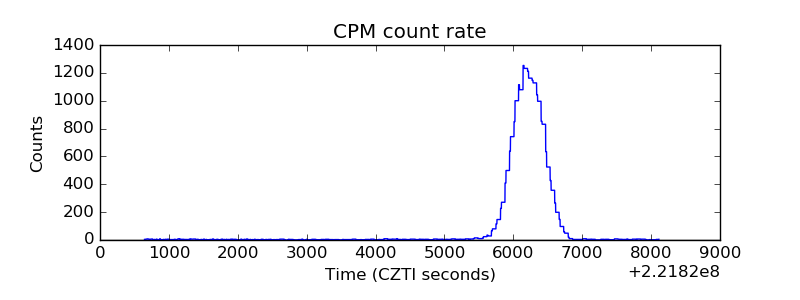 |
| CZT Counter | 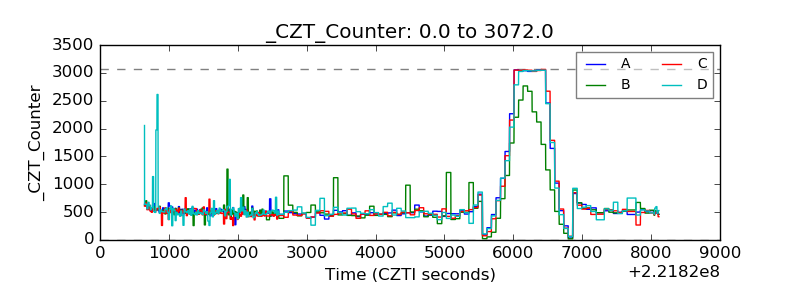 |
| +2.5 Volts monitor |  |
| +5 Volts monitor |  |
| _ROLL_ROT | 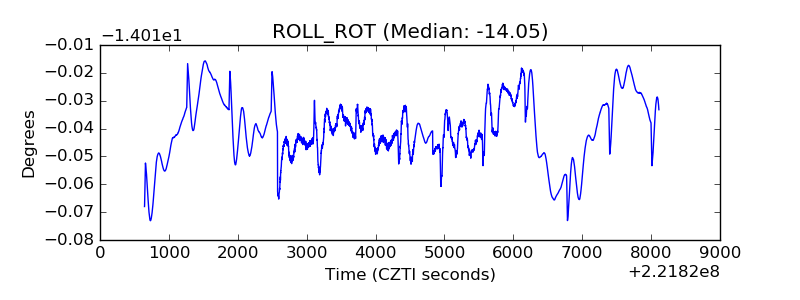 |
| _Roll_DEC | 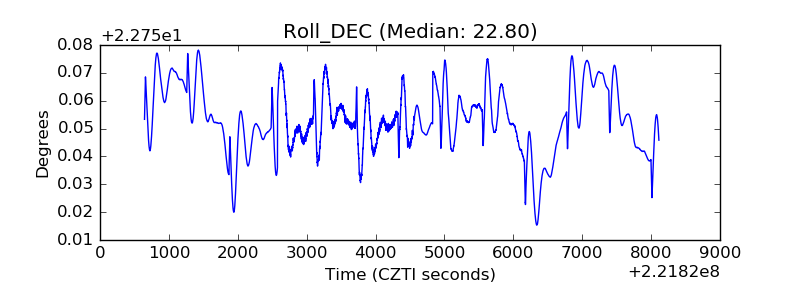 |
| _Roll_RA | 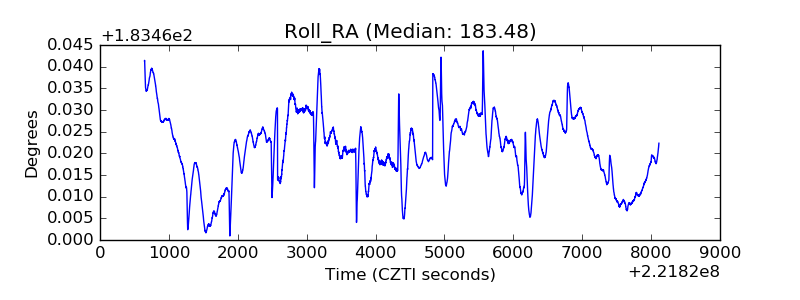 |
| Veto Counter | 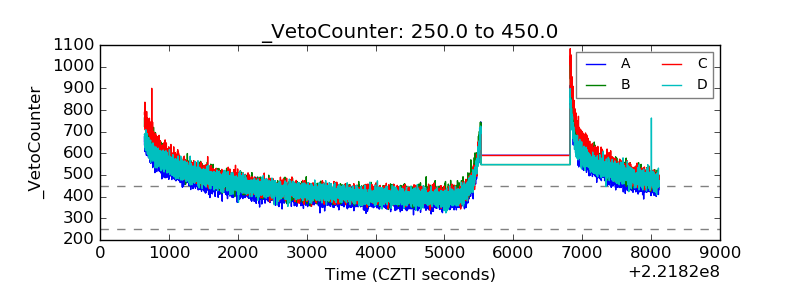 |