| Param | Original file | Final file |
|---|---|---|
| Filename | modeM0/AS1A02_090T02_9000000956_06977cztM0_level2.evt | modeM0/AS1A02_090T02_9000000956_06977cztM0_level2_quad_clean.evt |
| Size (bytes) | 433,163,520 | 65,289,600 |
| Size | 413.1 MB | 62.3 MB |
| Events in quadrant A | 3,098,841 | 386,658 |
| Events in quadrant B | 3,431,175 | 390,522 |
| Events in quadrant C | 3,030,934 | 388,019 |
| Events in quadrant D | 3,132,187 | 374,965 |
| Mode M0 | |||
|---|---|---|---|
| Quadrant | BADHDUFLAG | Total packets | Discarded packets |
| A | 0 | 13128 | 156 |
| B | 0 | 14146 | 194 |
| C | 0 | 12989 | 158 |
| D | 0 | 13226 | 157 |
| Mode SS | |||
|---|---|---|---|
| Quadrant | BADHDUFLAG | Total packets | Discarded packets |
| A | 0 | 130 | 2 |
| B | 0 | 130 | 2 |
| C | 0 | 130 | 2 |
| D | 0 | 130 | 2 |
| Mode M9 | |||
|---|---|---|---|
| Quadrant | BADHDUFLAG | Total packets | Discarded packets |
| A | 0 | 12 | 0 |
| B | 0 | 12 | 0 |
| C | 0 | 12 | 0 |
| D | 0 | 12 | 0 |
| Quadrant | Total seconds | Saturated seconds | Saturation percentage |
|---|---|---|---|
| A | 6254 | 90 | 1.439079% |
| B | 6251 | 120 | 1.919693% |
| C | 6248 | 59 | 0.944302% |
| D | 6252 | 71 | 1.135637% |
Noise dominated data is calculated using 1-second bins in cleaned event files. If a bin has >2000 counts, and if more than 50% of those come from <1% of pixels, then it is considered to be noise-dominated and hence unusable.
| Quadrant | # 1 sec bins | Bins with >0 counts | Bins with >2000 counts | High rate bins dominated by noise | Noise dominated (total time) | Noise dominated (detector-on time) | Marked lightcurve |
|---|---|---|---|---|---|---|---|
| A | 7565 | 6270 | 0 | 0 | 0.00% | 0.00% | 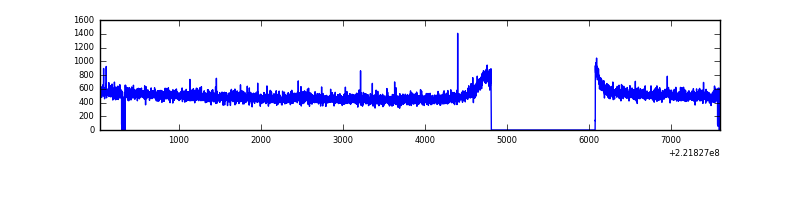 |
| B | 7562 | 6266 | 19 | 19 | 0.25% | 0.30% | 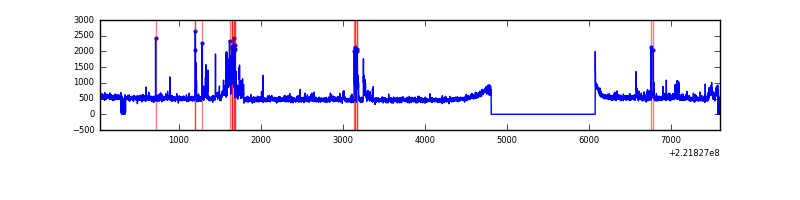 |
| C | 7561 | 6260 | 0 | 0 | 0.00% | 0.00% | 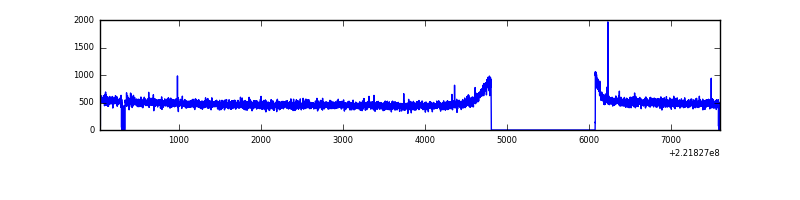 |
| D | 7559 | 6262 | 3 | 3 | 0.04% | 0.05% | 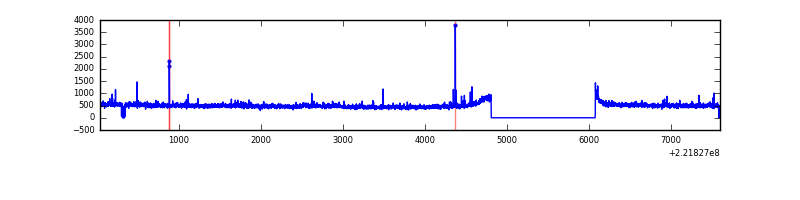 |
Top three noisy pixels from each quadrant. If the there are fewer than three noisy pixels in the level2.evt file, extra rows are filled as -1
| Pixel properties | Quadrant properties | ||||||
|---|---|---|---|---|---|---|---|
| Quadrant | DetID | PixID | Counts | Sigma | Mean | Median | Sigma |
| A | 0 | 23 | 10350 | 59.12 | 799 | 783 | 161.8 |
| A | 0 | 226 | 8558 | 48.05 | 799 | 783 | 161.8 |
| A | 12 | 194 | 7492 | 41.46 | 799 | 783 | 161.8 |
| B | 0 | 228 | 292936 | 1942.04 | 793 | 775 | 150.4 |
| B | 0 | 214 | 30954 | 200.6 | 793 | 775 | 150.4 |
| B | 12 | 111 | 14668 | 92.35 | 793 | 775 | 150.4 |
| C | 13 | 61 | 6292 | 30.87 | 775 | 778 | 178.6 |
| C | 1 | 0 | 4498 | 20.83 | 775 | 778 | 178.6 |
| C | 1 | 16 | 4239 | 19.38 | 775 | 778 | 178.6 |
| D | 8 | 195 | 112940 | 585.76 | 782 | 758 | 191.5 |
| D | 2 | 14 | 26900 | 136.5 | 782 | 758 | 191.5 |
| D | 12 | 221 | 18289 | 91.54 | 782 | 758 | 191.5 |
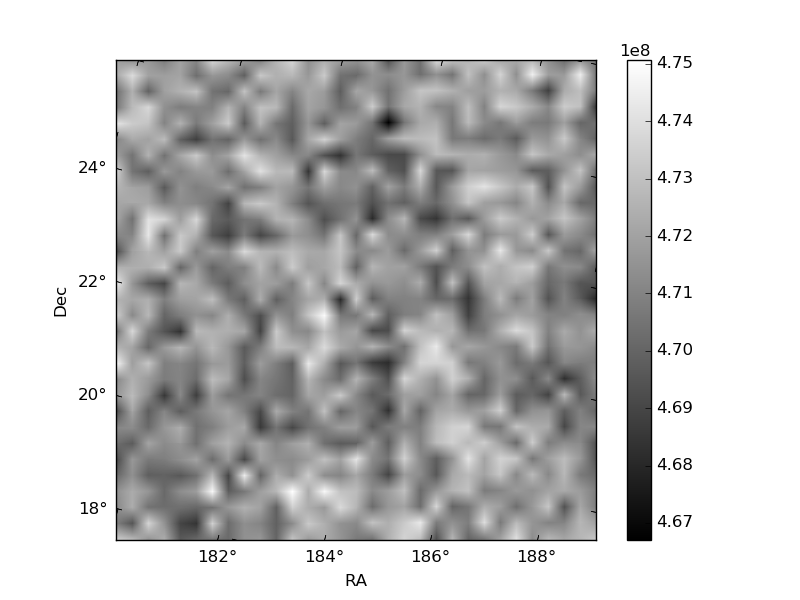
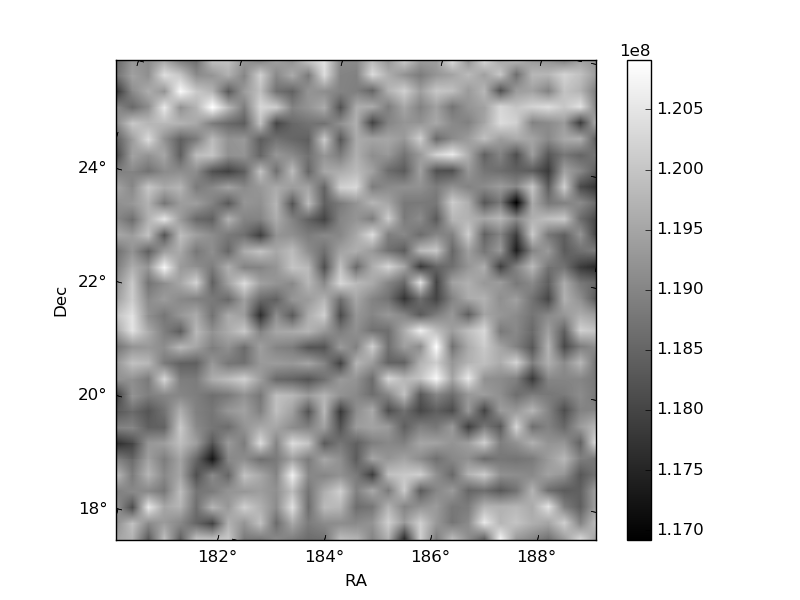
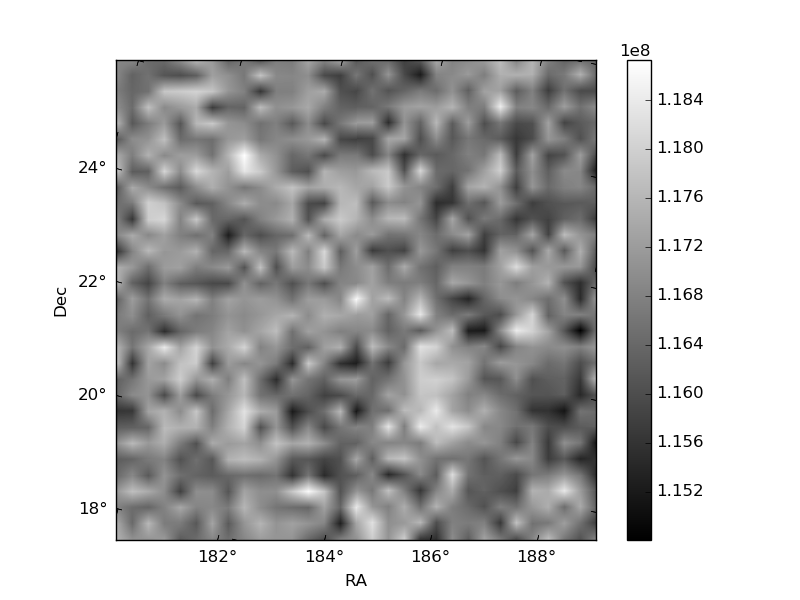
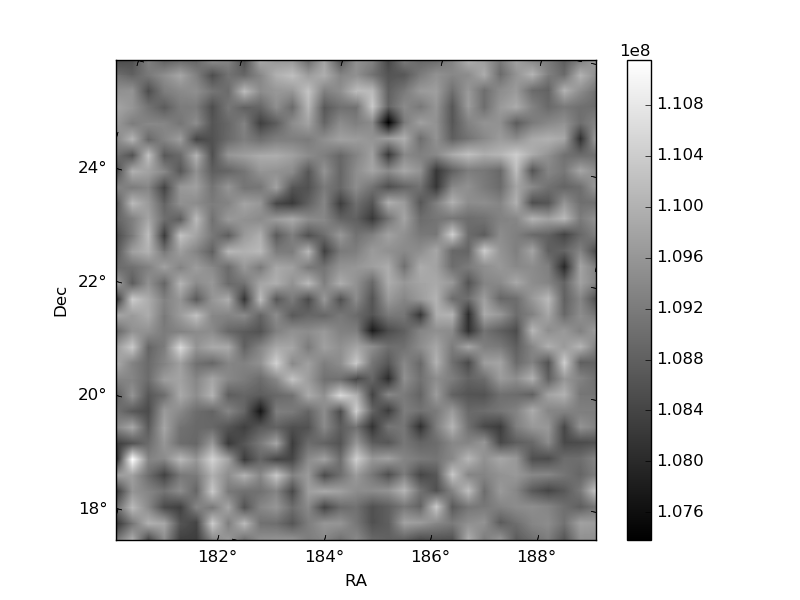
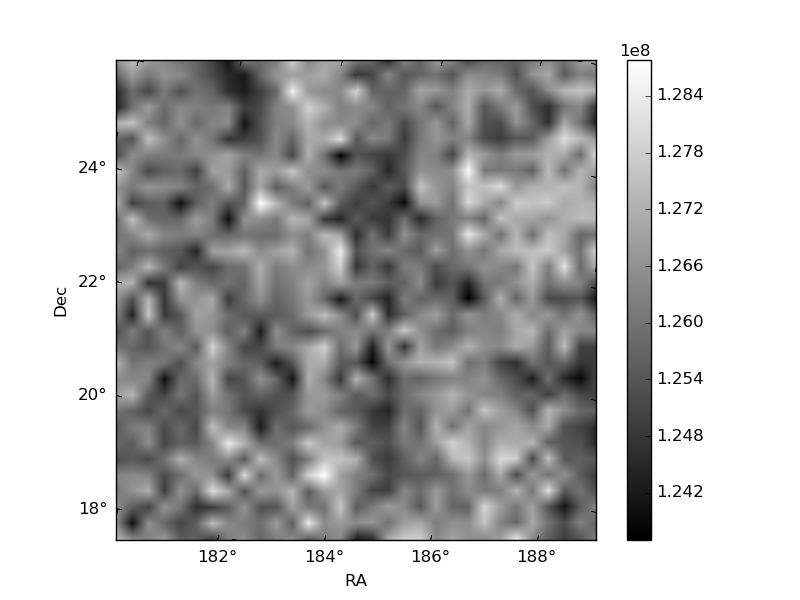
Histogram calculated using DETX and DETY for each event in the final _common_clean file
| Quadrant A | 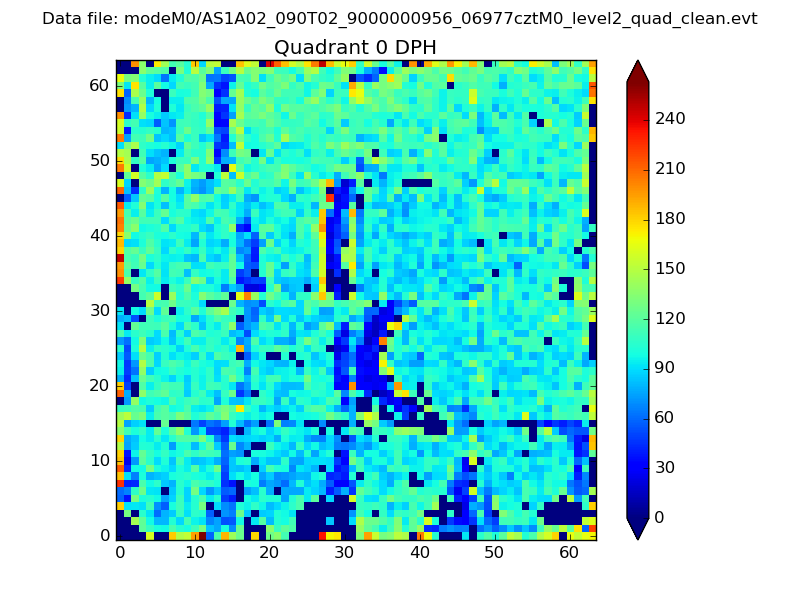 |
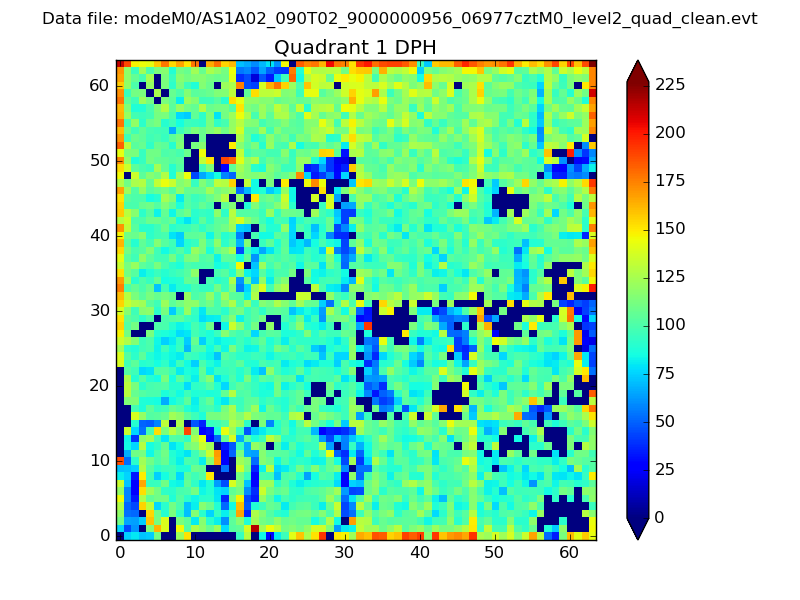 |
Quadrant B |
|---|---|---|---|
| Quadrant D | 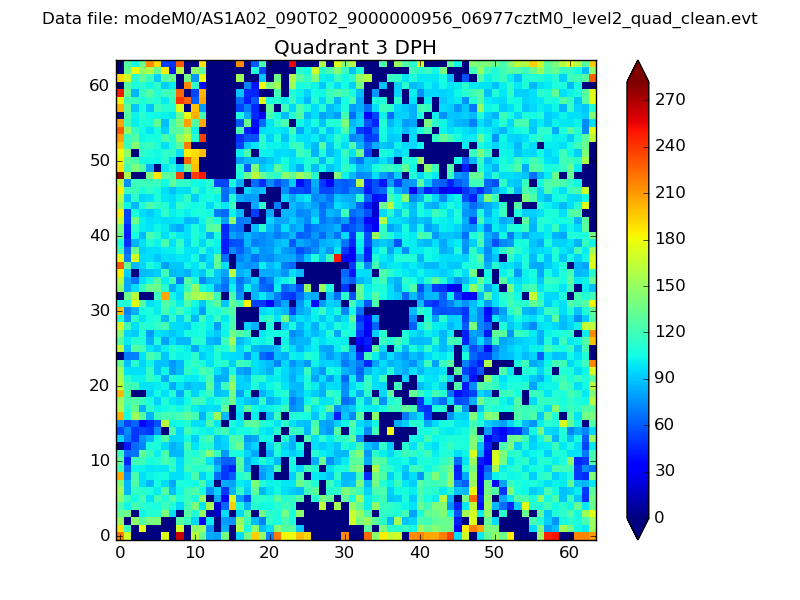 |
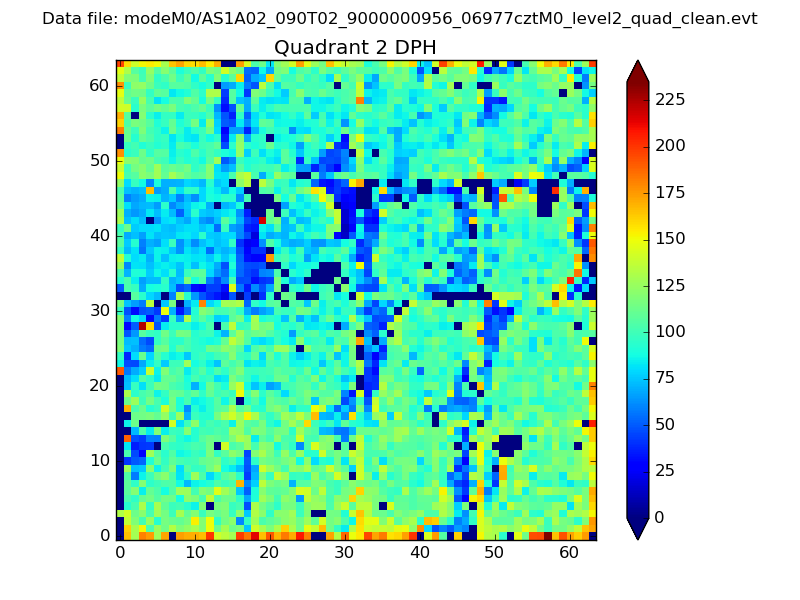 |
Quadrant C |
| Plot type | Count rate plots | Images |
|---|---|---|
| Comparison with Poisson distribution Blue bars denote a histogram of data divided into 1 sec bins. Red curve is a Poisson curve with rate = median count rate of data. |
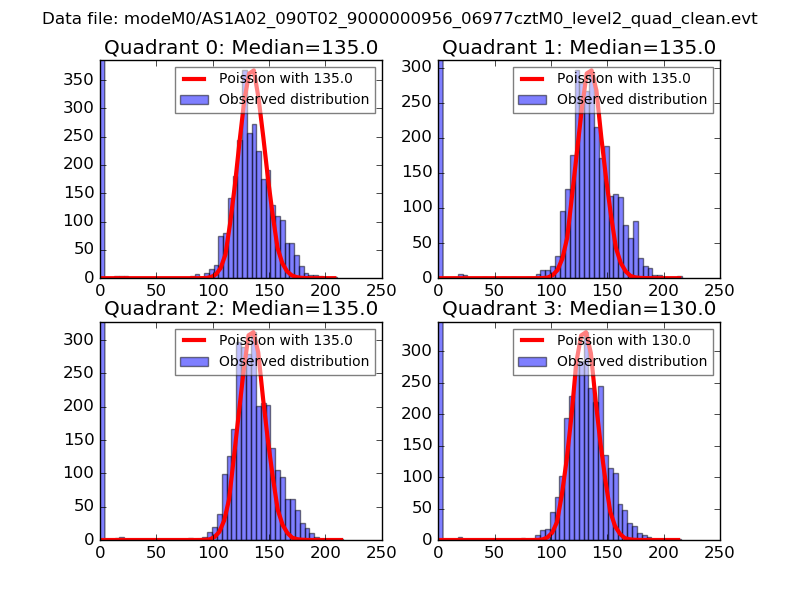 |
 |
| Quadrant-wise count rates Data is divided into 100 sec bins |
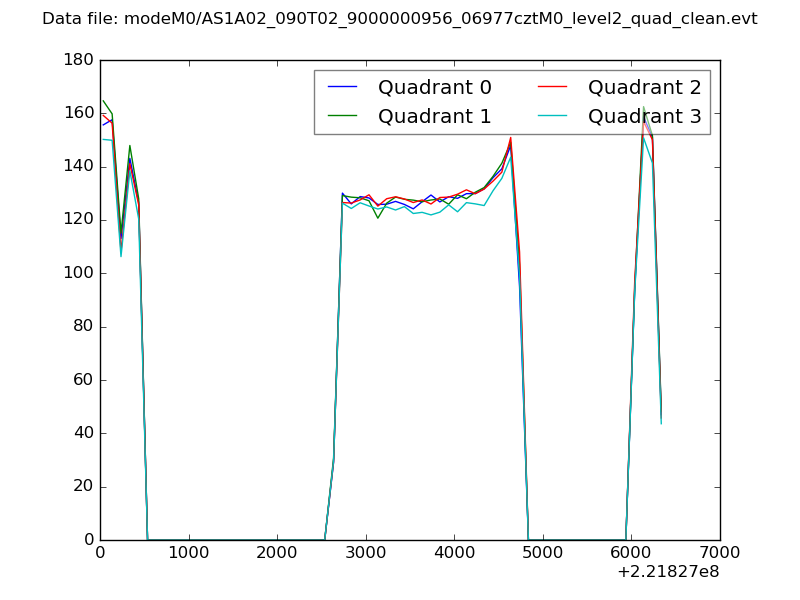 |
|
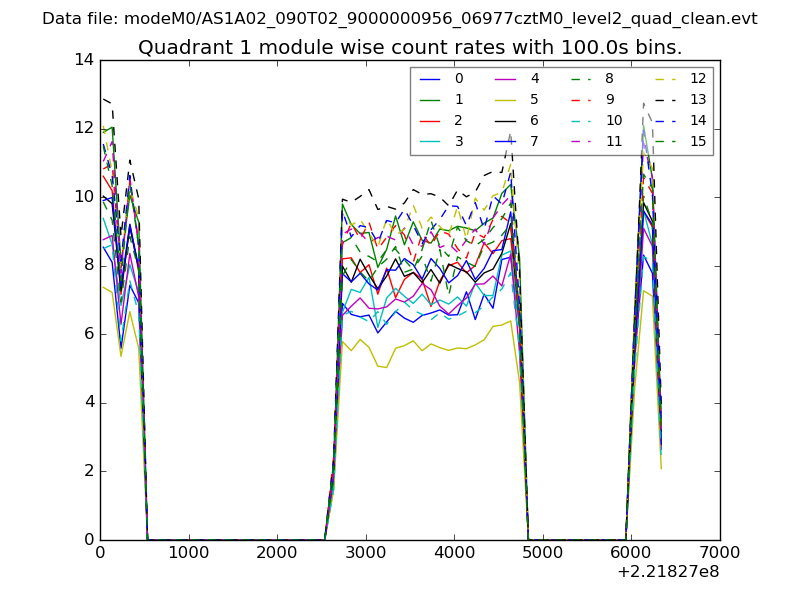
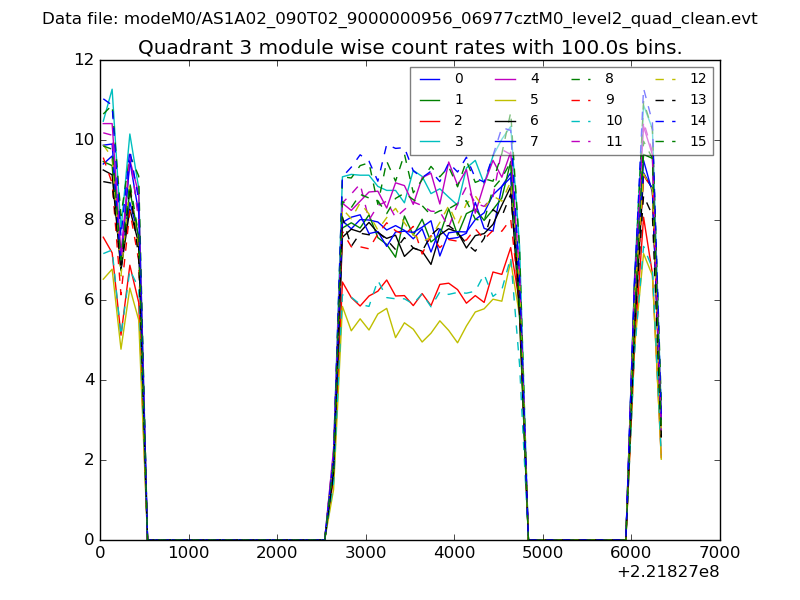
| Module-wise count rates for Quadrant A Data is divided into 100 sec bins |
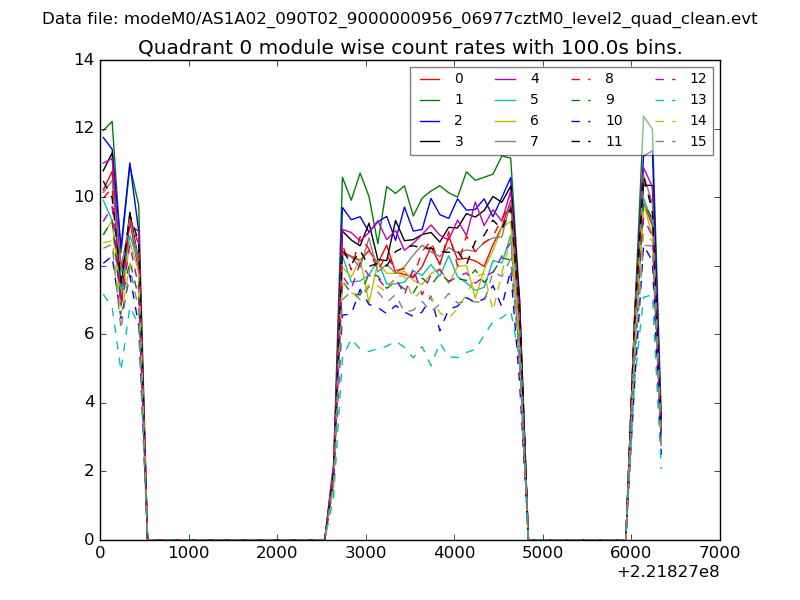 |
 |
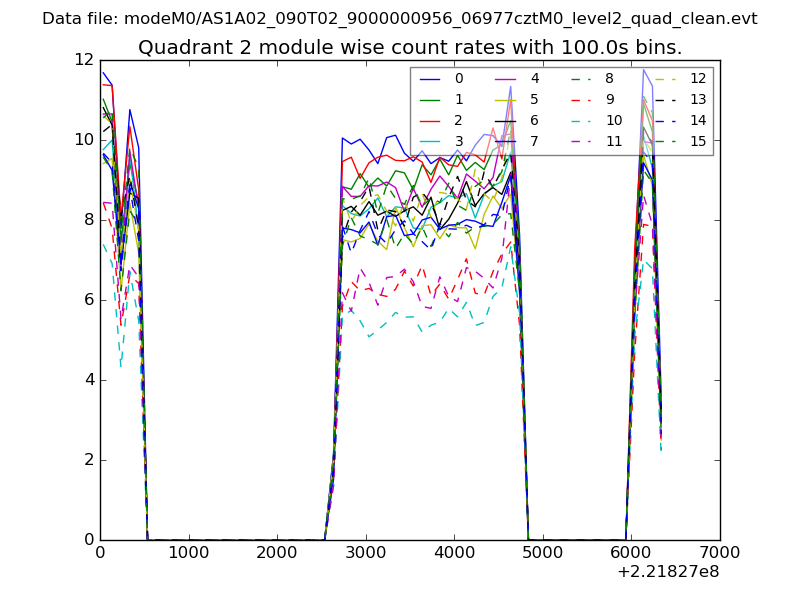
| Module-wise count rates for Quadrant B Data is divided into 100 sec bins |
 |
 |
| Module-wise count rates for Quadrant C Data is divided into 100 sec bins |
 |
 |
| Module-wise count rates for Quadrant D Data is divided into 100 sec bins |
 |
 |
| Parameter | Plot |
|---|---|
| CZT HV Monitor | 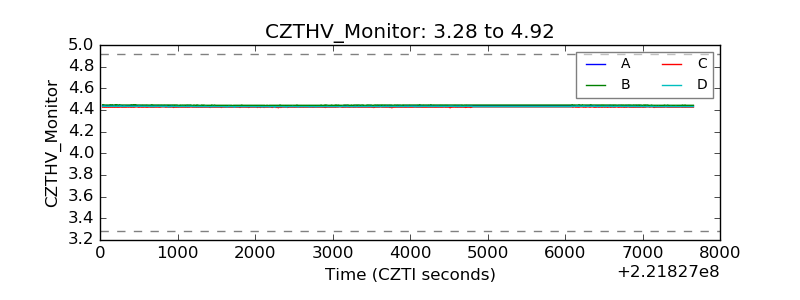 |
| D_VDD | 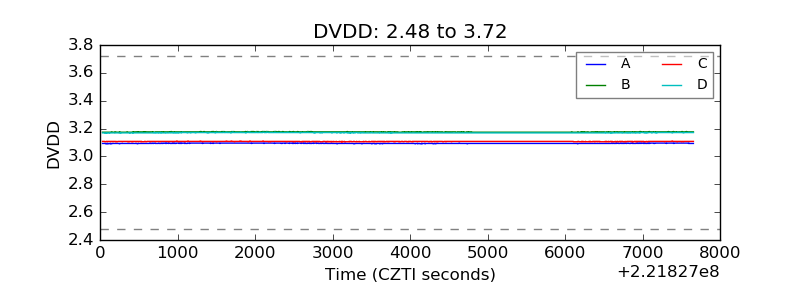 |
| Temperature 1 | 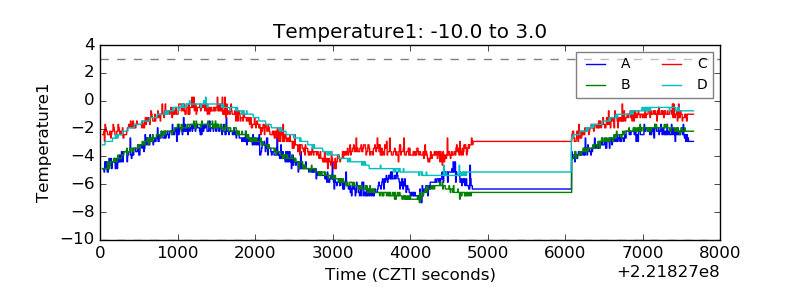 |
| Veto HV Monitor | 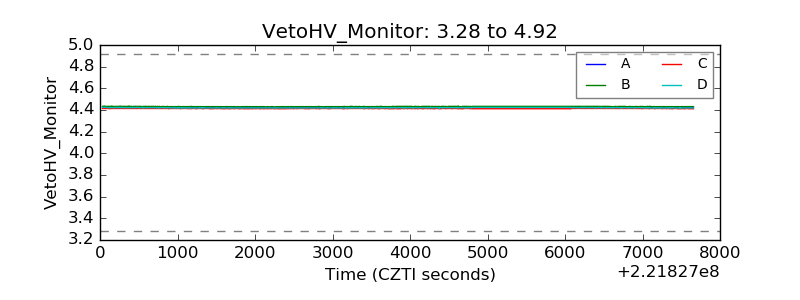 |
| Veto LLD | 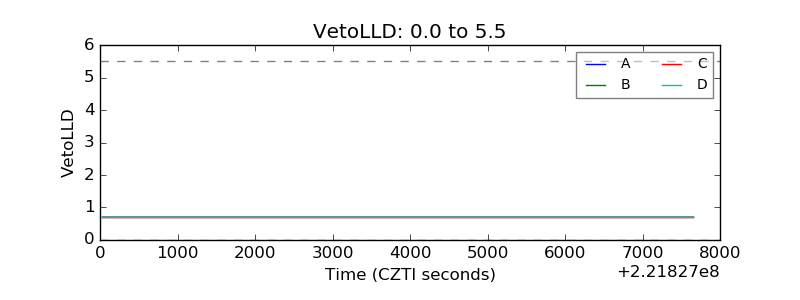 |
| Alpha Counter | 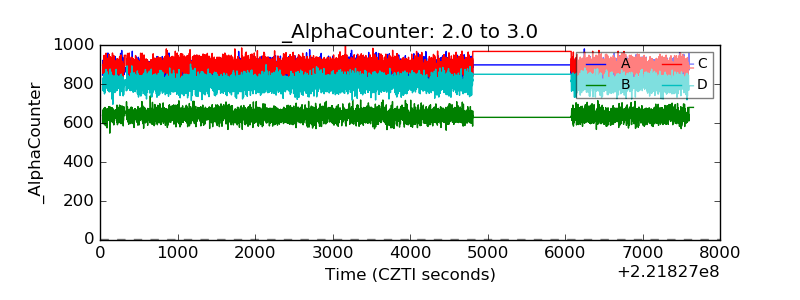 |
| _CPM_Rate | 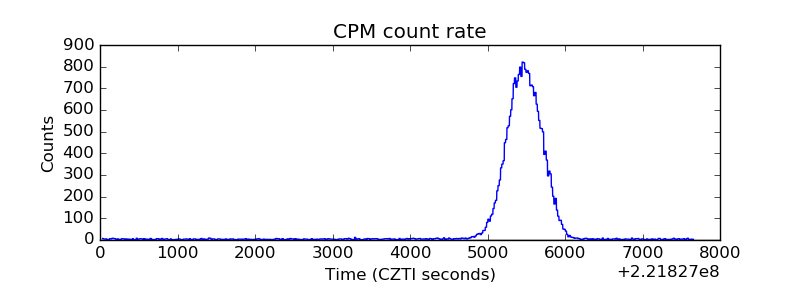 |
| CZT Counter | 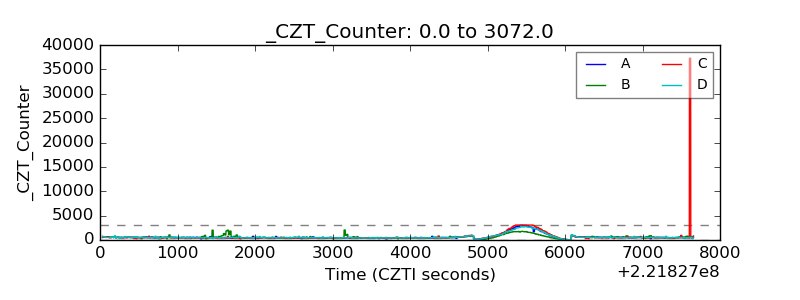 |
| +2.5 Volts monitor |  |
| +5 Volts monitor | 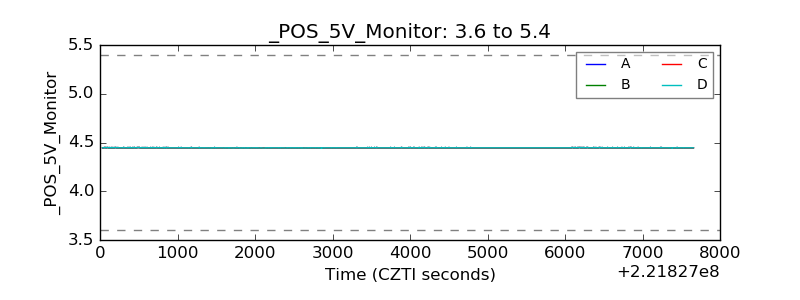 |
| _ROLL_ROT | 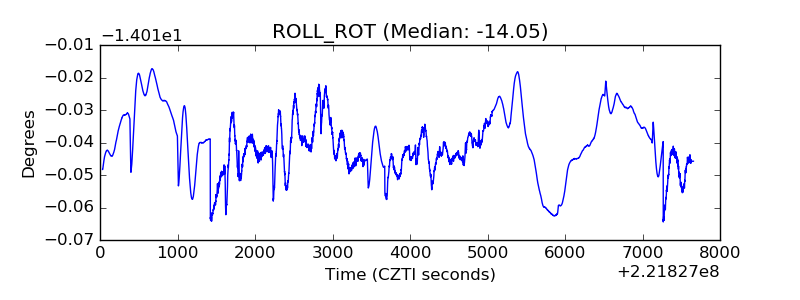 |
| _Roll_DEC | 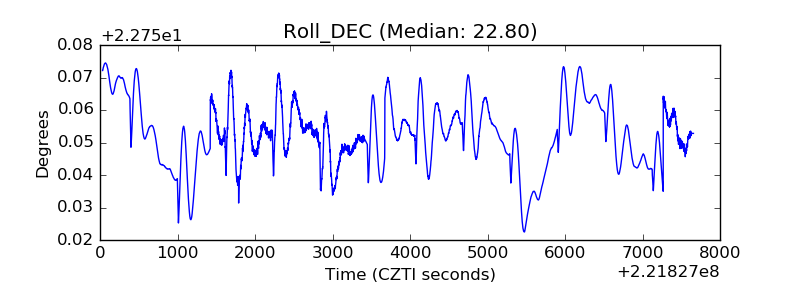 |
| _Roll_RA | 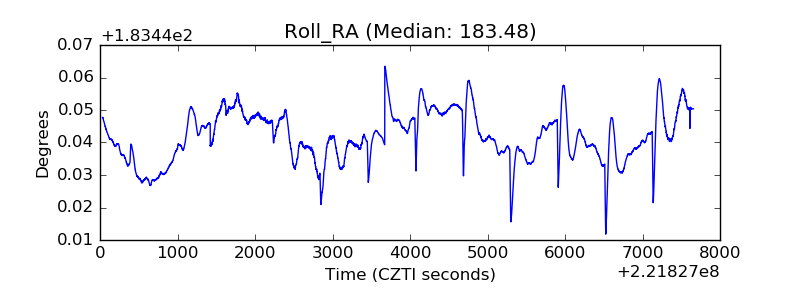 |
| Veto Counter | 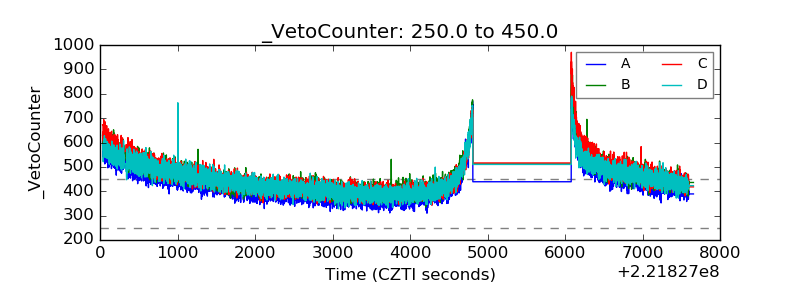 |