| Param | Original file | Final file |
|---|---|---|
| Filename | modeM0/AS1A02_090T02_9000000956_06980cztM0_level2.evt | modeM0/AS1A02_090T02_9000000956_06980cztM0_level2_quad_clean.evt |
| Size (bytes) | 760,276,800 | 136,825,920 |
| Size | 725.1 MB | 130.5 MB |
| Events in quadrant A | 5,431,616 | 836,673 |
| Events in quadrant B | 5,629,283 | 843,279 |
| Events in quadrant C | 5,285,403 | 842,675 |
| Events in quadrant D | 5,889,628 | 816,006 |
| Mode M0 | |||
|---|---|---|---|
| Quadrant | BADHDUFLAG | Total packets | Discarded packets |
| A | 0 | 24784 | 576 |
| B | 0 | 25197 | 597 |
| C | 0 | 24504 | 583 |
| D | 0 | 25702 | 578 |
| Mode SS | |||
|---|---|---|---|
| Quadrant | BADHDUFLAG | Total packets | Discarded packets |
| A | 0 | 242 | 4 |
| B | 0 | 242 | 6 |
| C | 0 | 242 | 4 |
| D | 0 | 242 | 6 |
| Mode M9 | |||
|---|---|---|---|
| Quadrant | BADHDUFLAG | Total packets | Discarded packets |
| A | 0 | 12 | 0 |
| B | 0 | 12 | 0 |
| C | 0 | 12 | 0 |
| D | 0 | 12 | 0 |
| Quadrant | Total seconds | Saturated seconds | Saturation percentage |
|---|---|---|---|
| A | 11646 | 137 | 1.176370% |
| B | 11634 | 192 | 1.650335% |
| C | 11635 | 117 | 1.005587% |
| D | 11641 | 146 | 1.254188% |
Noise dominated data is calculated using 1-second bins in cleaned event files. If a bin has >2000 counts, and if more than 50% of those come from <1% of pixels, then it is considered to be noise-dominated and hence unusable.
| Quadrant | # 1 sec bins | Bins with >0 counts | Bins with >2000 counts | High rate bins dominated by noise | Noise dominated (total time) | Noise dominated (detector-on time) | Marked lightcurve |
|---|---|---|---|---|---|---|---|
| A | 13100 | 11679 | 4 | 4 | 0.03% | 0.03% | 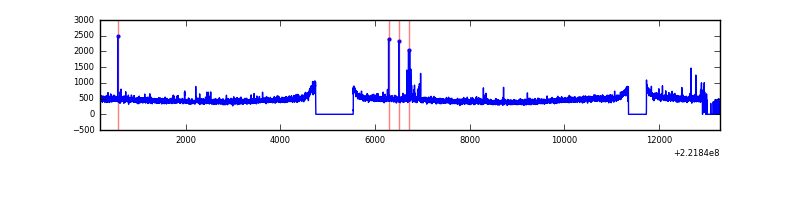 |
| B | 13102 | 11664 | 22 | 22 | 0.17% | 0.19% | 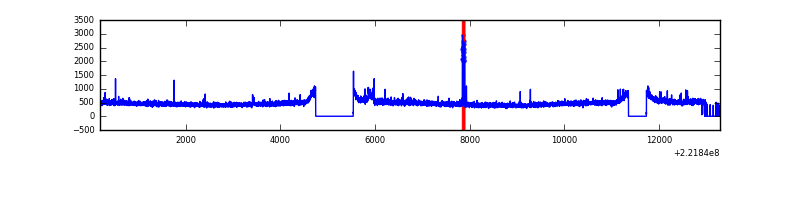 |
| C | 13087 | 11664 | 0 | 0 | 0.00% | 0.00% | 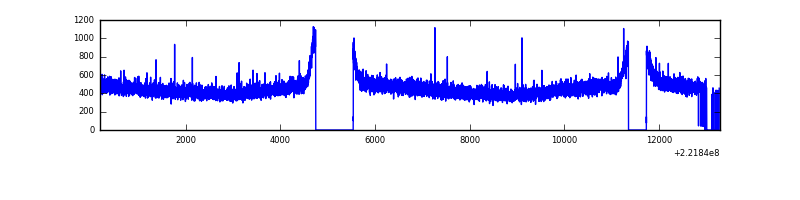 |
| D | 13102 | 11668 | 16 | 16 | 0.12% | 0.14% | 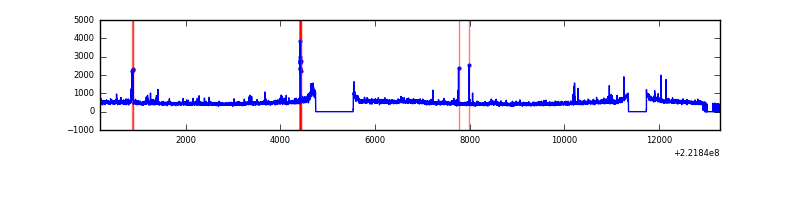 |
Top three noisy pixels from each quadrant. If the there are fewer than three noisy pixels in the level2.evt file, extra rows are filled as -1
| Pixel properties | Quadrant properties | ||||||
|---|---|---|---|---|---|---|---|
| Quadrant | DetID | PixID | Counts | Sigma | Mean | Median | Sigma |
| A | 14 | 239 | 69458 | 241.54 | 1380 | 1347 | 282.0 |
| A | 13 | 248 | 14119 | 45.29 | 1380 | 1347 | 282.0 |
| A | 0 | 226 | 13881 | 44.45 | 1380 | 1347 | 282.0 |
| B | 0 | 228 | 164772 | 613.55 | 1387 | 1350 | 266.4 |
| B | 12 | 111 | 26237 | 93.44 | 1387 | 1350 | 266.4 |
| B | 11 | 111 | 21014 | 73.83 | 1387 | 1350 | 266.4 |
| C | 13 | 61 | 10745 | 29.79 | 1350 | 1354 | 315.2 |
| C | 1 | 16 | 9550 | 26.0 | 1350 | 1354 | 315.2 |
| C | 12 | 4 | 4186 | 8.98 | 1350 | 1354 | 315.2 |
| D | 8 | 195 | 544064 | 1633.0 | 1351 | 1308 | 332.4 |
| D | 12 | 233 | 76048 | 224.87 | 1351 | 1308 | 332.4 |
| D | 2 | 14 | 46266 | 135.27 | 1351 | 1308 | 332.4 |
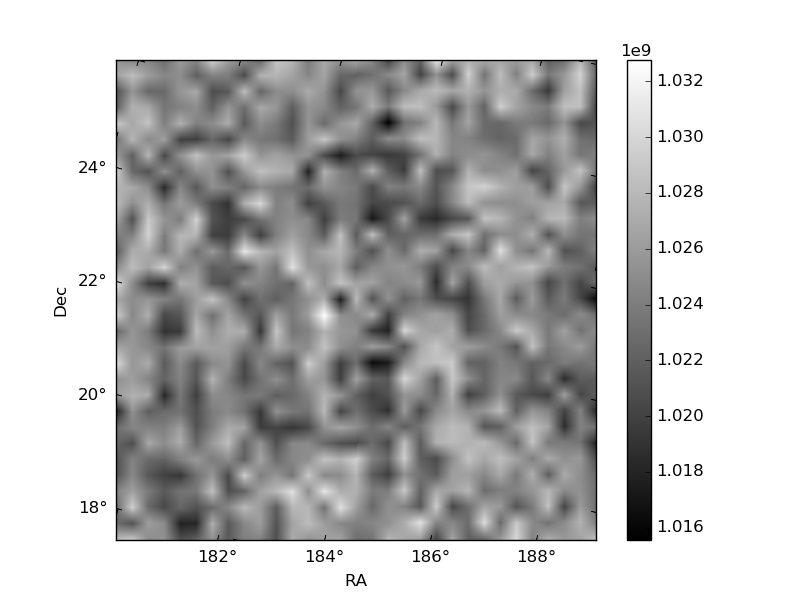
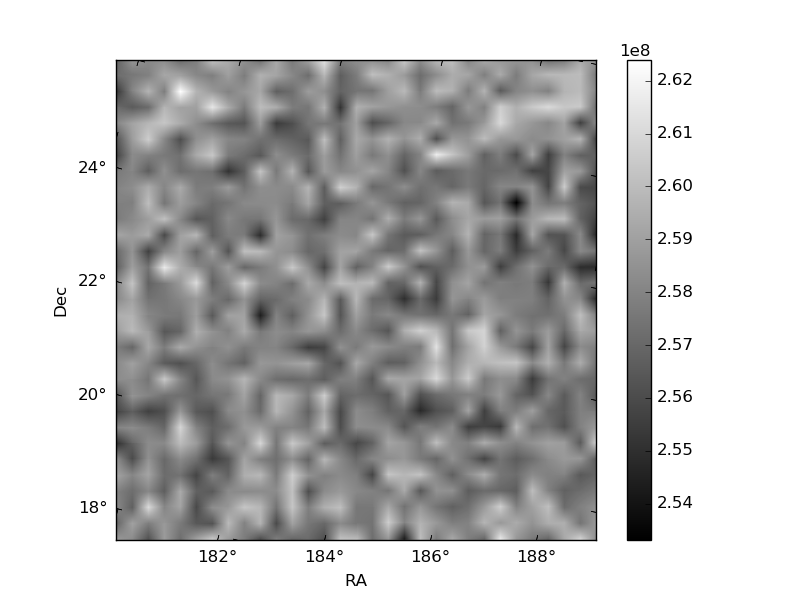
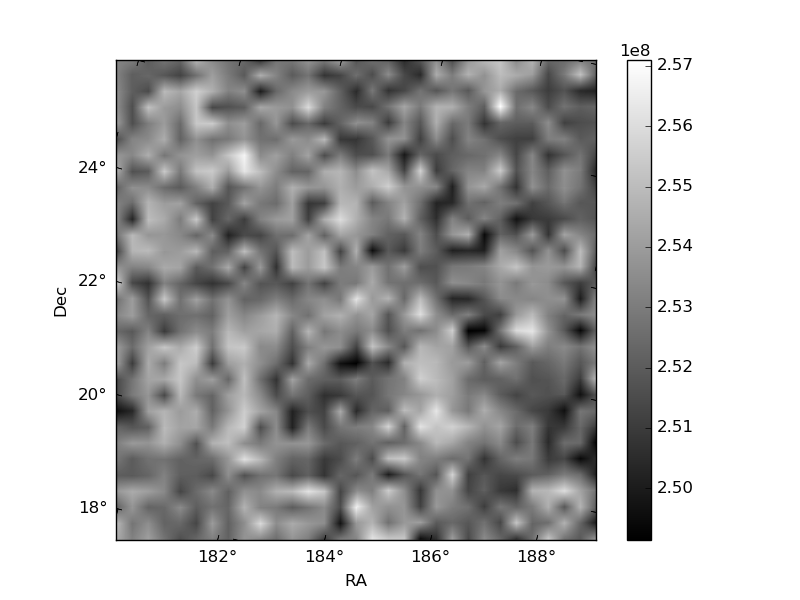
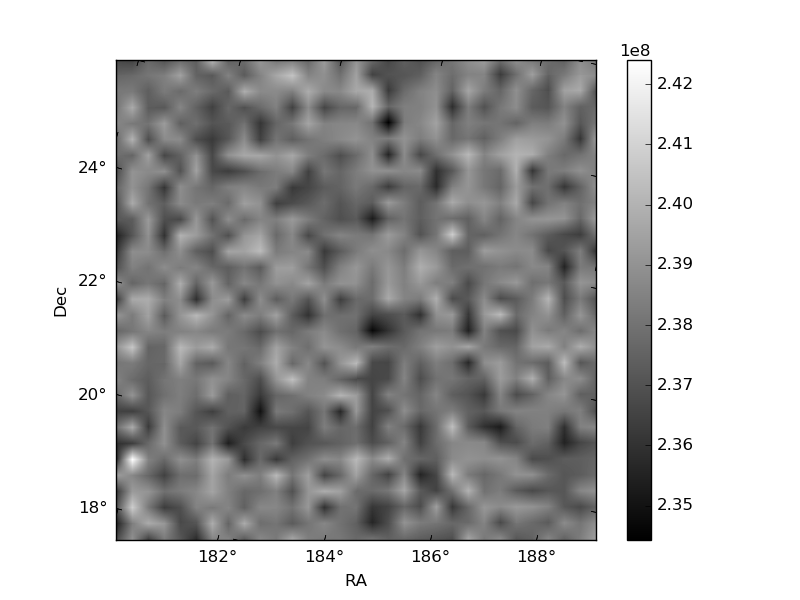
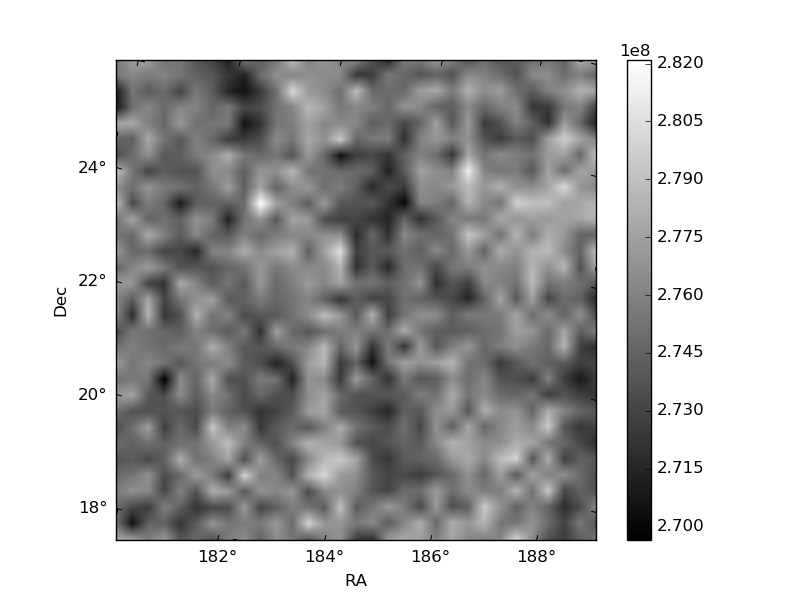
Histogram calculated using DETX and DETY for each event in the final _common_clean file
| Quadrant A | 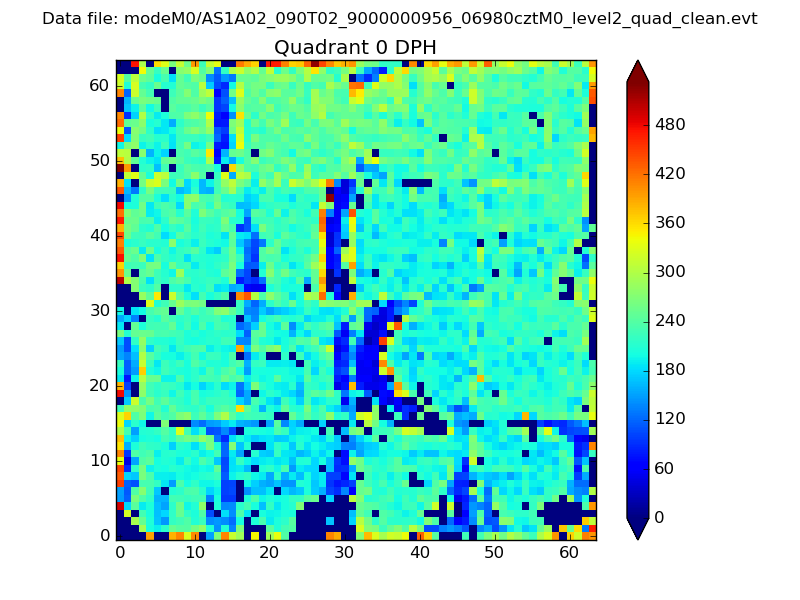 |
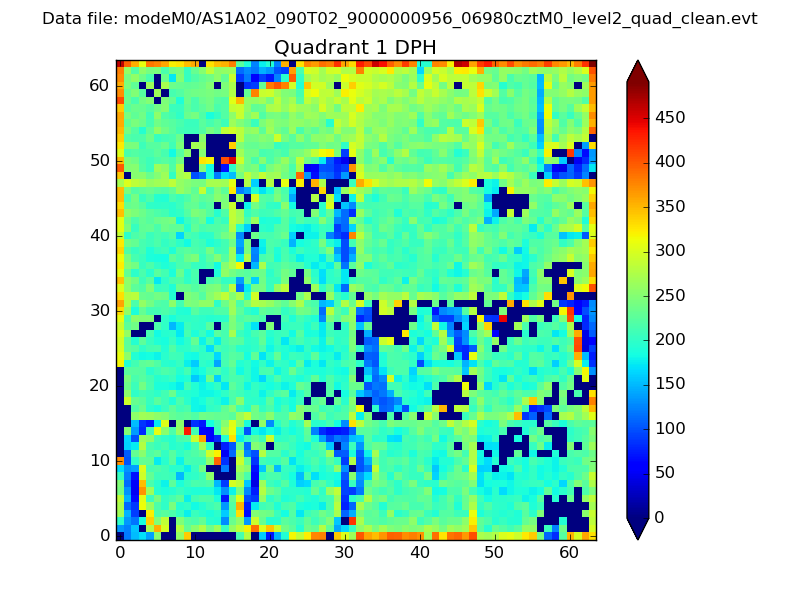 |
Quadrant B |
|---|---|---|---|
| Quadrant D | 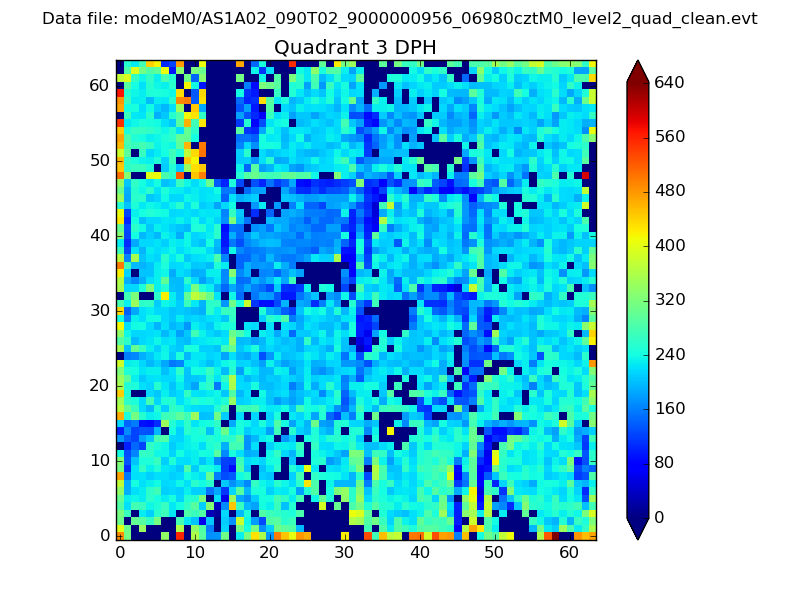 |
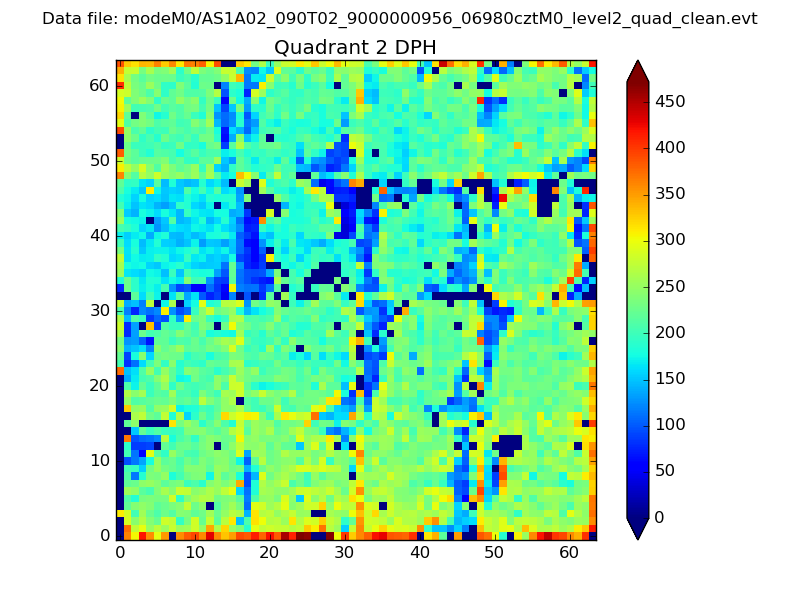 |
Quadrant C |
| Plot type | Count rate plots | Images |
|---|---|---|
| Comparison with Poisson distribution Blue bars denote a histogram of data divided into 1 sec bins. Red curve is a Poisson curve with rate = median count rate of data. |
 |
 |
| Quadrant-wise count rates Data is divided into 100 sec bins |
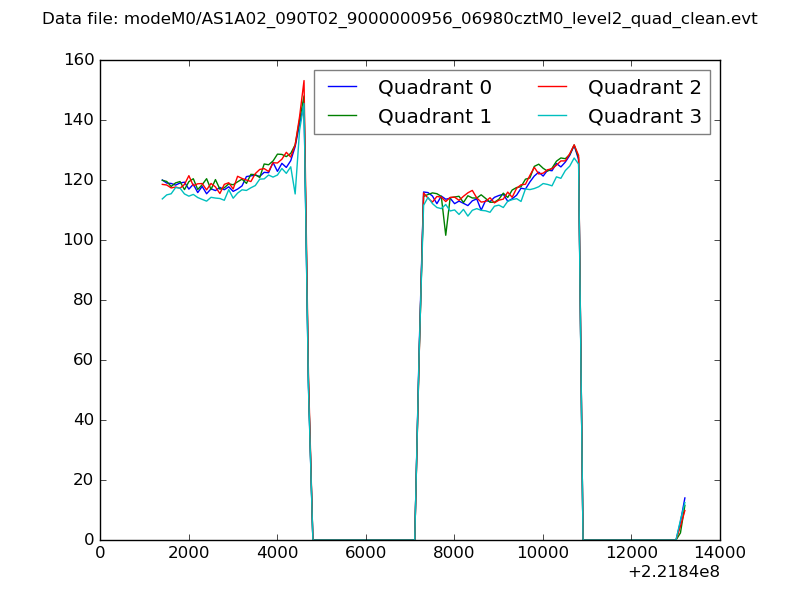 |
|
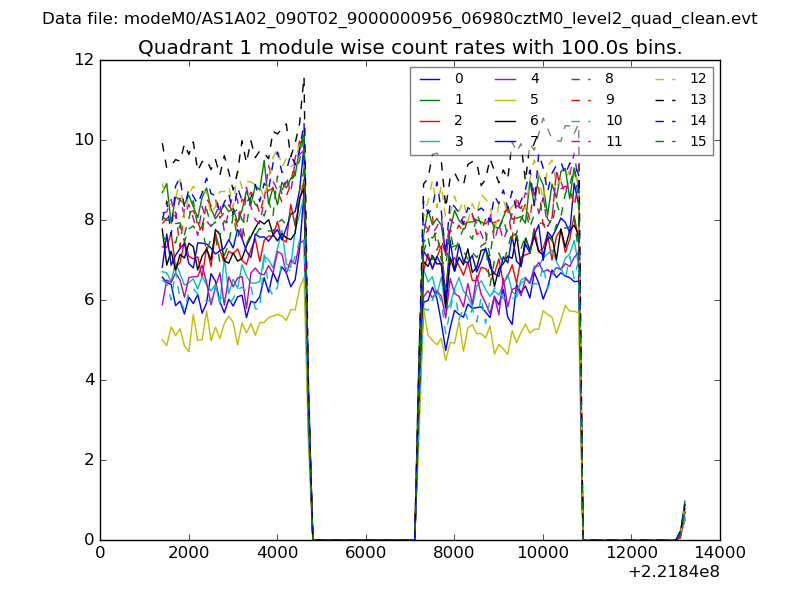
| Module-wise count rates for Quadrant A Data is divided into 100 sec bins |
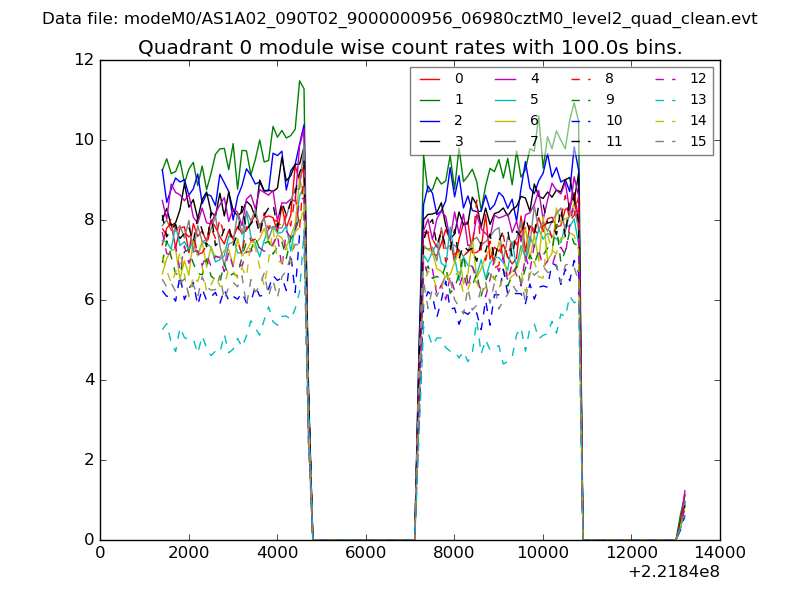 |
 |
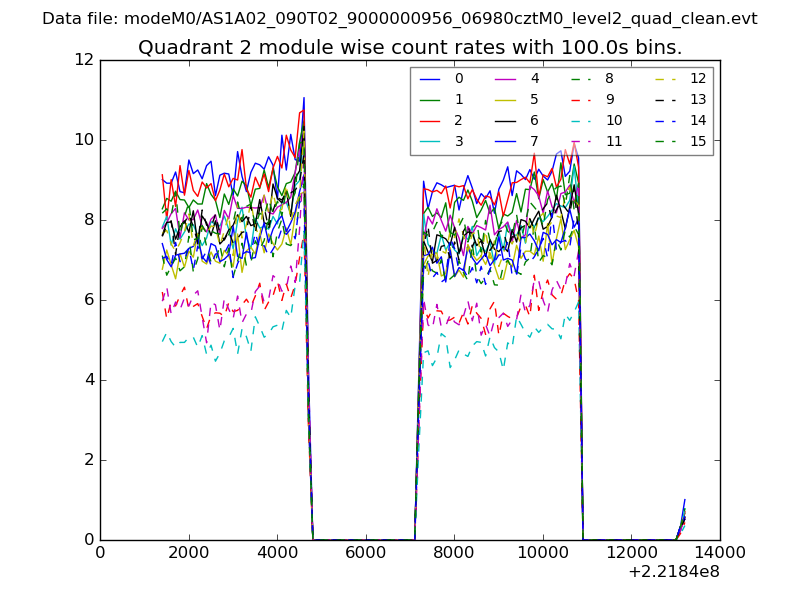
| Module-wise count rates for Quadrant B Data is divided into 100 sec bins |
 |
 |
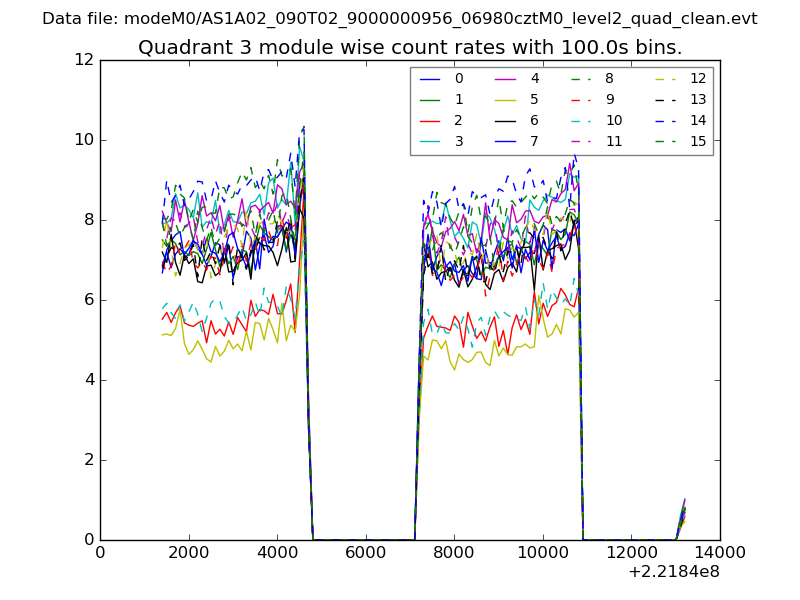
| Module-wise count rates for Quadrant C Data is divided into 100 sec bins |
 |
 |
| Module-wise count rates for Quadrant D Data is divided into 100 sec bins |
 |
 |
| Parameter | Plot |
|---|---|
| CZT HV Monitor | 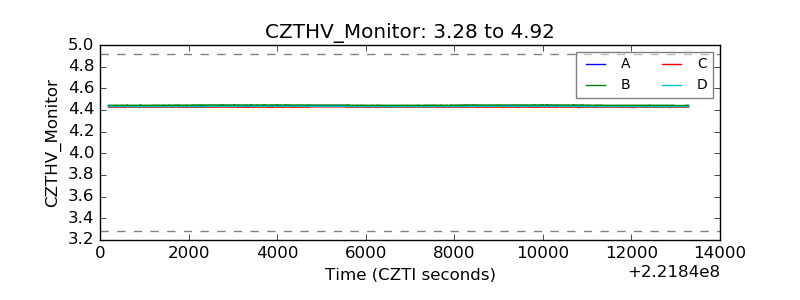 |
| D_VDD | 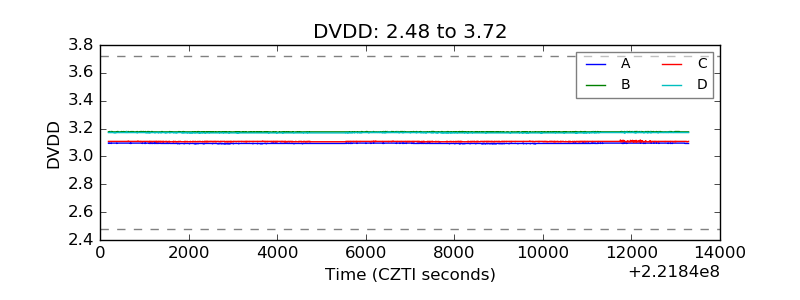 |
| Temperature 1 | 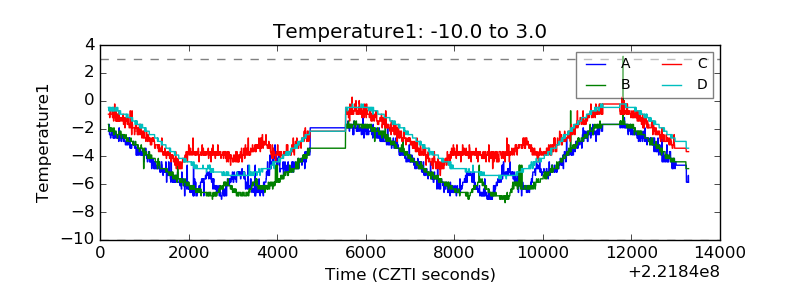 |
| Veto HV Monitor | 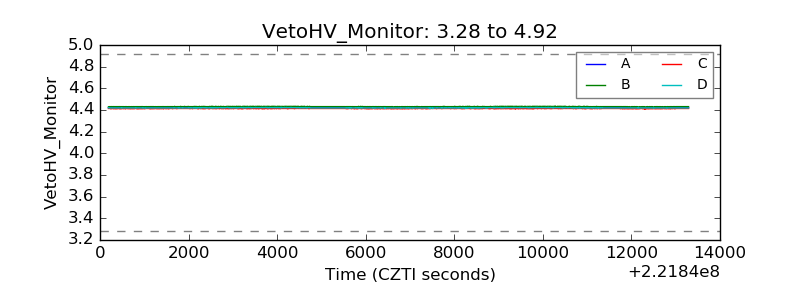 |
| Veto LLD | 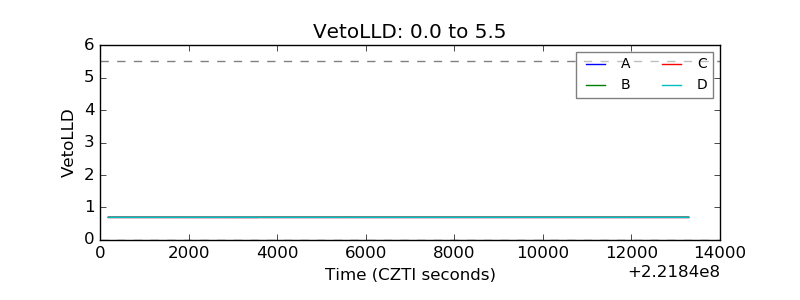 |
| Alpha Counter | 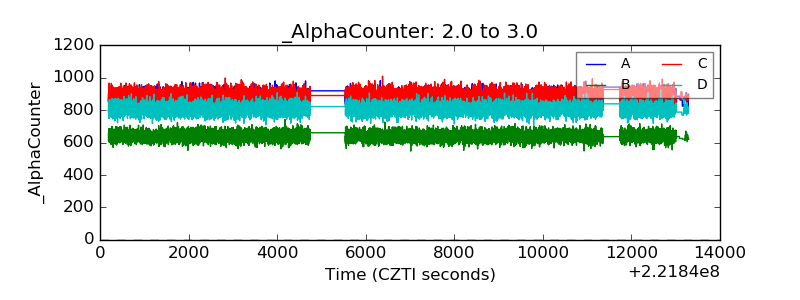 |
| _CPM_Rate | 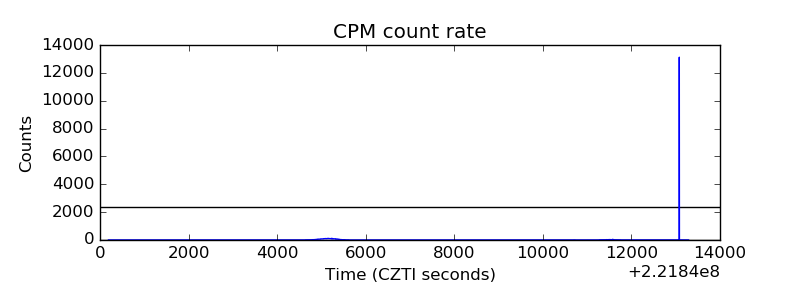 |
| CZT Counter | 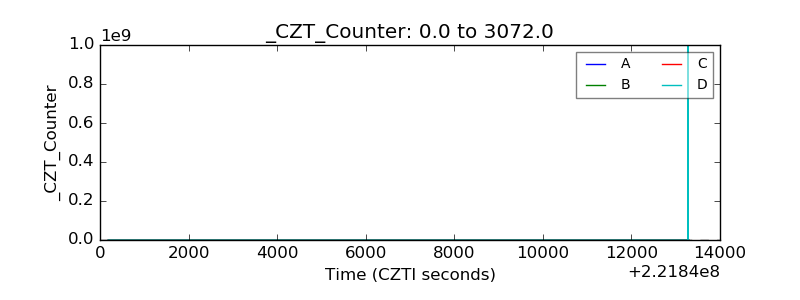 |
| +2.5 Volts monitor |  |
| +5 Volts monitor |  |
| _ROLL_ROT | 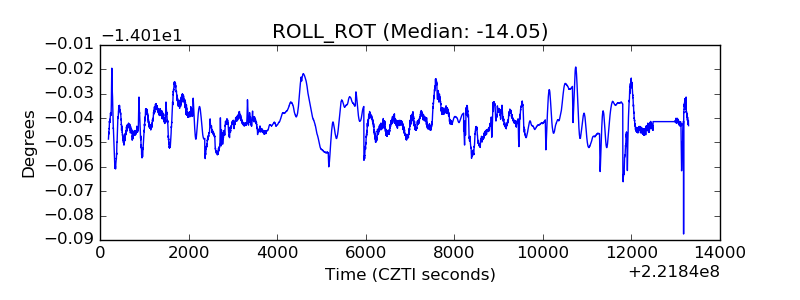 |
| _Roll_DEC | 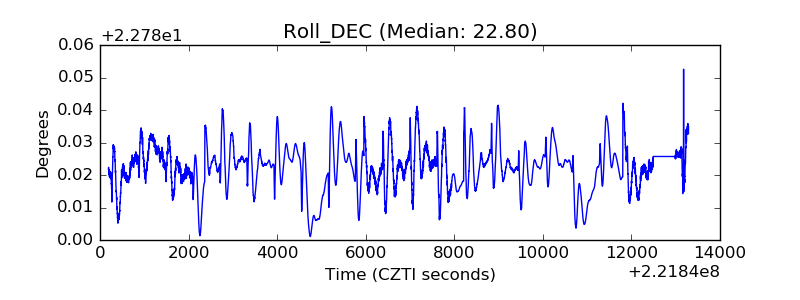 |
| _Roll_RA | 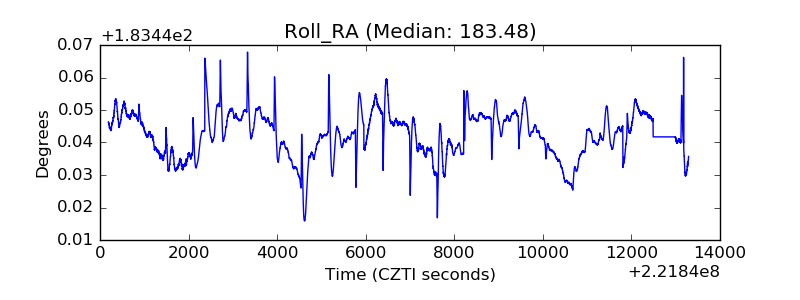 |
| Veto Counter | 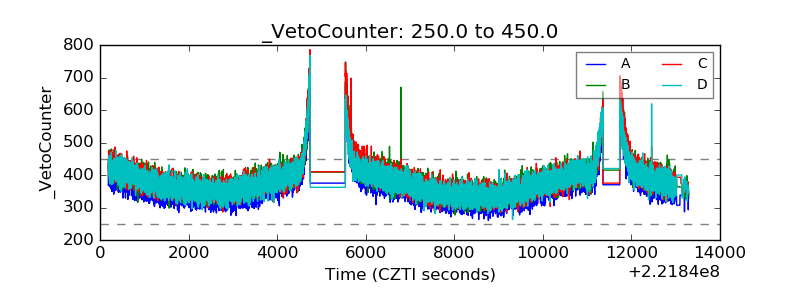 |