| Param | Original file | Final file |
|---|---|---|
| Filename | modeM0/AS1A02_090T02_9000000956_06981cztM0_level2.evt | modeM0/AS1A02_090T02_9000000956_06981cztM0_level2_quad_clean.evt |
| Size (bytes) | 469,287,360 | 80,922,240 |
| Size | 447.5 MB | 77.2 MB |
| Events in quadrant A | 3,303,135 | 491,491 |
| Events in quadrant B | 3,497,576 | 494,365 |
| Events in quadrant C | 3,223,512 | 493,067 |
| Events in quadrant D | 3,706,298 | 477,957 |
| Mode M0 | |||
|---|---|---|---|
| Quadrant | BADHDUFLAG | Total packets | Discarded packets |
| A | 0 | 14757 | 2 |
| B | 0 | 15192 | 1 |
| C | 0 | 14596 | 1 |
| D | 0 | 15718 | 1 |
| Mode SS | |||
|---|---|---|---|
| Quadrant | BADHDUFLAG | Total packets | Discarded packets |
| A | 0 | 144 | 0 |
| B | 0 | 144 | 0 |
| C | 0 | 144 | 0 |
| D | 0 | 144 | 0 |
| Mode M9 | |||
|---|---|---|---|
| Quadrant | BADHDUFLAG | Total packets | Discarded packets |
| A | 0 | 1 | 0 |
| B | 0 | 1 | 0 |
| C | 0 | 1 | 0 |
| D | 0 | 1 | 0 |
| Quadrant | Total seconds | Saturated seconds | Saturation percentage |
|---|---|---|---|
| A | 7086 | 126 | 1.778154% |
| B | 7086 | 194 | 2.737793% |
| C | 7086 | 99 | 1.397121% |
| D | 7086 | 162 | 2.286198% |
Noise dominated data is calculated using 1-second bins in cleaned event files. If a bin has >2000 counts, and if more than 50% of those come from <1% of pixels, then it is considered to be noise-dominated and hence unusable.
| Quadrant | # 1 sec bins | Bins with >0 counts | Bins with >2000 counts | High rate bins dominated by noise | Noise dominated (total time) | Noise dominated (detector-on time) | Marked lightcurve |
|---|---|---|---|---|---|---|---|
| A | 7186 | 7087 | 1 | 1 | 0.01% | 0.01% | 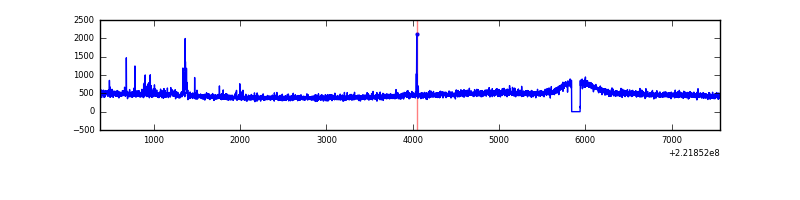 |
| B | 7186 | 7087 | 18 | 18 | 0.25% | 0.25% | 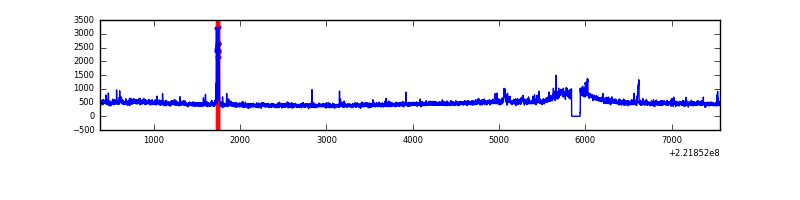 |
| C | 7186 | 7087 | 0 | 0 | 0.00% | 0.00% | 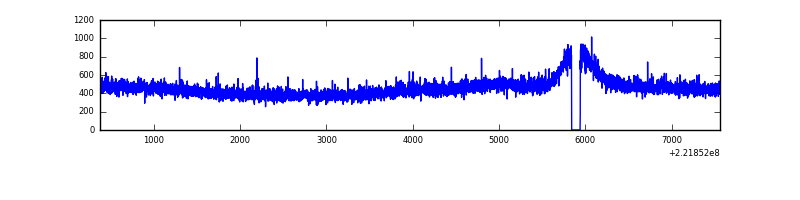 |
| D | 7186 | 7087 | 45 | 45 | 0.63% | 0.63% | 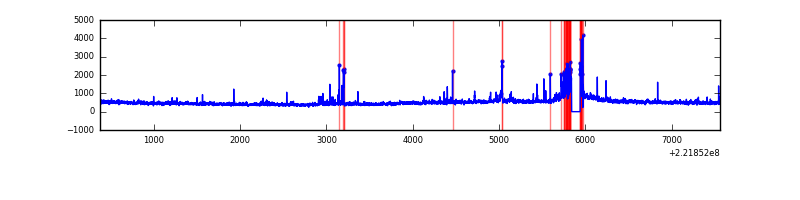 |
Top three noisy pixels from each quadrant. If the there are fewer than three noisy pixels in the level2.evt file, extra rows are filled as -1
| Pixel properties | Quadrant properties | ||||||
|---|---|---|---|---|---|---|---|
| Quadrant | DetID | PixID | Counts | Sigma | Mean | Median | Sigma |
| A | 14 | 239 | 54170 | 308.55 | 840 | 820 | 172.9 |
| A | 0 | 226 | 8215 | 42.77 | 840 | 820 | 172.9 |
| A | 12 | 194 | 7641 | 39.45 | 840 | 820 | 172.9 |
| B | 0 | 228 | 142828 | 861.04 | 845 | 821 | 164.9 |
| B | 4 | 81 | 24636 | 144.4 | 845 | 821 | 164.9 |
| B | 4 | 80 | 17528 | 101.3 | 845 | 821 | 164.9 |
| C | 13 | 61 | 6408 | 29.2 | 821 | 823 | 191.2 |
| C | 1 | 16 | 5720 | 25.61 | 821 | 823 | 191.2 |
| C | 12 | 4 | 4680 | 20.17 | 821 | 823 | 191.2 |
| D | 8 | 195 | 341565 | 1652.52 | 814 | 785 | 206.2 |
| D | 1 | 255 | 95137 | 457.54 | 814 | 785 | 206.2 |
| D | 2 | 136 | 78052 | 374.69 | 814 | 785 | 206.2 |
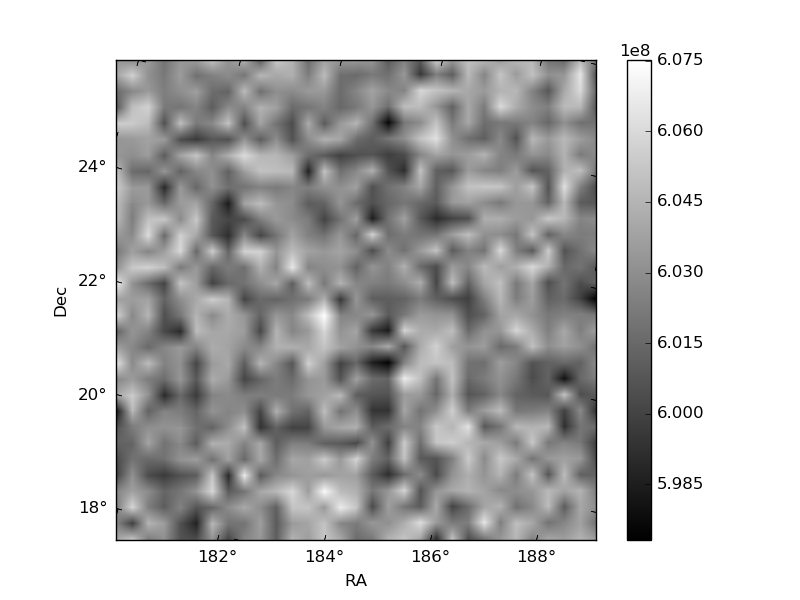
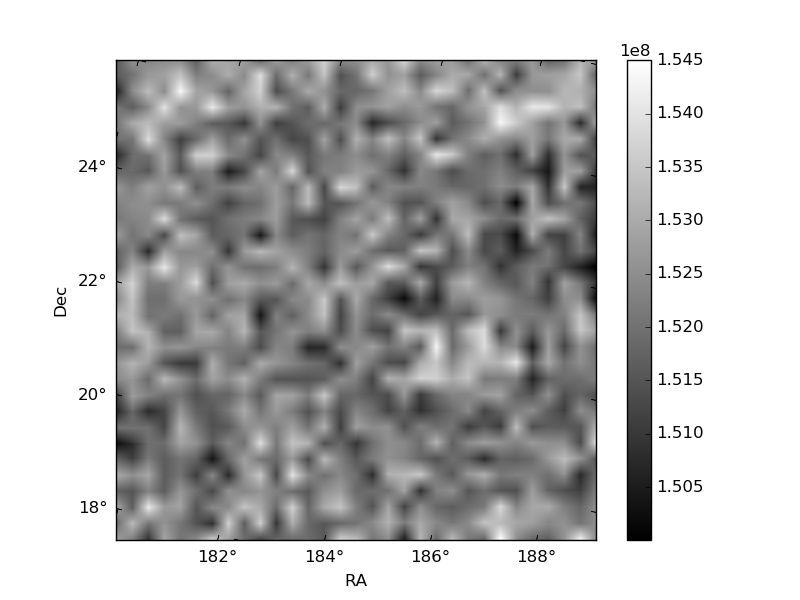
Histogram calculated using DETX and DETY for each event in the final _common_clean file
| Quadrant A | 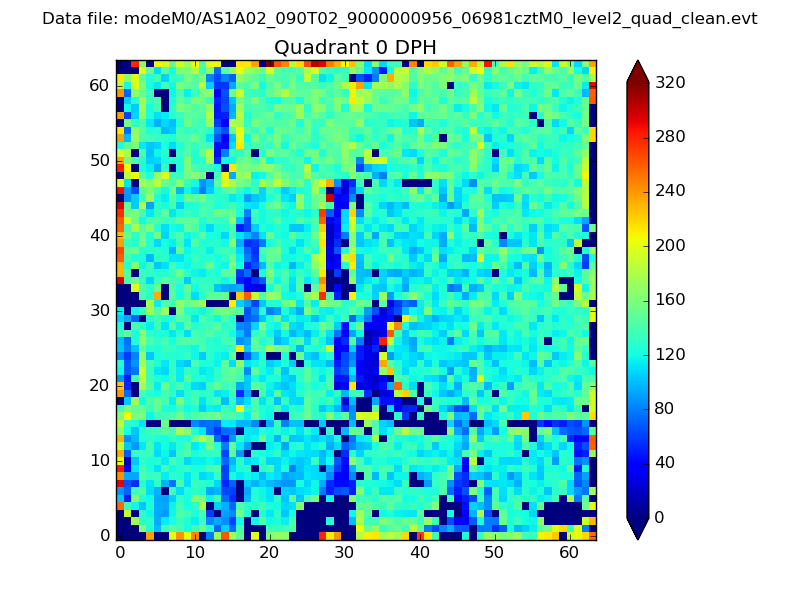 |
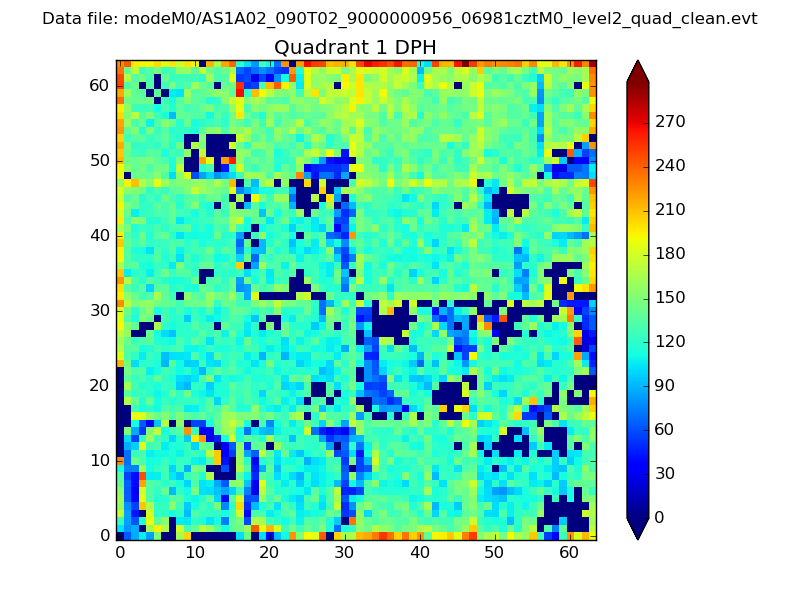 |
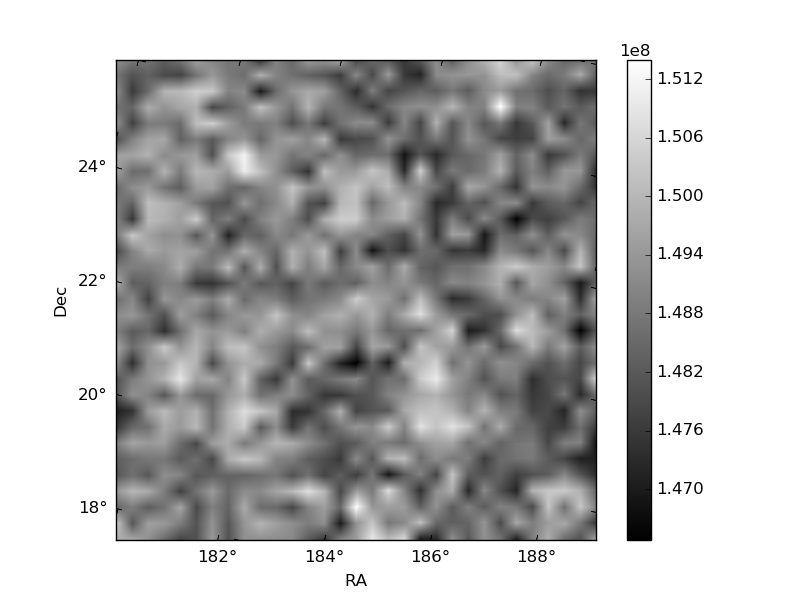
Quadrant B |
|---|---|---|---|
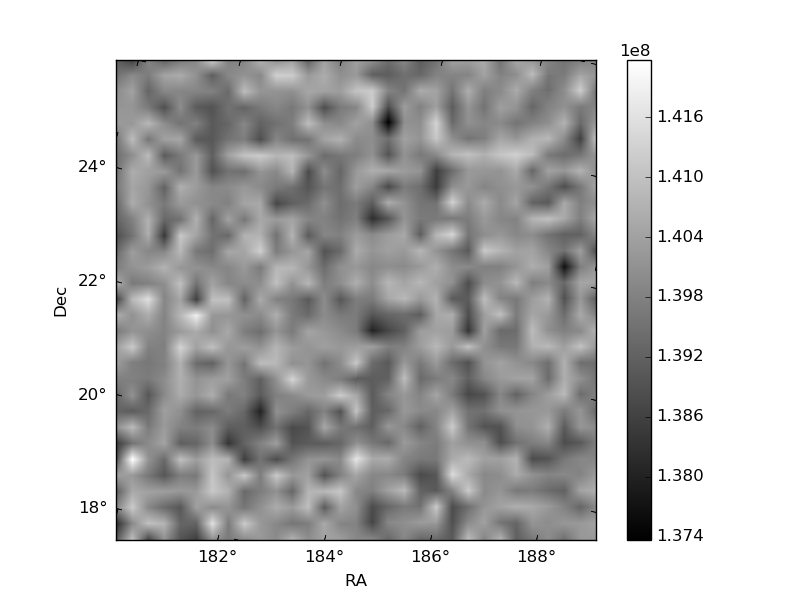
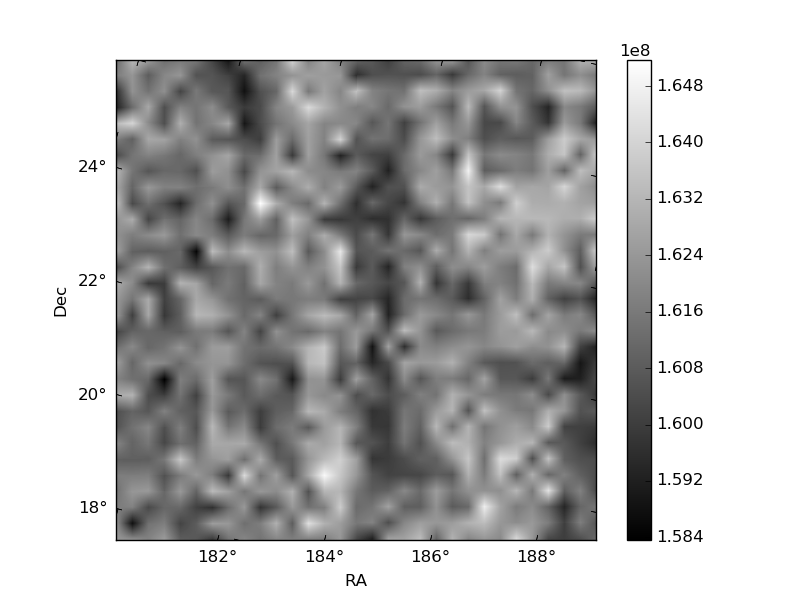
| Quadrant D | 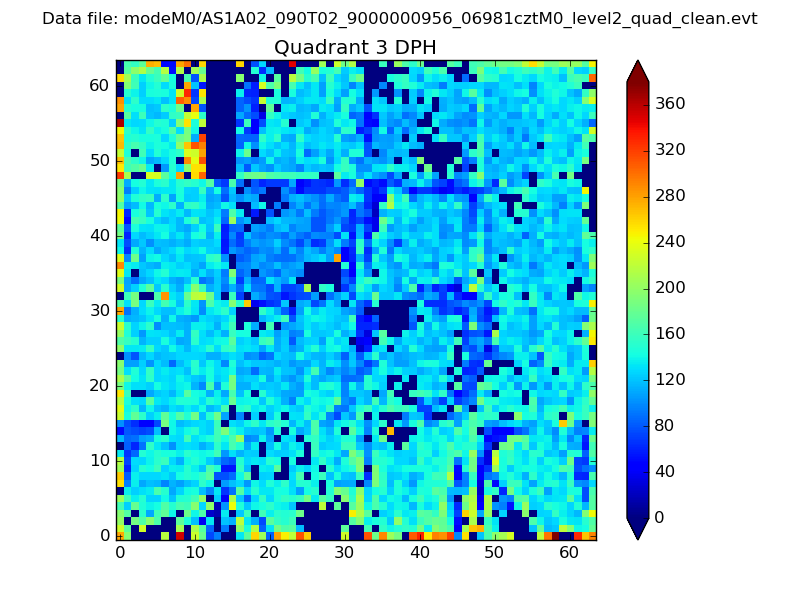 |
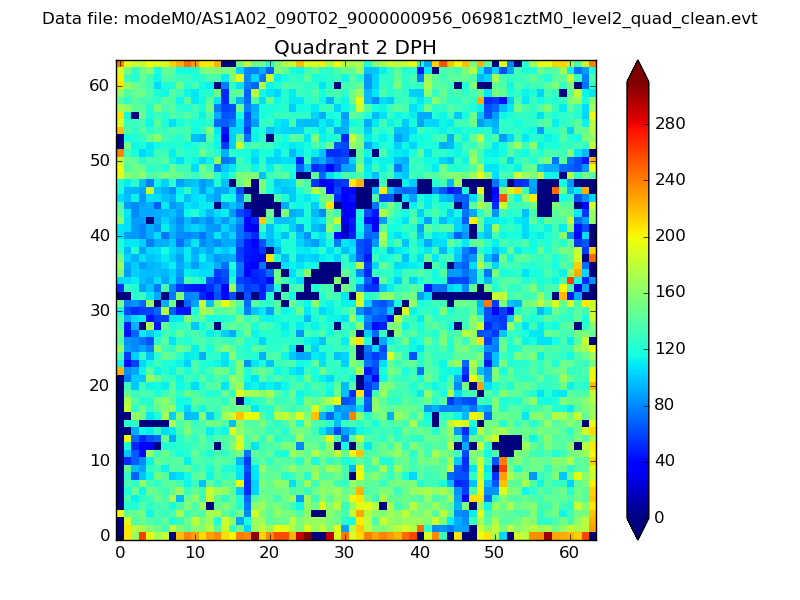 |
Quadrant C |
| Plot type | Count rate plots | Images |
|---|---|---|
| Comparison with Poisson distribution Blue bars denote a histogram of data divided into 1 sec bins. Red curve is a Poisson curve with rate = median count rate of data. |
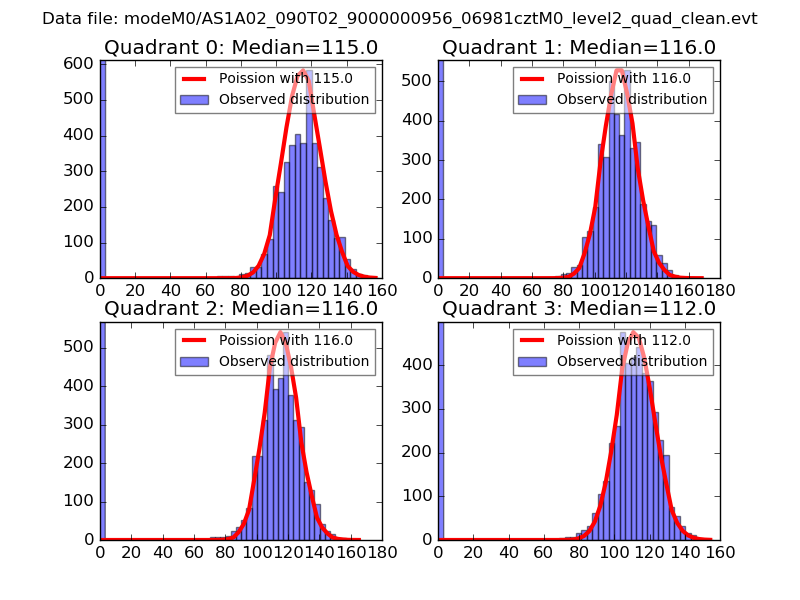 |
 |
| Quadrant-wise count rates Data is divided into 100 sec bins |
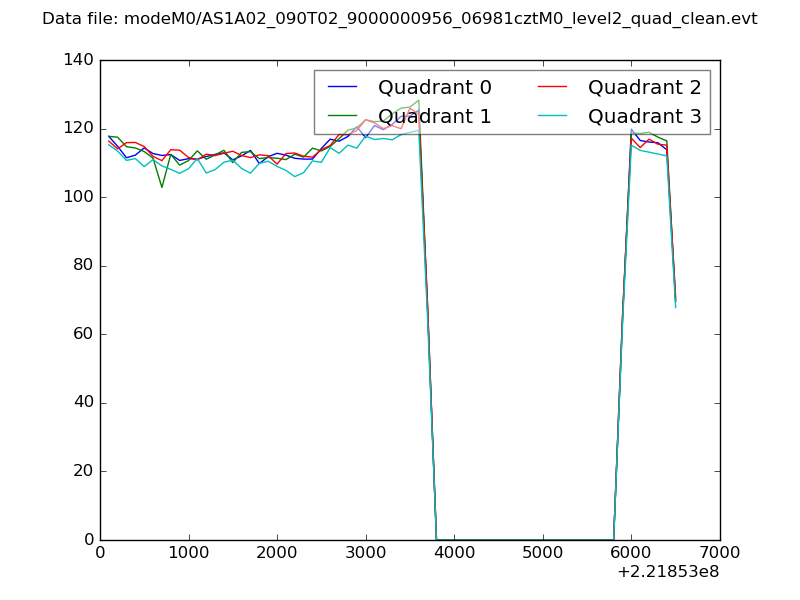 |
|
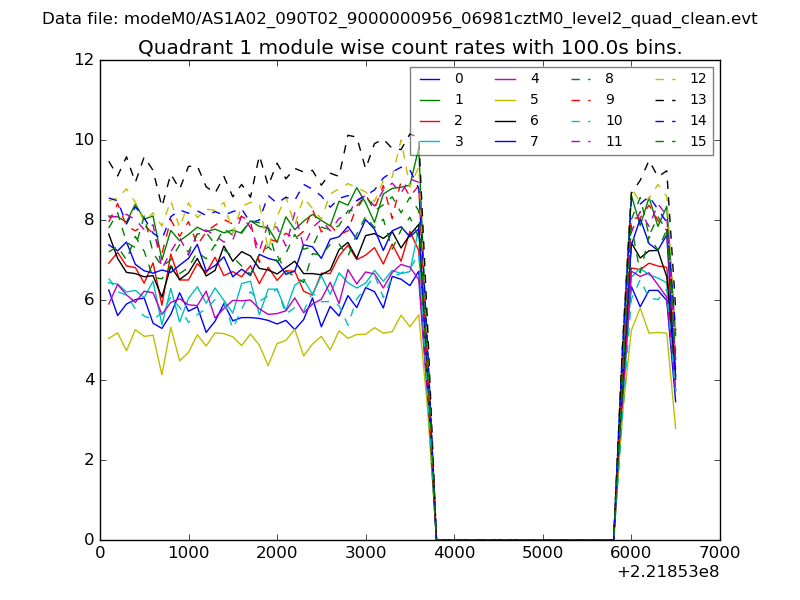
| Module-wise count rates for Quadrant A Data is divided into 100 sec bins |
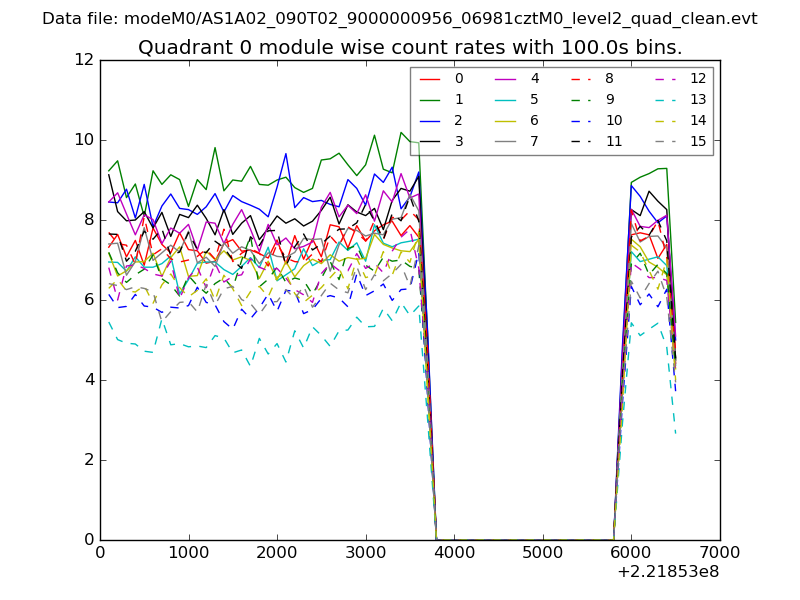 |
 |
| Module-wise count rates for Quadrant B Data is divided into 100 sec bins |
 |
 |
| Module-wise count rates for Quadrant C Data is divided into 100 sec bins |
 |
 |
| Module-wise count rates for Quadrant D Data is divided into 100 sec bins |
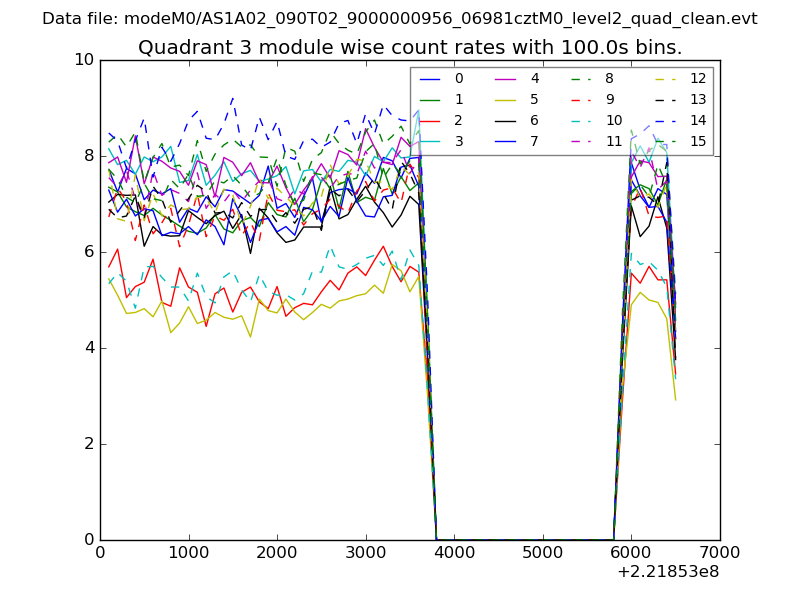 |
 |
| Parameter | Plot |
|---|---|
| CZT HV Monitor | 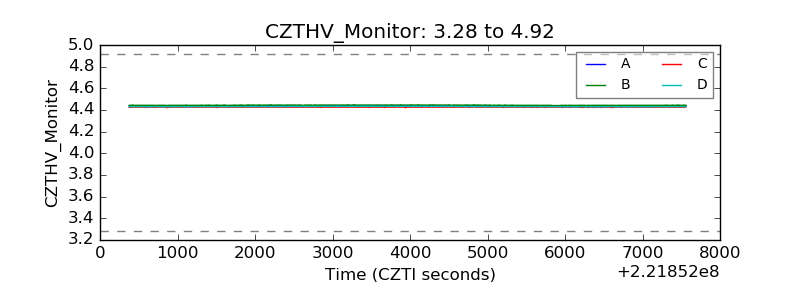 |
| D_VDD | 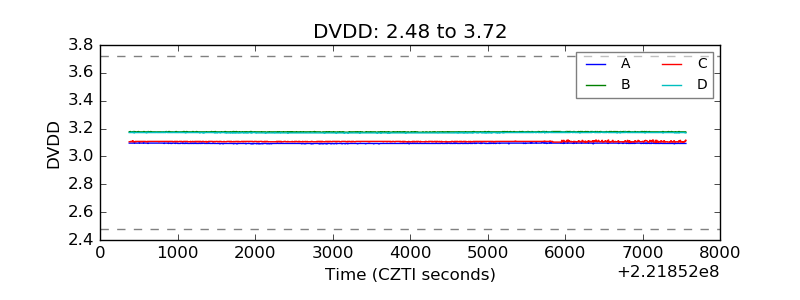 |
| Temperature 1 | 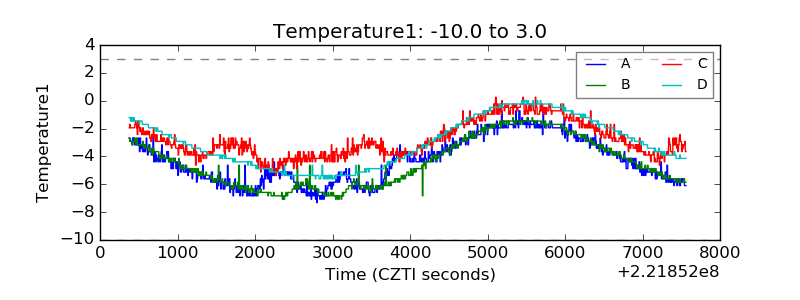 |
| Veto HV Monitor | 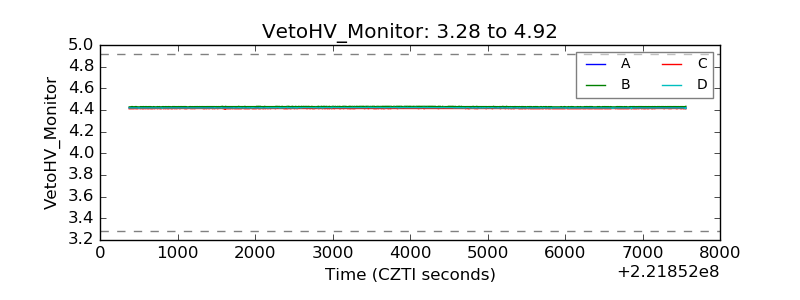 |
| Veto LLD | 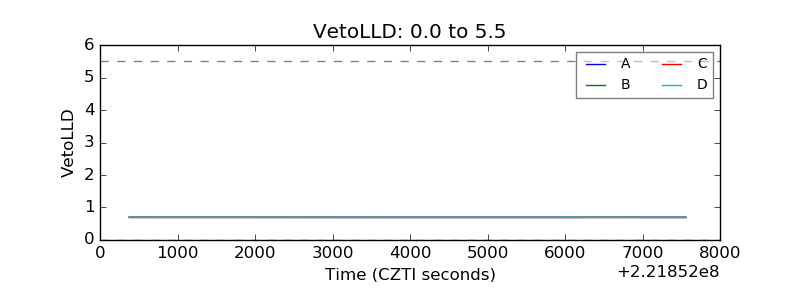 |
| Alpha Counter | 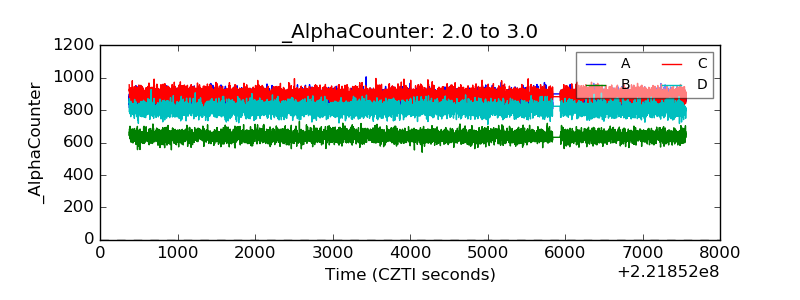 |
| _CPM_Rate | 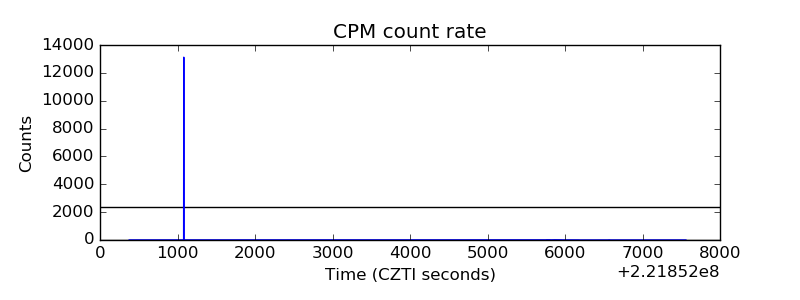 |
| CZT Counter | 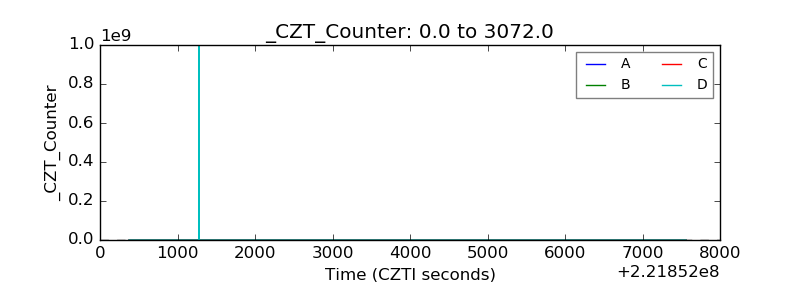 |
| +2.5 Volts monitor | 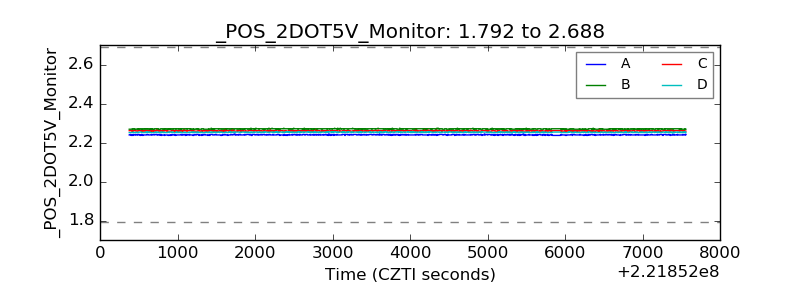 |
| +5 Volts monitor |  |
| _ROLL_ROT | 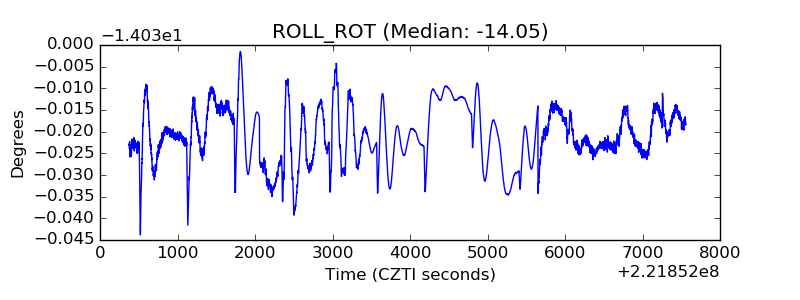 |
| _Roll_DEC | 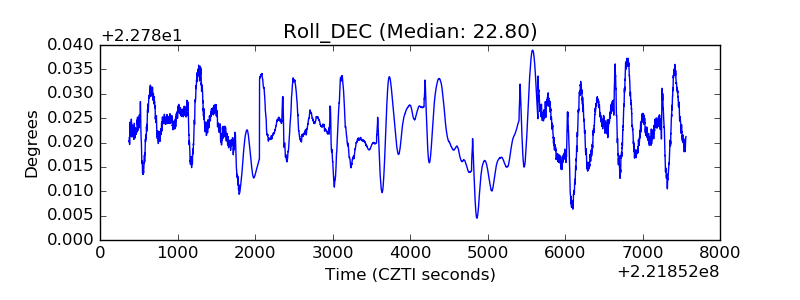 |
| _Roll_RA | 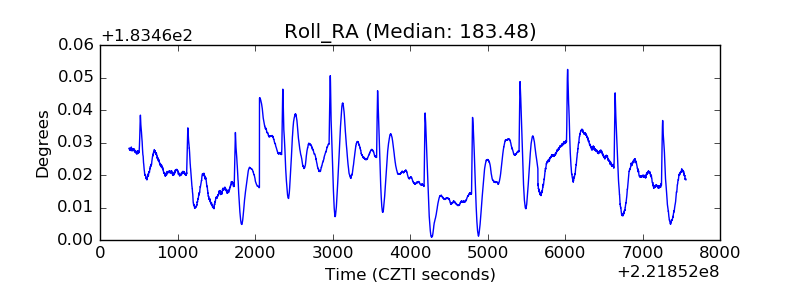 |
| Veto Counter | 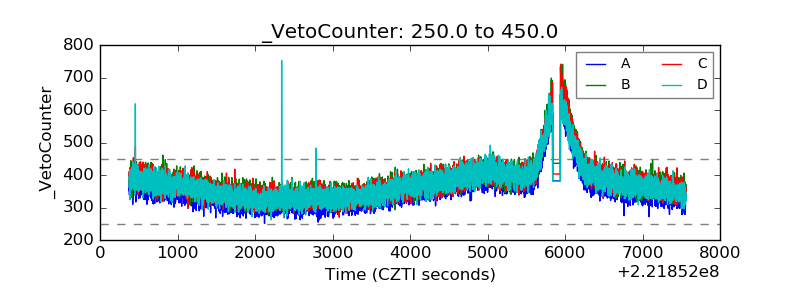 |