| Param | Original file | Final file |
|---|---|---|
| Filename | modeM0/AS1A02_090T02_9000000956_06986cztM0_level2.evt | modeM0/AS1A02_090T02_9000000956_06986cztM0_level2_quad_clean.evt |
| Size (bytes) | 664,617,600 | 129,864,960 |
| Size | 633.8 MB | 123.8 MB |
| Events in quadrant A | 4,655,014 | 802,140 |
| Events in quadrant B | 4,847,629 | 813,803 |
| Events in quadrant C | 4,641,785 | 808,475 |
| Events in quadrant D | 5,269,794 | 780,040 |
| Mode M0 | |||
|---|---|---|---|
| Quadrant | BADHDUFLAG | Total packets | Discarded packets |
| A | 0 | 21420 | 1 |
| B | 0 | 21824 | 1 |
| C | 0 | 21427 | 1 |
| D | 0 | 22624 | 1 |
| Mode SS | |||
|---|---|---|---|
| Quadrant | BADHDUFLAG | Total packets | Discarded packets |
| A | 0 | 212 | 0 |
| B | 0 | 212 | 0 |
| C | 0 | 212 | 0 |
| D | 0 | 212 | 0 |
| Mode M9 | |||
|---|---|---|---|
| Quadrant | BADHDUFLAG | Total packets | Discarded packets |
| A | 0 | 3 | 0 |
| B | 0 | 3 | 0 |
| C | 0 | 3 | 0 |
| D | 0 | 3 | 0 |
| Quadrant | Total seconds | Saturated seconds | Saturation percentage |
|---|---|---|---|
| A | 10523 | 59 | 0.560677% |
| B | 10523 | 83 | 0.788748% |
| C | 10523 | 37 | 0.351611% |
| D | 10523 | 61 | 0.579683% |
Noise dominated data is calculated using 1-second bins in cleaned event files. If a bin has >2000 counts, and if more than 50% of those come from <1% of pixels, then it is considered to be noise-dominated and hence unusable.
| Quadrant | # 1 sec bins | Bins with >0 counts | Bins with >2000 counts | High rate bins dominated by noise | Noise dominated (total time) | Noise dominated (detector-on time) | Marked lightcurve |
|---|---|---|---|---|---|---|---|
| A | 10838 | 10524 | 0 | 0 | 0.00% | 0.00% | 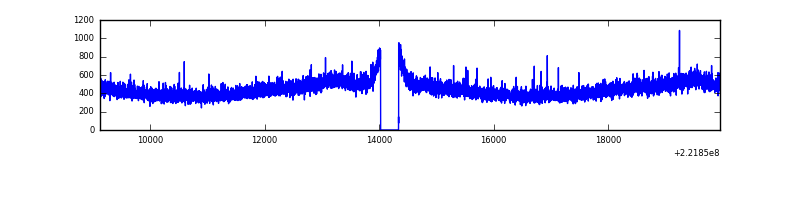 |
| B | 10838 | 10524 | 2 | 2 | 0.02% | 0.02% | 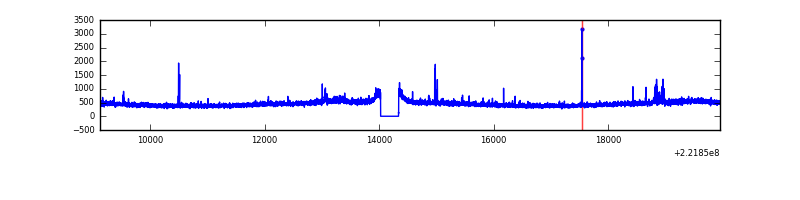 |
| C | 10838 | 10524 | 0 | 0 | 0.00% | 0.00% | 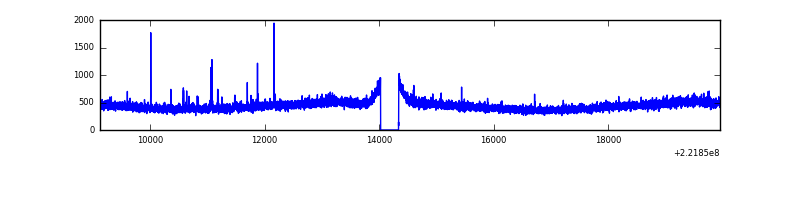 |
| D | 10838 | 10524 | 11 | 11 | 0.10% | 0.10% | 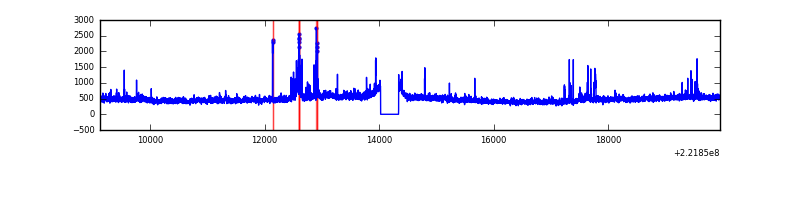 |
Top three noisy pixels from each quadrant. If the there are fewer than three noisy pixels in the level2.evt file, extra rows are filled as -1
| Pixel properties | Quadrant properties | ||||||
|---|---|---|---|---|---|---|---|
| Quadrant | DetID | PixID | Counts | Sigma | Mean | Median | Sigma |
| A | 0 | 226 | 11633 | 42.56 | 1203 | 1176 | 245.7 |
| A | 12 | 194 | 11102 | 40.4 | 1203 | 1176 | 245.7 |
| A | 8 | 15 | 8122 | 28.27 | 1203 | 1176 | 245.7 |
| B | 0 | 228 | 36622 | 152.42 | 1211 | 1178 | 232.5 |
| B | 0 | 214 | 26204 | 107.62 | 1211 | 1178 | 232.5 |
| B | 12 | 111 | 23457 | 95.8 | 1211 | 1178 | 232.5 |
| C | 7 | 247 | 49691 | 178.41 | 1170 | 1177 | 271.9 |
| C | 8 | 128 | 10504 | 34.3 | 1170 | 1177 | 271.9 |
| C | 13 | 61 | 9288 | 29.83 | 1170 | 1177 | 271.9 |
| D | 8 | 195 | 599653 | 2079.91 | 1168 | 1130 | 287.8 |
| D | 14 | 35 | 77726 | 266.18 | 1168 | 1130 | 287.8 |
| D | 2 | 136 | 60619 | 206.73 | 1168 | 1130 | 287.8 |
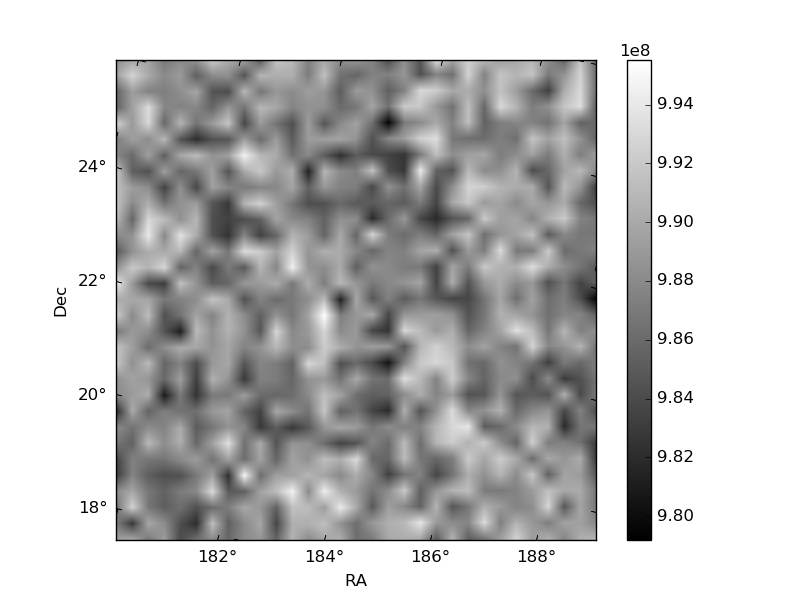
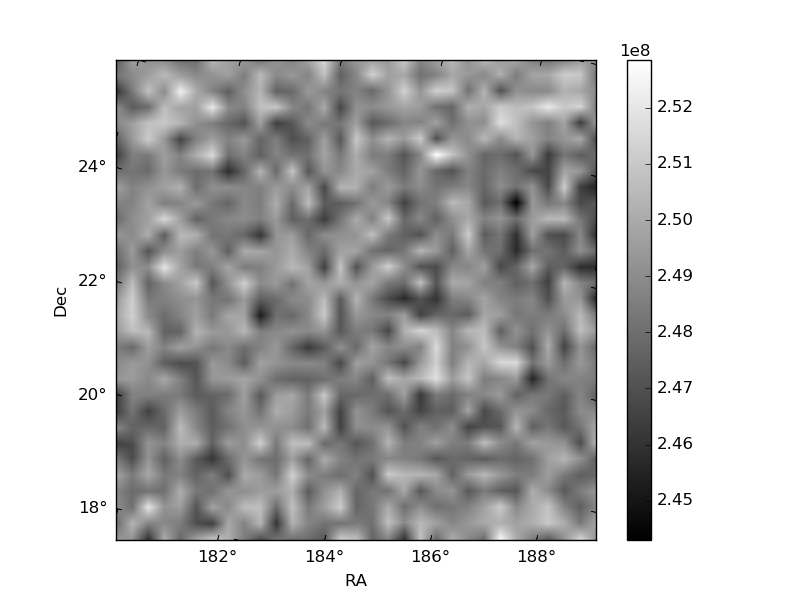
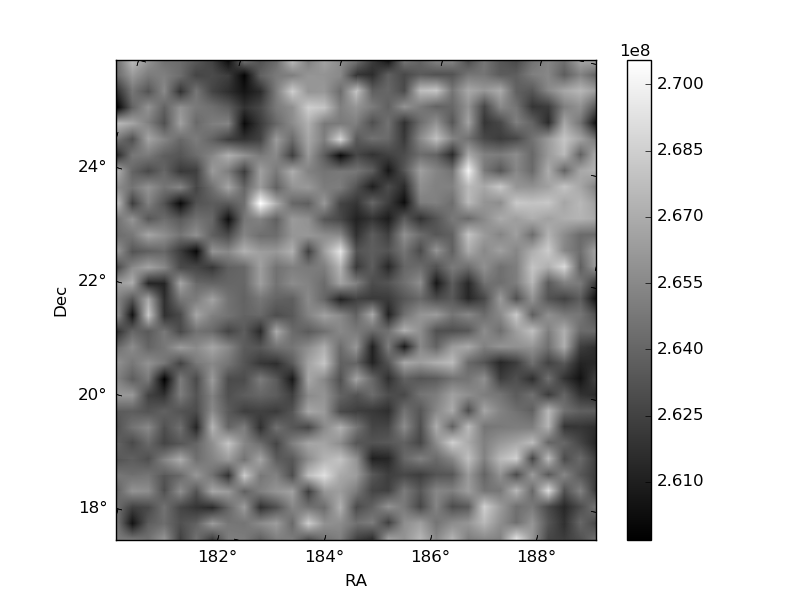
Histogram calculated using DETX and DETY for each event in the final _common_clean file
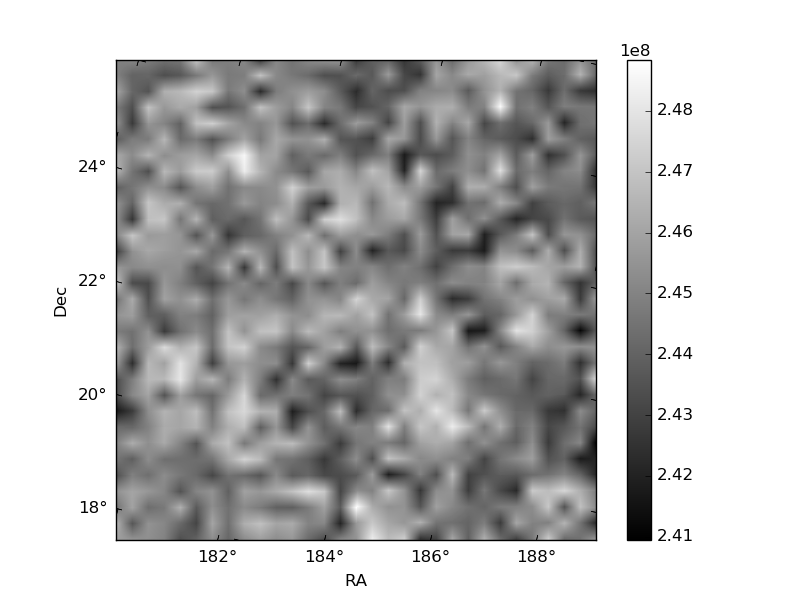
| Quadrant A | 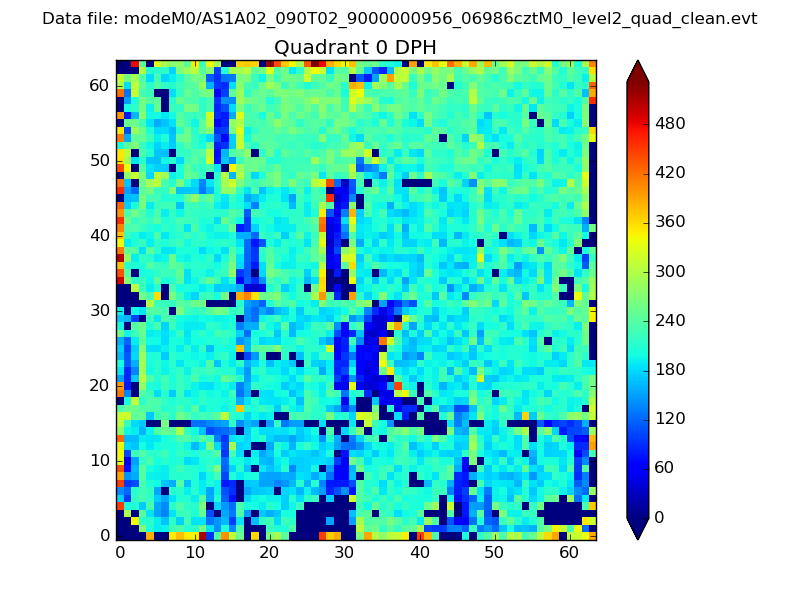 |
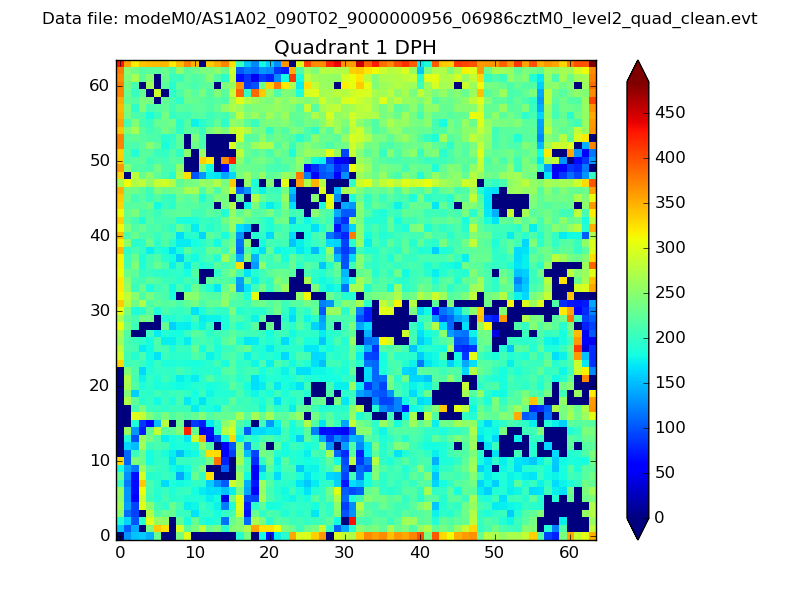 |
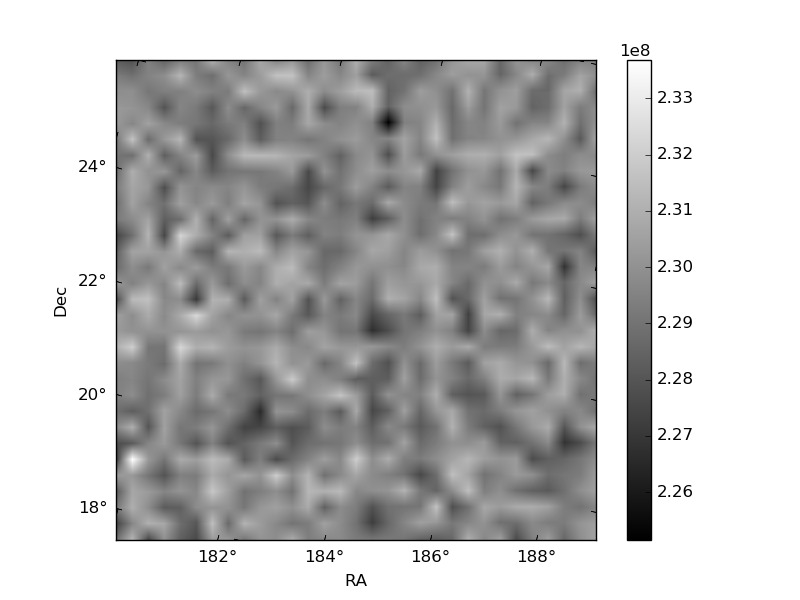
Quadrant B |
|---|---|---|---|
| Quadrant D | 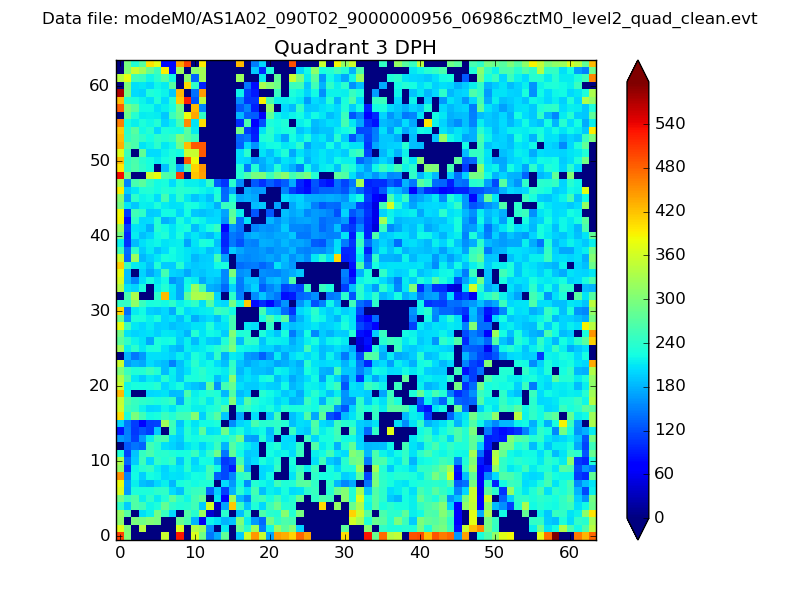 |
 |
Quadrant C |
| Plot type | Count rate plots | Images |
|---|---|---|
| Comparison with Poisson distribution Blue bars denote a histogram of data divided into 1 sec bins. Red curve is a Poisson curve with rate = median count rate of data. |
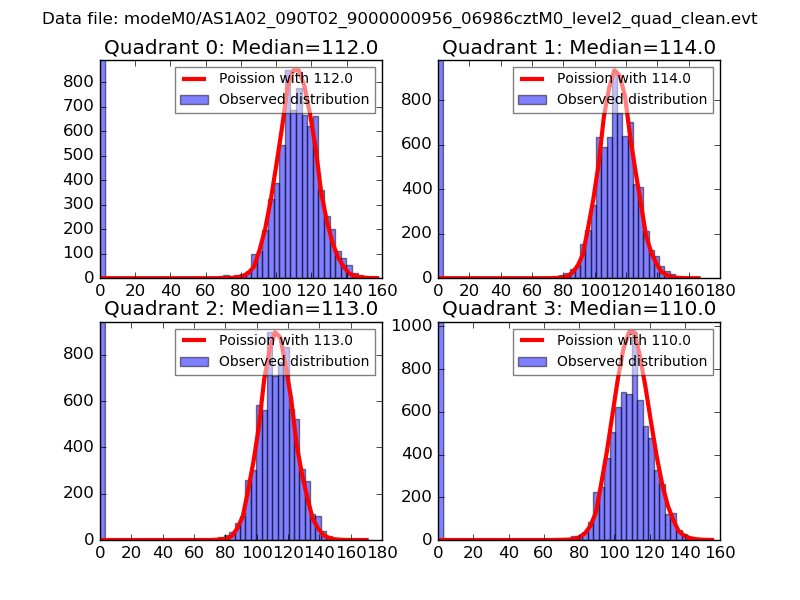 |
 |
| Quadrant-wise count rates Data is divided into 100 sec bins |
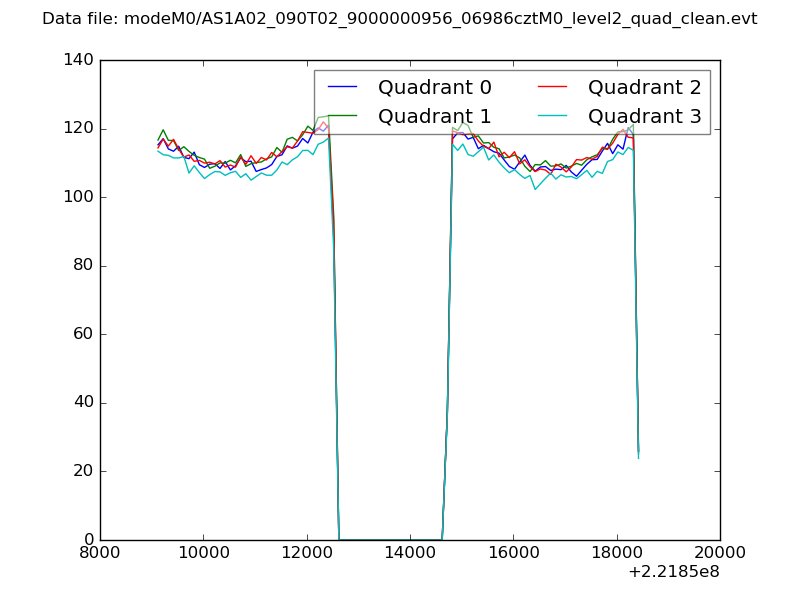 |
|
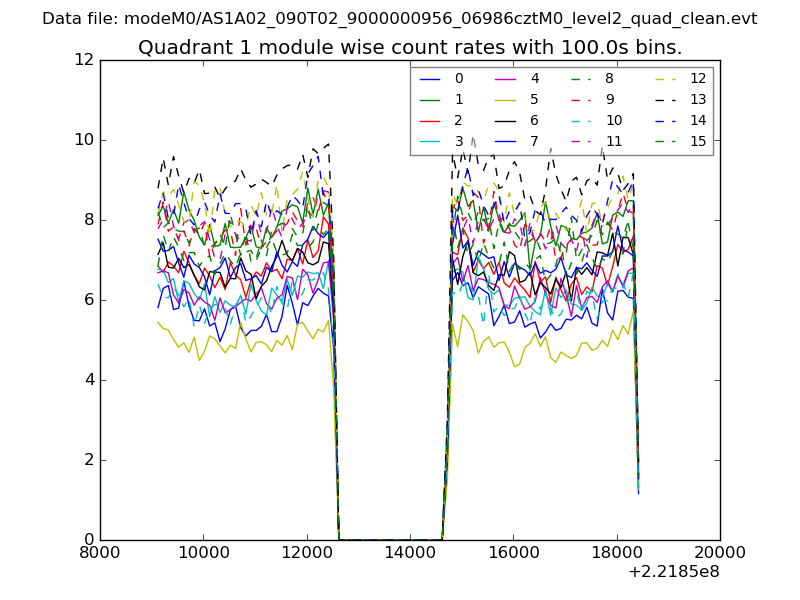
| Module-wise count rates for Quadrant A Data is divided into 100 sec bins |
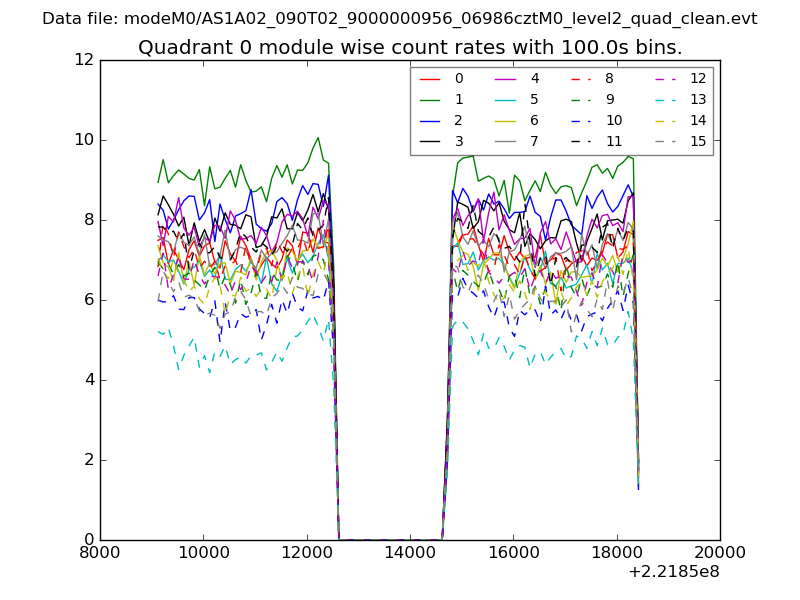 |
 |
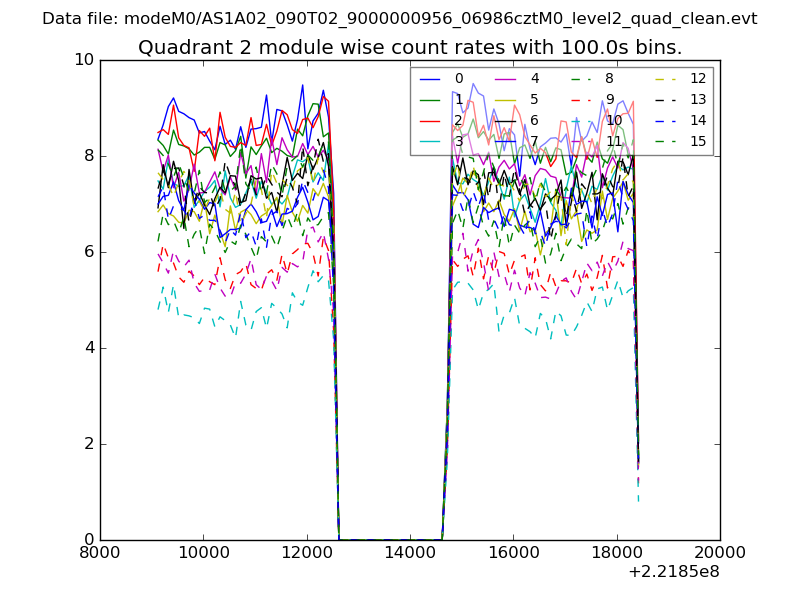
| Module-wise count rates for Quadrant B Data is divided into 100 sec bins |
 |
 |
| Module-wise count rates for Quadrant C Data is divided into 100 sec bins |
 |
 |
| Module-wise count rates for Quadrant D Data is divided into 100 sec bins |
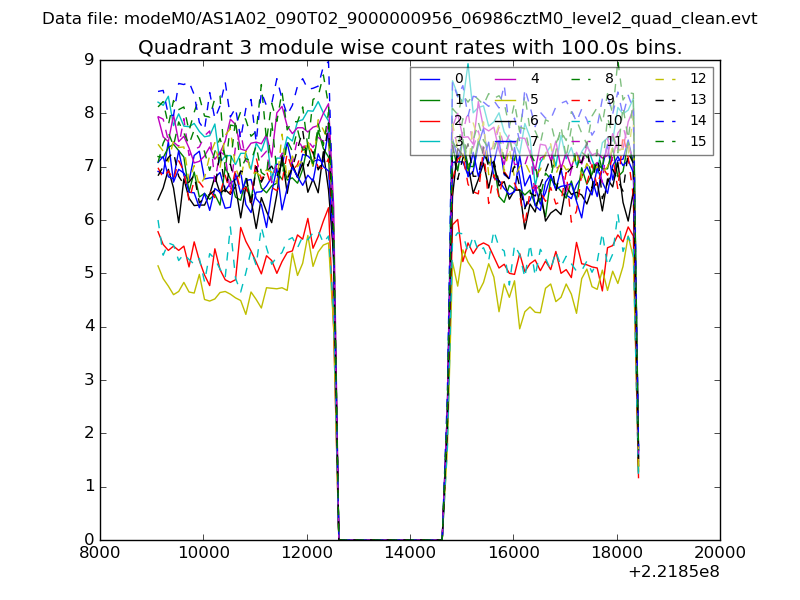 |
 |
| Parameter | Plot |
|---|---|
| CZT HV Monitor | 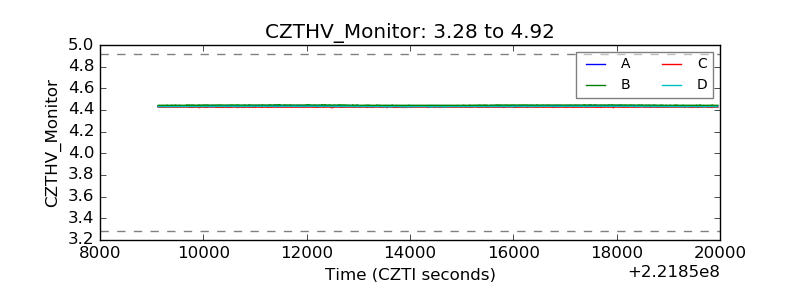 |
| D_VDD | 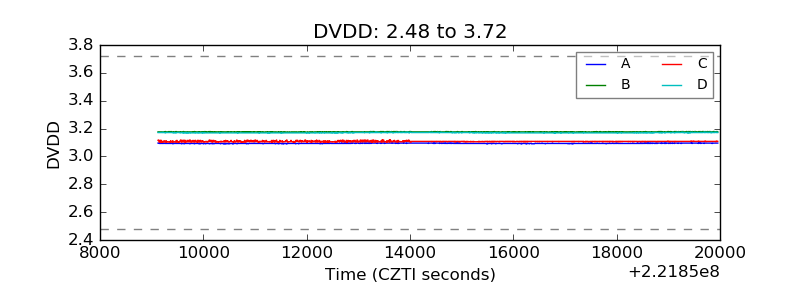 |
| Temperature 1 | 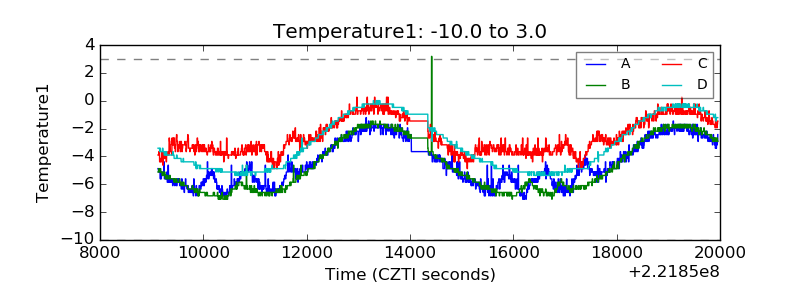 |
| Veto HV Monitor |  |
| Veto LLD | 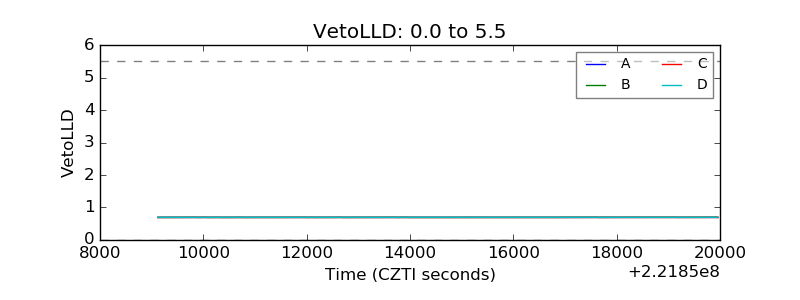 |
| Alpha Counter | 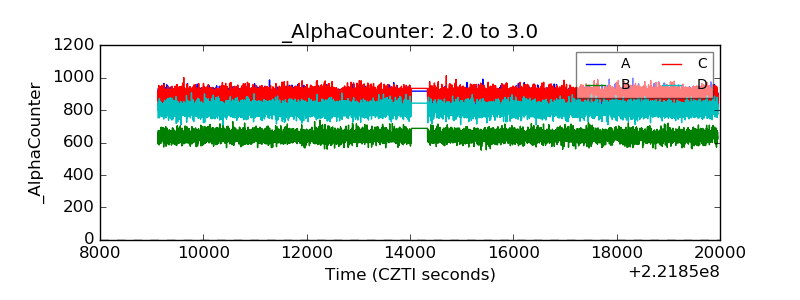 |
| _CPM_Rate | 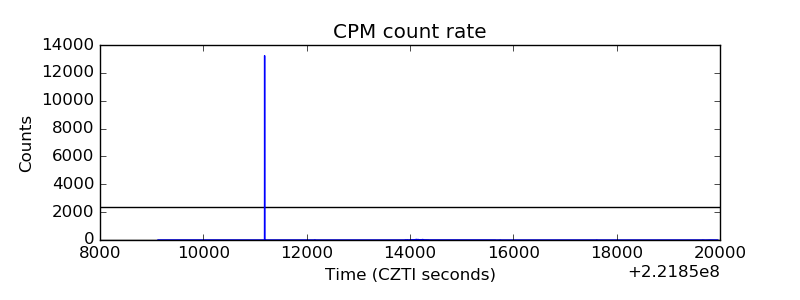 |
| CZT Counter | 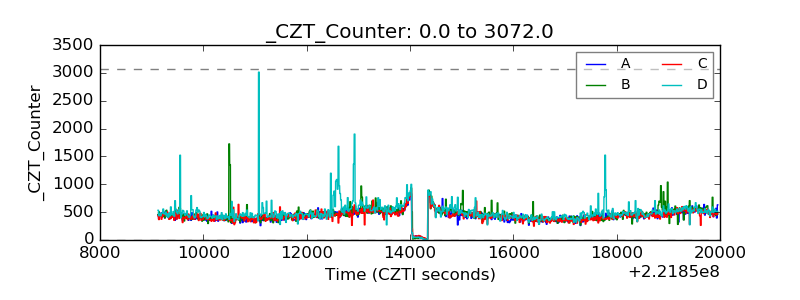 |
| +2.5 Volts monitor |  |
| +5 Volts monitor |  |
| _ROLL_ROT | 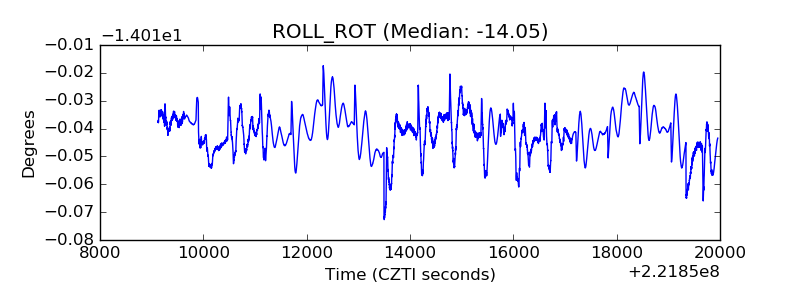 |
| _Roll_DEC | 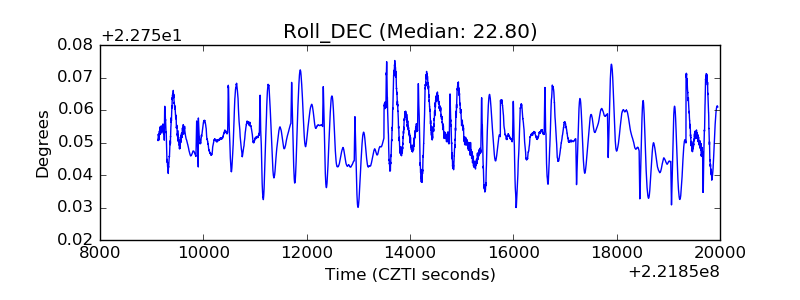 |
| _Roll_RA | 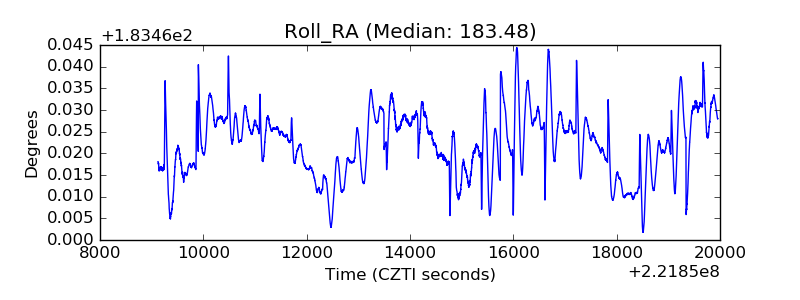 |
| Veto Counter | 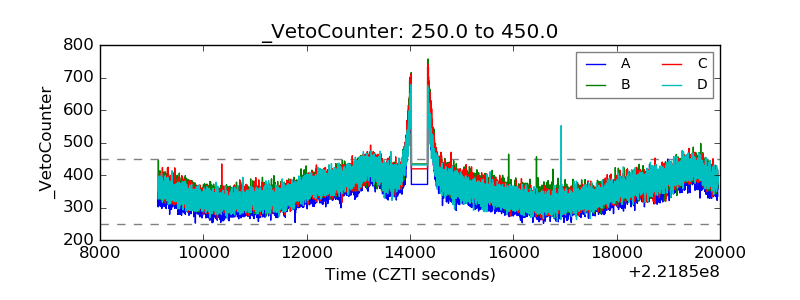 |