| Param | Original file | Final file |
|---|---|---|
| Filename | modeM0/AS1T01_151T01_9000000960cztM0_level2.fits | modeM0/AS1T01_151T01_9000000960cztM0_level2_quad_clean.evt |
| Size (bytes) | 1,162,186,560 | 1,200,718,080 |
| Size | 1.1 GB | 1.1 GB |
| Events in quadrant A | 7,054,828 | 7,325,135 |
| Events in quadrant B | 6,771,622 | 7,261,840 |
| Events in quadrant C | 6,897,476 | 6,883,436 |
| Events in quadrant D | 5,987,040 | 6,410,266 |
| Mode SS | |||
|---|---|---|---|
| Quadrant | BADHDUFLAG | Total packets | Discarded packets |
| A | 0 | 2526 | 0 |
| B | 0 | 2524 | 0 |
| C | 0 | 2524 | 0 |
| D | 0 | 2526 | 0 |
| Mode M9 | |||
|---|---|---|---|
| Quadrant | BADHDUFLAG | Total packets | Discarded packets |
| A | 0 | 217 | 0 |
| B | 0 | 217 | 0 |
| C | 0 | 217 | 0 |
| D | 0 | 217 | 0 |
| Mode M0 | |||
|---|---|---|---|
| Quadrant | BADHDUFLAG | Total packets | Discarded packets |
| A | 0 | 257908 | 0 |
| B | 0 | 267462 | 0 |
| C | 0 | 254174 | 0 |
| D | 0 | 270760 | 0 |
| Quadrant | Total seconds | Saturated seconds | Saturation percentage |
|---|---|---|---|
| A | 123830 | 1818 | 1.468142% |
| B | 123832 | 2159 | 1.743491% |
| C | 123832 | 946 | 0.763938% |
| D | 123830 | 2005 | 1.619155% |
Noise dominated data is calculated using 1-second bins in cleaned event files. If a bin has >2000 counts, and if more than 50% of those come from <1% of pixels, then it is considered to be noise-dominated and hence unusable.
| Quadrant | # 1 sec bins | Bins with >0 counts | Bins with >2000 counts | High rate bins dominated by noise | Noise dominated (total time) | Noise dominated (detector-on time) | Marked lightcurve |
|---|---|---|---|---|---|---|---|
| A | 145215 | 123816 | 0 | 0 | 0.00% | 0.00% |  |
| B | 145215 | 123821 | 0 | 0 | 0.00% | 0.00% |  |
| C | 145215 | 123835 | 0 | 0 | 0.00% | 0.00% |  |
| D | 145215 | 123822 | 0 | 0 | 0.00% | 0.00% |  |
Top three noisy pixels from each quadrant. If the there are fewer than three noisy pixels in the level2.evt file, extra rows are filled as -1
| Pixel properties | Quadrant properties | ||||||
|---|---|---|---|---|---|---|---|
| Quadrant | DetID | PixID | Counts | Sigma | Mean | Median | Sigma |
| A | 0 | 29 | 6958 | 11.38 | 1835 | 1714 | 461.0 |
| A | 7 | 110 | 5800 | 8.86 | 1835 | 1714 | 461.0 |
| A | 0 | 30 | 5337 | 7.86 | 1835 | 1714 | 461.0 |
| B | 2 | 9 | 5722 | 11.42 | 1787 | 1700 | 352.3 |
| B | 5 | 128 | 4671 | 8.43 | 1787 | 1700 | 352.3 |
| B | 12 | 226 | 4659 | 8.4 | 1787 | 1700 | 352.3 |
| C | 1 | 80 | 4950 | 6.82 | 1819 | 1681 | 479.4 |
| C | 1 | 81 | 4936 | 6.79 | 1819 | 1681 | 479.4 |
| C | 12 | 241 | 4821 | 6.55 | 1819 | 1681 | 479.4 |
| D | 3 | 14 | 4411 | 6.28 | 1708 | 1550 | 455.6 |
| D | 6 | 231 | 4399 | 6.25 | 1708 | 1550 | 455.6 |
| D | 7 | 5 | 4343 | 6.13 | 1708 | 1550 | 455.6 |
Histogram calculated using DETX and DETY for each event in the final _common_clean file
| Quadrant A | 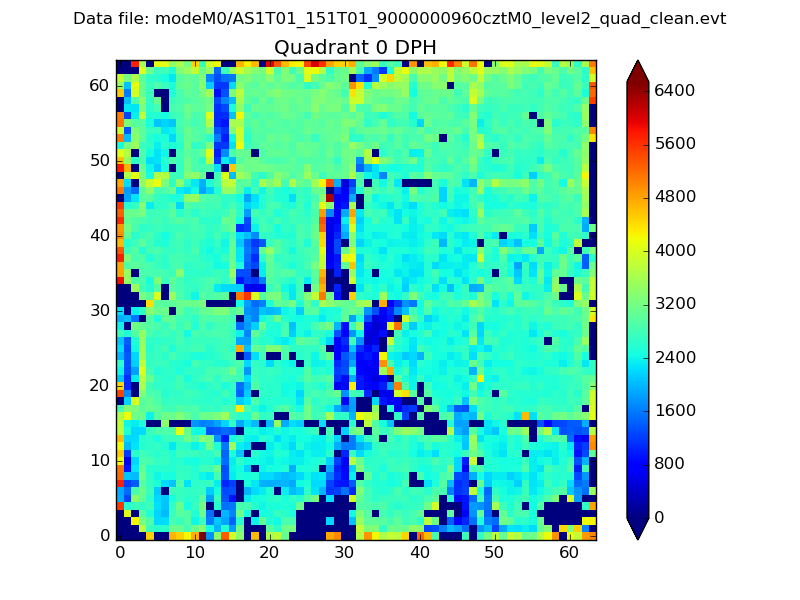 |
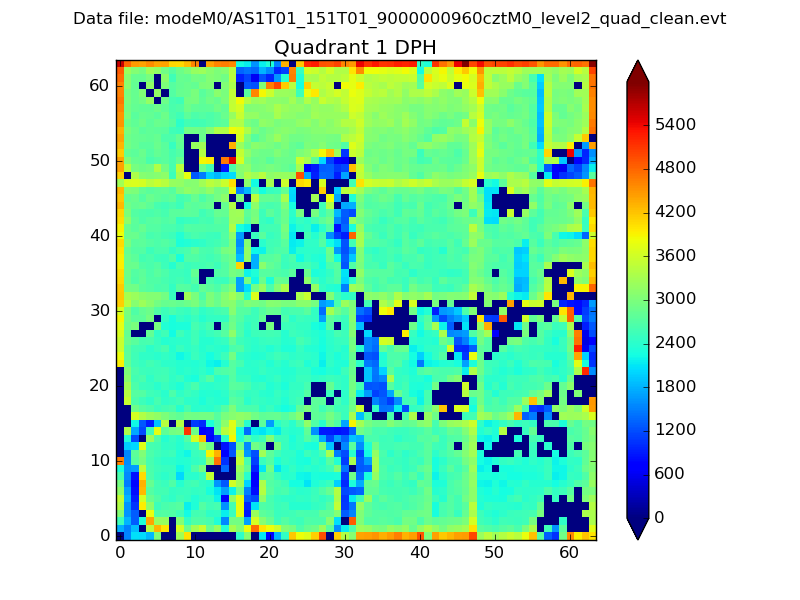 |
Quadrant B |
|---|---|---|---|
| Quadrant D |  |
 |
Quadrant C |
| Plot type | Count rate plots | Images |
|---|---|---|
| Comparison with Poisson distribution Blue bars denote a histogram of data divided into 1 sec bins. Red curve is a Poisson curve with rate = median count rate of data. |
 |
 |
| Quadrant-wise count rates Data is divided into 100 sec bins |
 |
|
| Module-wise count rates for Quadrant A Data is divided into 100 sec bins |
 |
 |
| Module-wise count rates for Quadrant B Data is divided into 100 sec bins |
 |
 |
| Module-wise count rates for Quadrant C Data is divided into 100 sec bins |
 |
 |
| Module-wise count rates for Quadrant D Data is divided into 100 sec bins |
 |
 |
| Parameter | Plot |
|---|---|
| CZT HV Monitor |  |
| D_VDD |  |
| Temperature 1 |  |
| Veto HV Monitor |  |
| Veto LLD |  |
| Alpha Counter |  |
| _CPM_Rate |  |
| CZT Counter |  |
| +2.5 Volts monitor |  |
| +5 Volts monitor |  |
| _ROLL_ROT |  |
| _Roll_DEC | 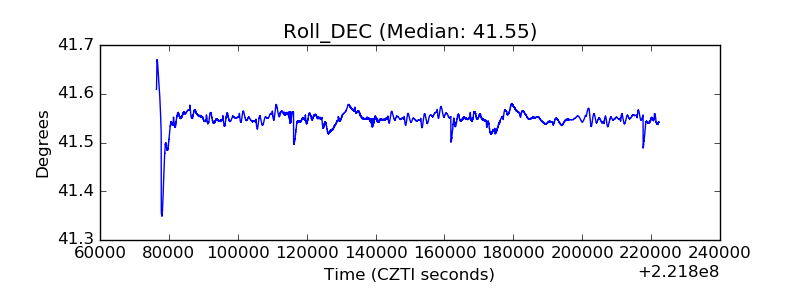 |
| _Roll_RA |  |
| Veto Counter |  |