| Param | Original file | Final file |
|---|---|---|
| Filename | modeM0/AS1T01_151T01_9000000960_06985cztM0_level2.evt | modeM0/AS1T01_151T01_9000000960_06985cztM0_level2_quad_clean.evt |
| Size (bytes) | 448,341,120 | 77,973,120 |
| Size | 427.6 MB | 74.4 MB |
| Events in quadrant A | 3,199,165 | 473,428 |
| Events in quadrant B | 3,386,900 | 474,403 |
| Events in quadrant C | 3,128,647 | 465,833 |
| Events in quadrant D | 3,381,682 | 454,202 |
| Mode SS | |||
|---|---|---|---|
| Quadrant | BADHDUFLAG | Total packets | Discarded packets |
| A | 0 | 146 | 0 |
| B | 0 | 146 | 0 |
| C | 0 | 146 | 0 |
| D | 0 | 146 | 0 |
| Mode M9 | |||
|---|---|---|---|
| Quadrant | BADHDUFLAG | Total packets | Discarded packets |
| A | 0 | 15 | 0 |
| B | 0 | 15 | 0 |
| C | 0 | 15 | 0 |
| D | 0 | 15 | 0 |
| Mode M0 | |||
|---|---|---|---|
| Quadrant | BADHDUFLAG | Total packets | Discarded packets |
| A | 0 | 14442 | 3 |
| B | 0 | 14861 | 2 |
| C | 0 | 14318 | 2 |
| D | 0 | 14823 | 2 |
| Quadrant | Total seconds | Saturated seconds | Saturation percentage |
|---|---|---|---|
| A | 7081 | 28 | 0.395424% |
| B | 7081 | 37 | 0.522525% |
| C | 7081 | 23 | 0.324813% |
| D | 7081 | 32 | 0.451914% |
Noise dominated data is calculated using 1-second bins in cleaned event files. If a bin has >2000 counts, and if more than 50% of those come from <1% of pixels, then it is considered to be noise-dominated and hence unusable.
| Quadrant | # 1 sec bins | Bins with >0 counts | Bins with >2000 counts | High rate bins dominated by noise | Noise dominated (total time) | Noise dominated (detector-on time) | Marked lightcurve |
|---|---|---|---|---|---|---|---|
| A | 7936 | 7082 | 3 | 3 | 0.04% | 0.04% | 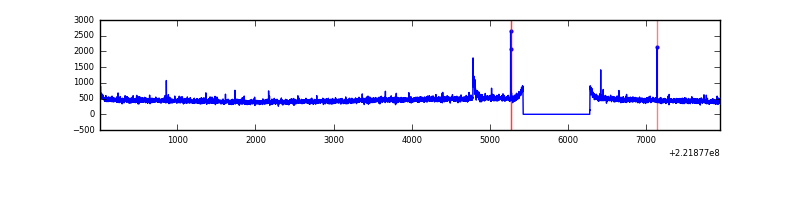 |
| B | 7936 | 7082 | 2 | 2 | 0.03% | 0.03% | 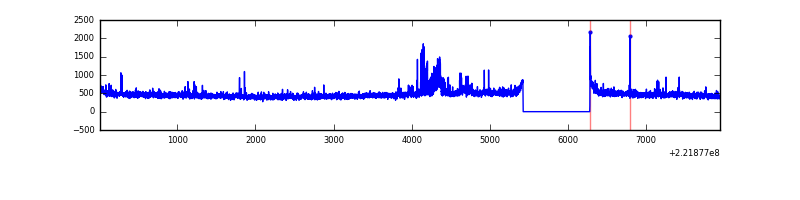 |
| C | 7936 | 7082 | 0 | 0 | 0.00% | 0.00% | 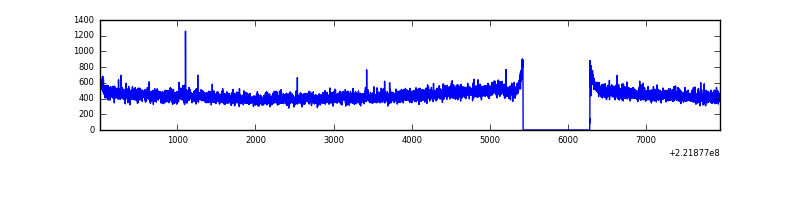 |
| D | 7936 | 7082 | 15 | 15 | 0.19% | 0.21% | 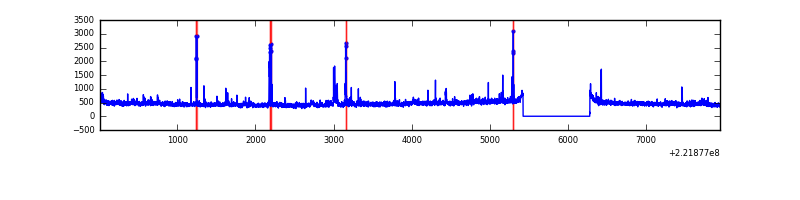 |
Top three noisy pixels from each quadrant. If the there are fewer than three noisy pixels in the level2.evt file, extra rows are filled as -1
| Pixel properties | Quadrant properties | ||||||
|---|---|---|---|---|---|---|---|
| Quadrant | DetID | PixID | Counts | Sigma | Mean | Median | Sigma |
| A | 13 | 14 | 25124 | 146.96 | 814 | 796 | 165.5 |
| A | 15 | 174 | 24184 | 141.28 | 814 | 796 | 165.5 |
| A | 4 | 2 | 14189 | 80.9 | 814 | 796 | 165.5 |
| B | 4 | 173 | 69214 | 427.6 | 823 | 799 | 160.0 |
| B | 0 | 214 | 60295 | 371.86 | 823 | 799 | 160.0 |
| B | 0 | 219 | 43326 | 265.8 | 823 | 799 | 160.0 |
| C | 10 | 22 | 14392 | 73.31 | 796 | 800 | 185.4 |
| C | 13 | 61 | 6133 | 28.76 | 796 | 800 | 185.4 |
| C | 12 | 4 | 3953 | 17.0 | 796 | 800 | 185.4 |
| D | 8 | 195 | 194418 | 991.63 | 796 | 769 | 195.3 |
| D | 2 | 136 | 116881 | 594.58 | 796 | 769 | 195.3 |
| D | 13 | 169 | 32034 | 160.1 | 796 | 769 | 195.3 |
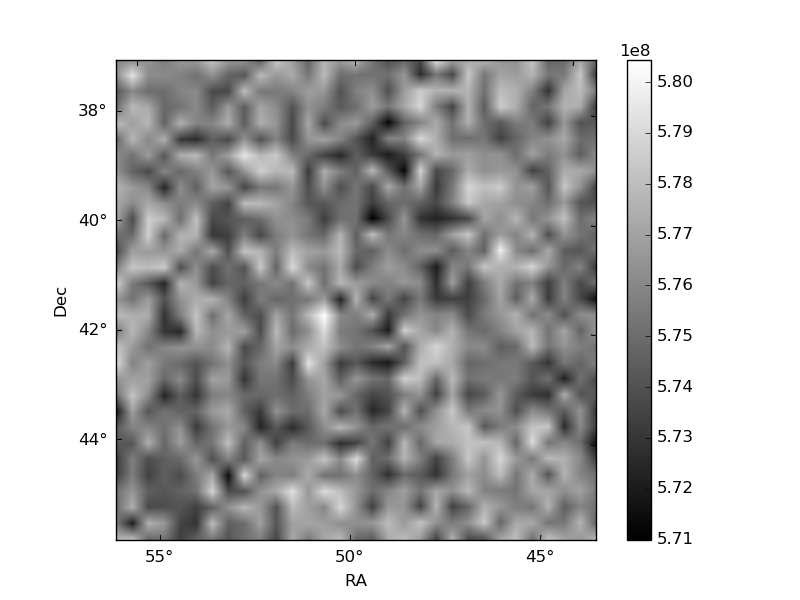
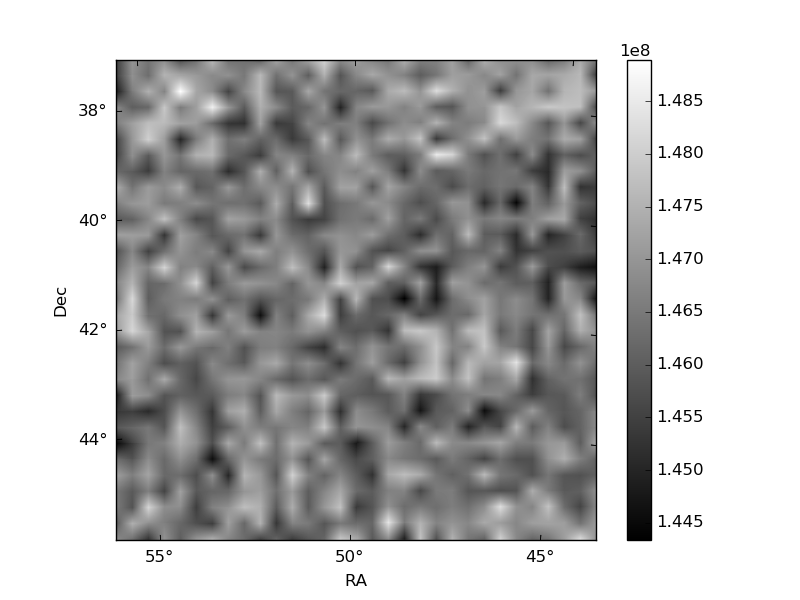
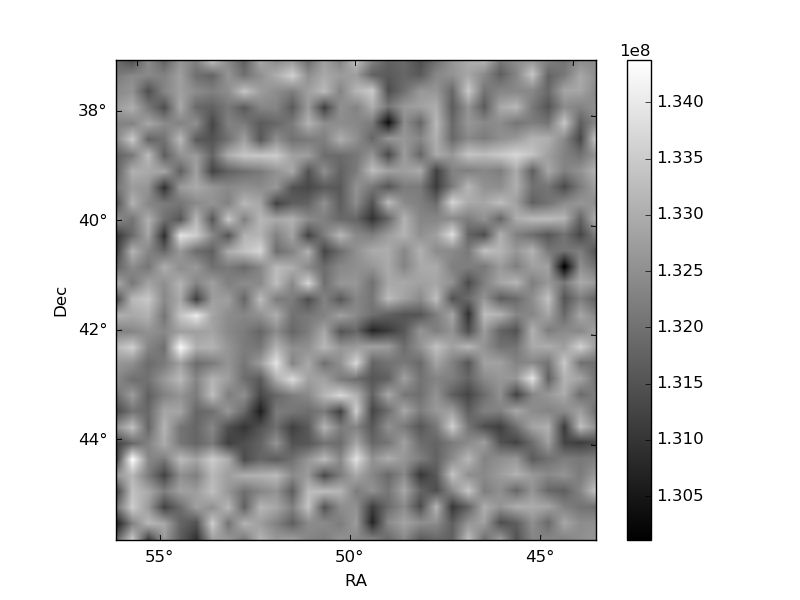
Histogram calculated using DETX and DETY for each event in the final _common_clean file
| Quadrant A | 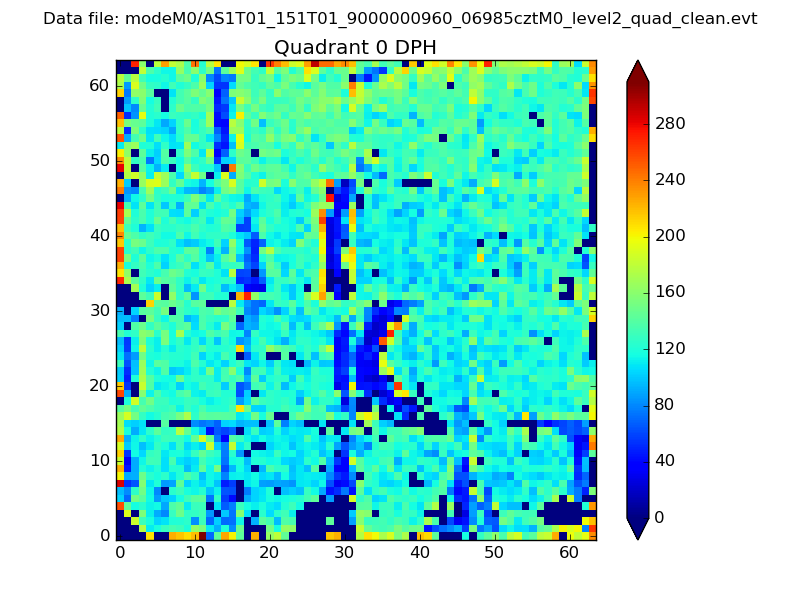 |
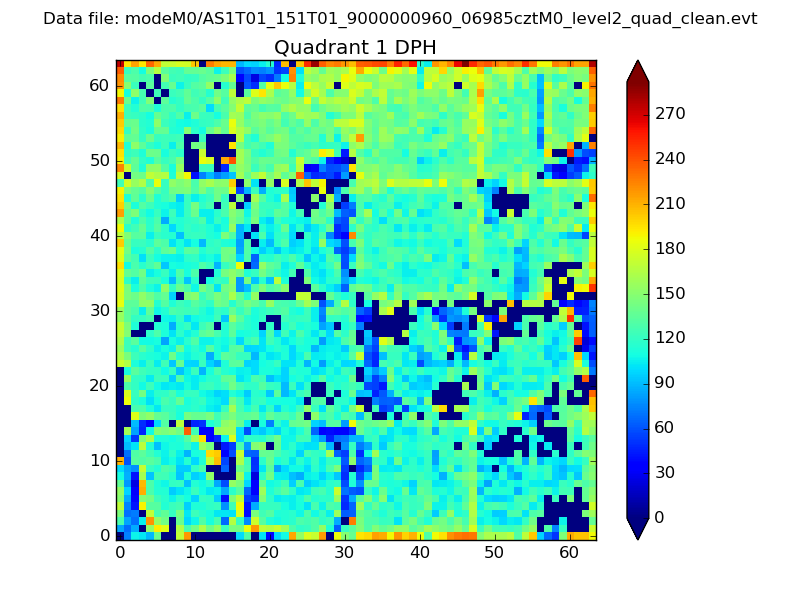 |
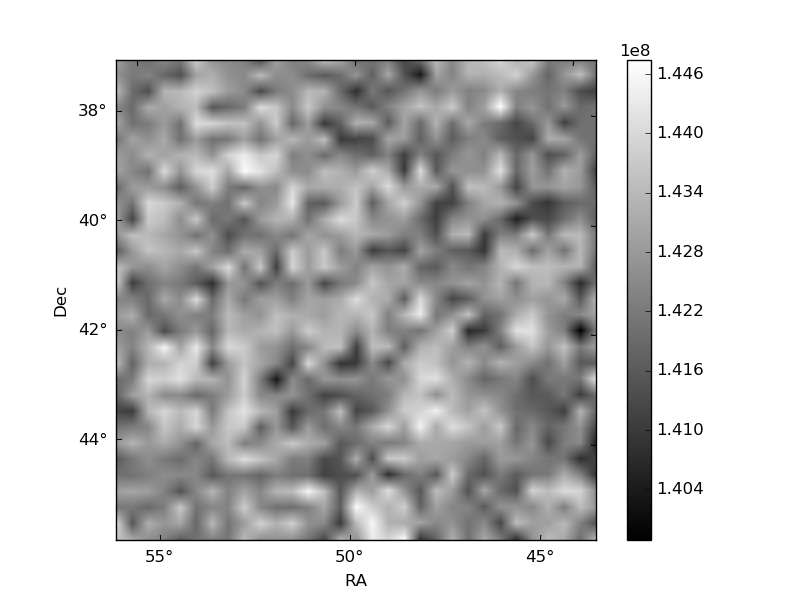
Quadrant B |
|---|---|---|---|
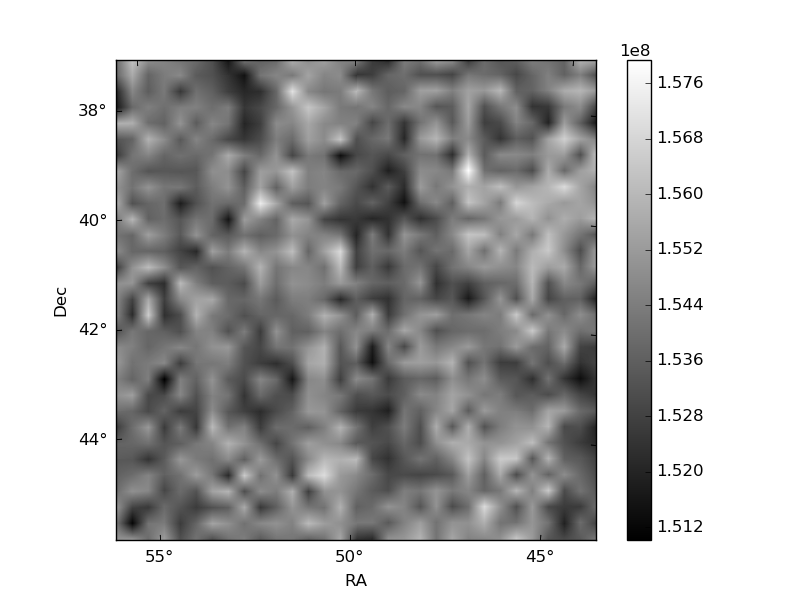
| Quadrant D | 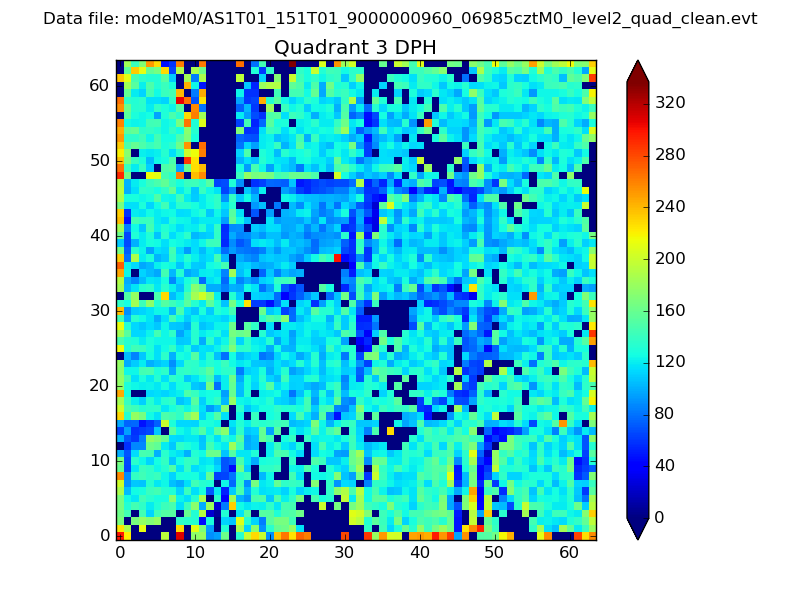 |
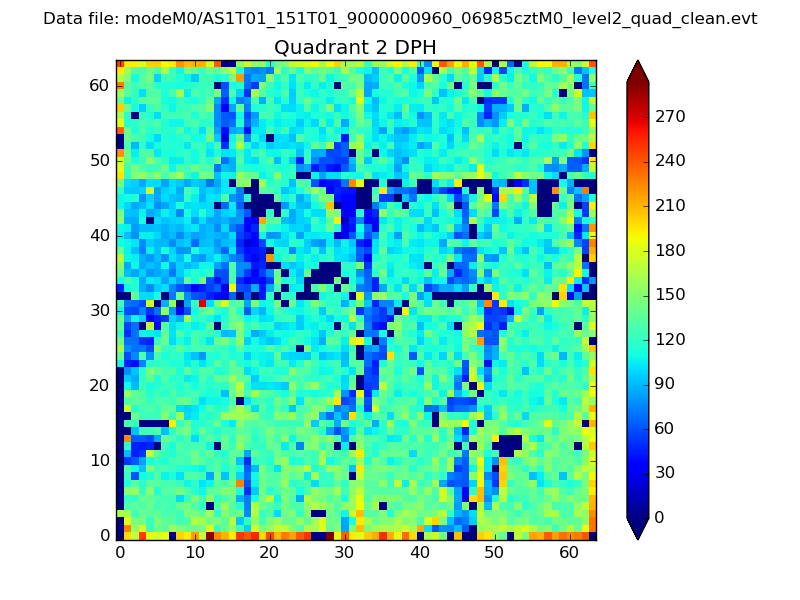 |
Quadrant C |
| Plot type | Count rate plots | Images |
|---|---|---|
| Comparison with Poisson distribution Blue bars denote a histogram of data divided into 1 sec bins. Red curve is a Poisson curve with rate = median count rate of data. |
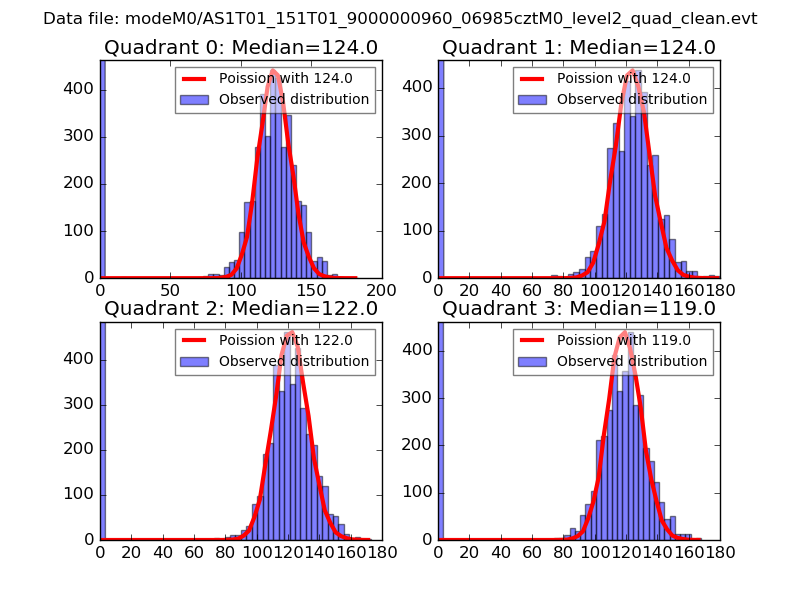 |
 |
| Quadrant-wise count rates Data is divided into 100 sec bins |
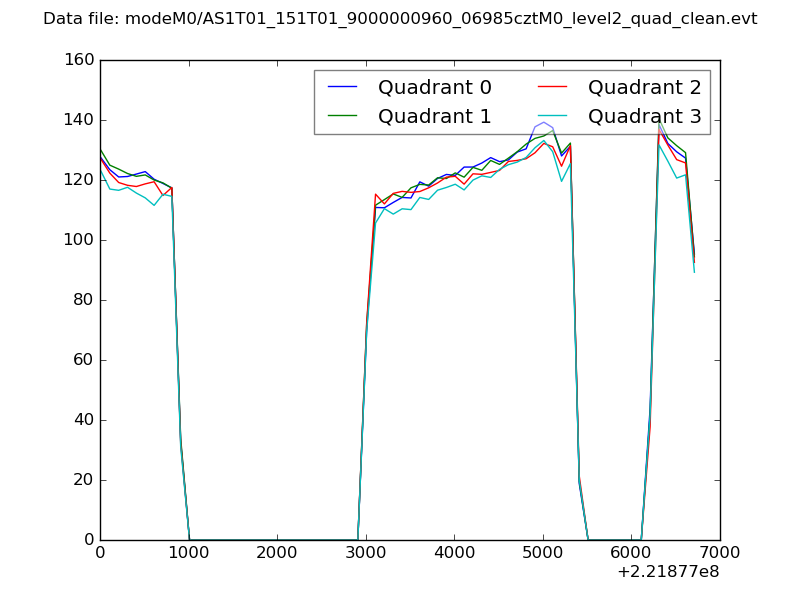 |
|
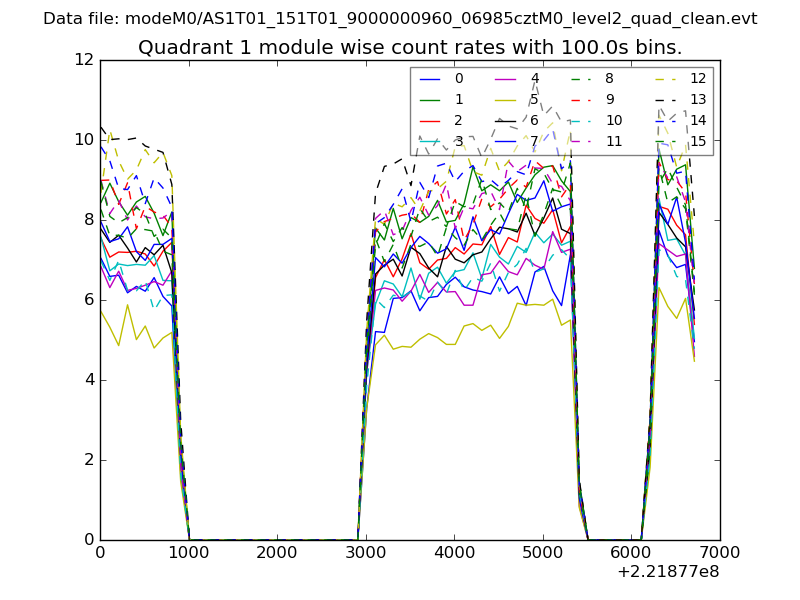
| Module-wise count rates for Quadrant A Data is divided into 100 sec bins |
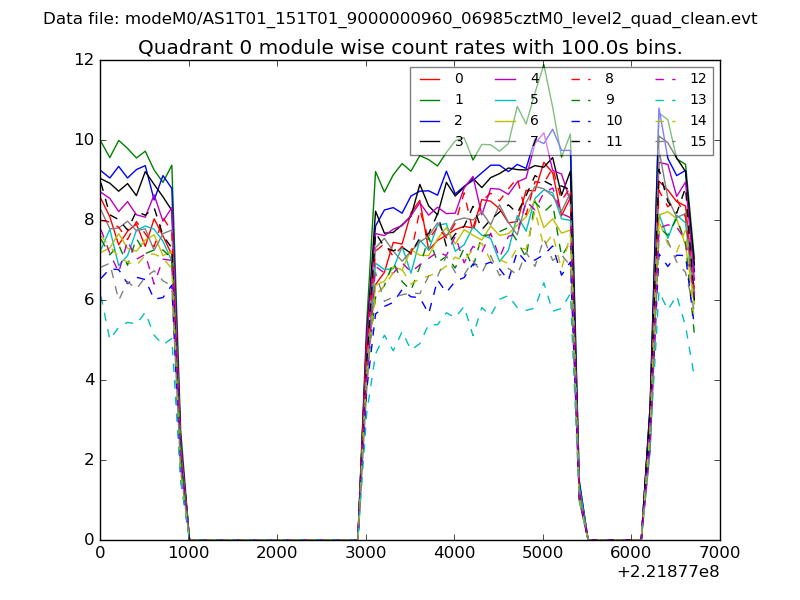 |
 |
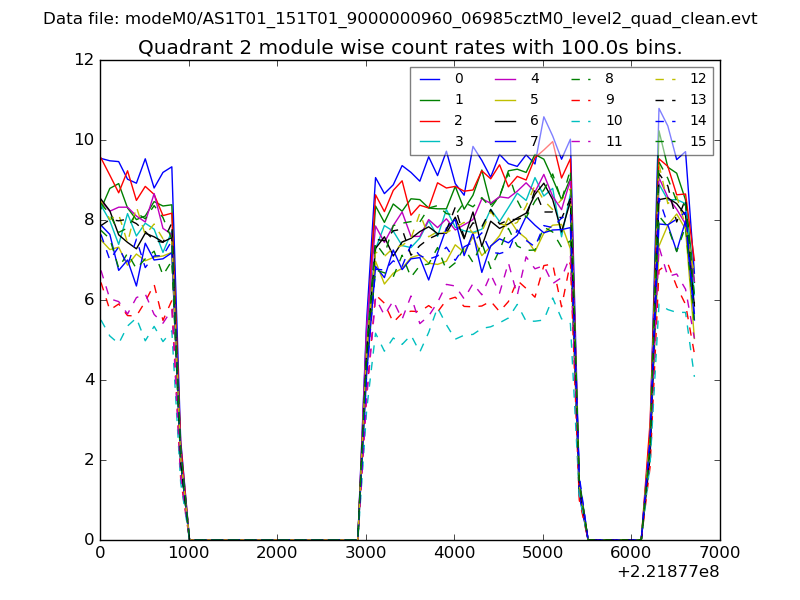
| Module-wise count rates for Quadrant B Data is divided into 100 sec bins |
 |
 |
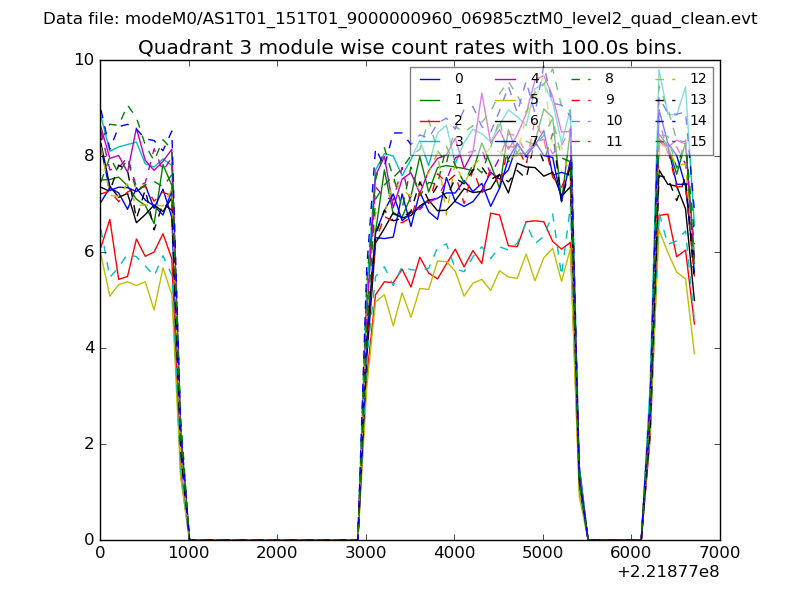
| Module-wise count rates for Quadrant C Data is divided into 100 sec bins |
 |
 |
| Module-wise count rates for Quadrant D Data is divided into 100 sec bins |
 |
 |
| Parameter | Plot |
|---|---|
| CZT HV Monitor | 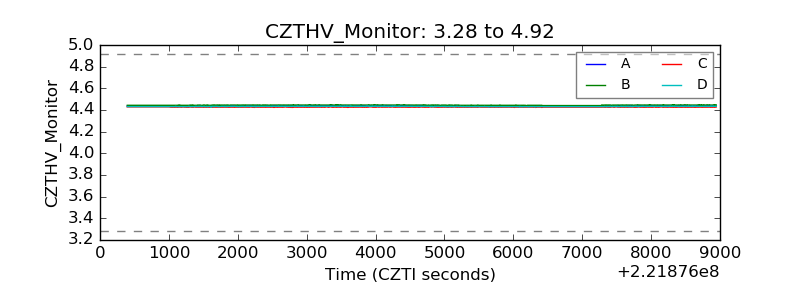 |
| D_VDD | 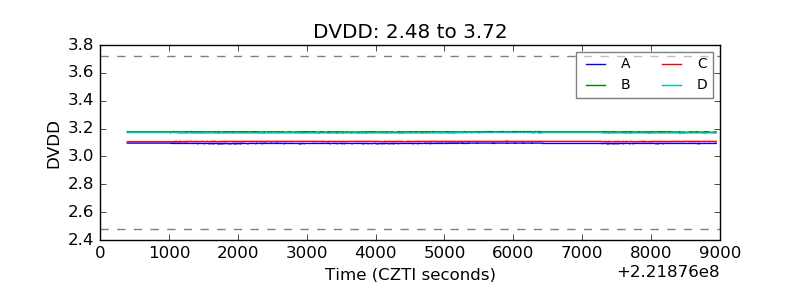 |
| Temperature 1 | 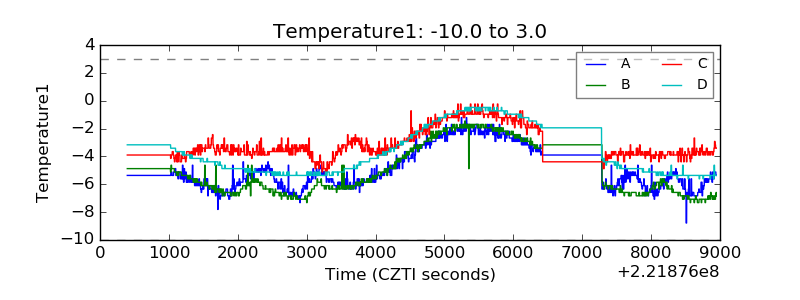 |
| Veto HV Monitor | 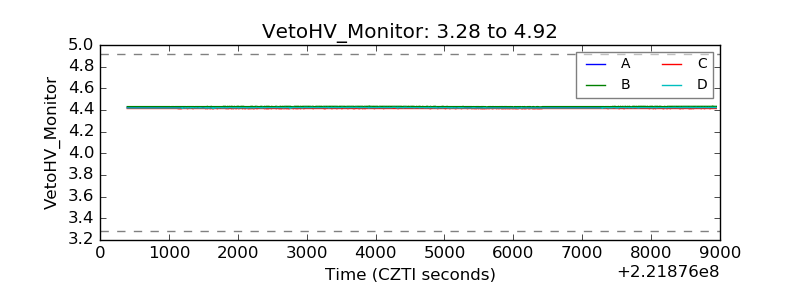 |
| Veto LLD | 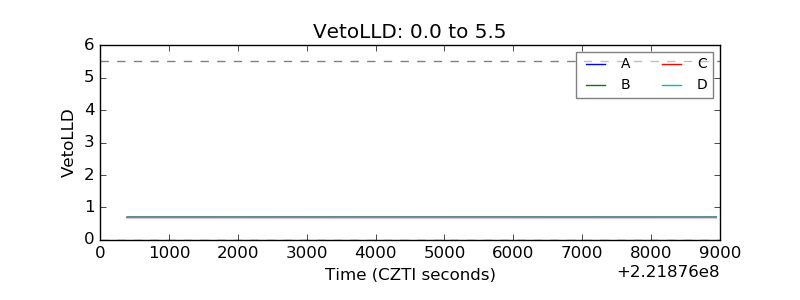 |
| Alpha Counter | 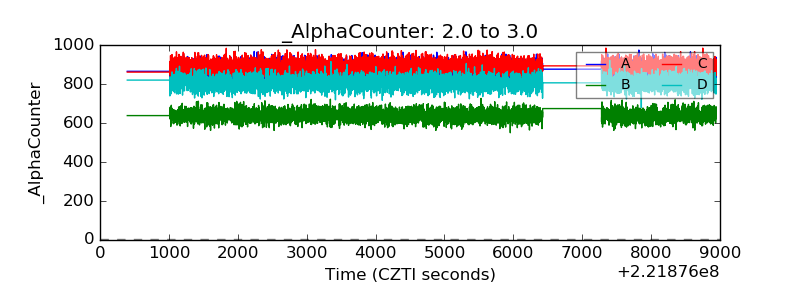 |
| _CPM_Rate | 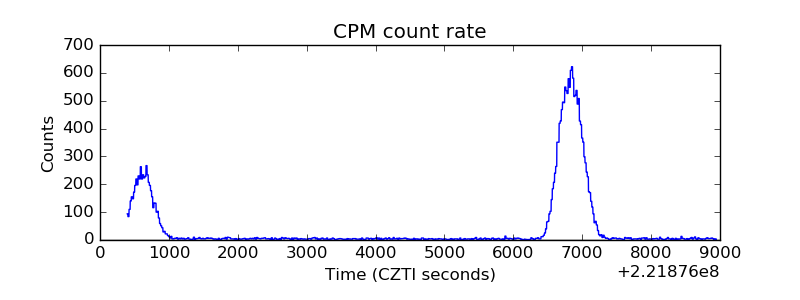 |
| CZT Counter | 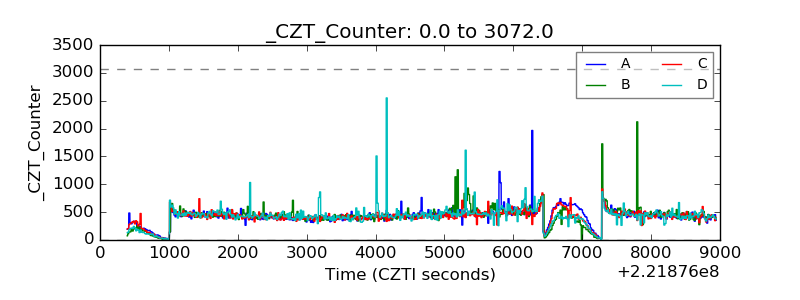 |
| +2.5 Volts monitor | 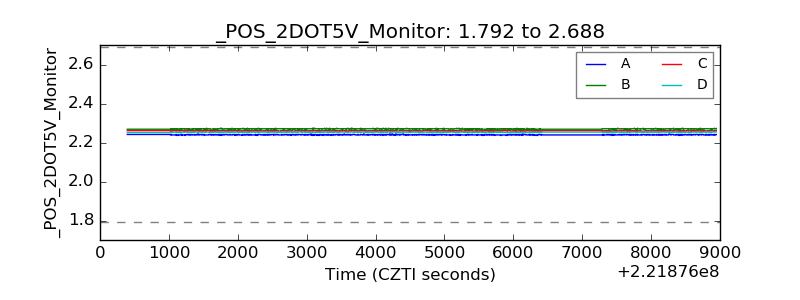 |
| +5 Volts monitor | 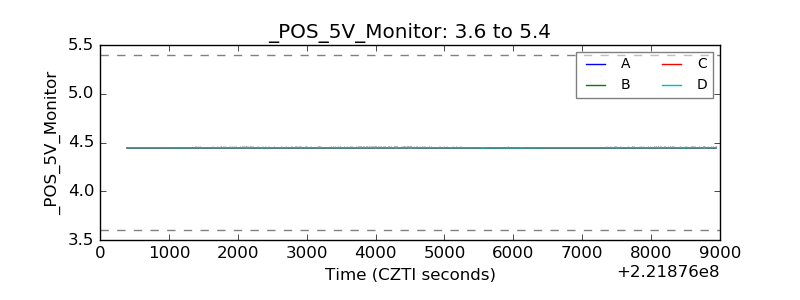 |
| _ROLL_ROT | 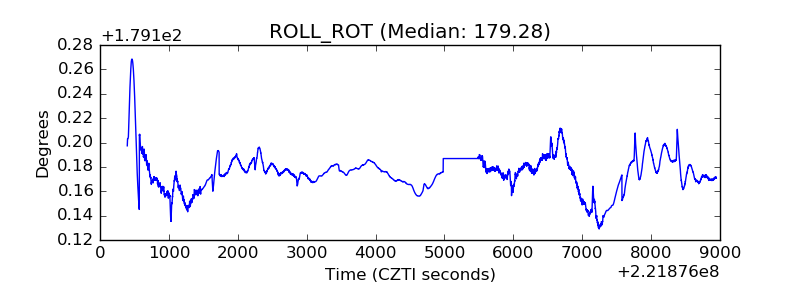 |
| _Roll_DEC | 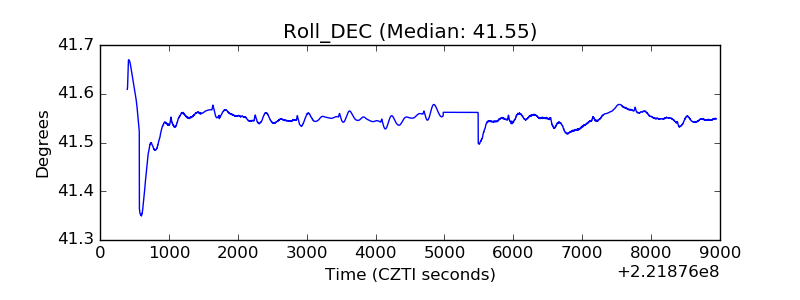 |
| _Roll_RA | 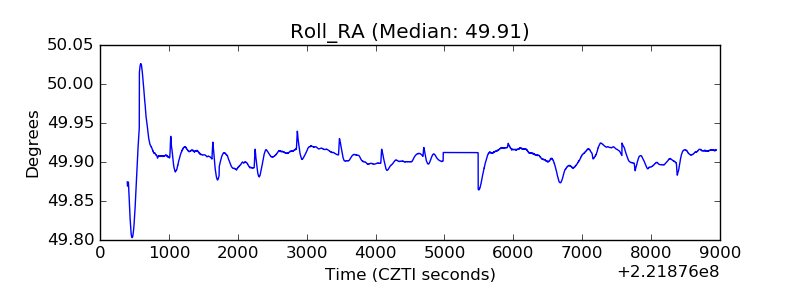 |
| Veto Counter | 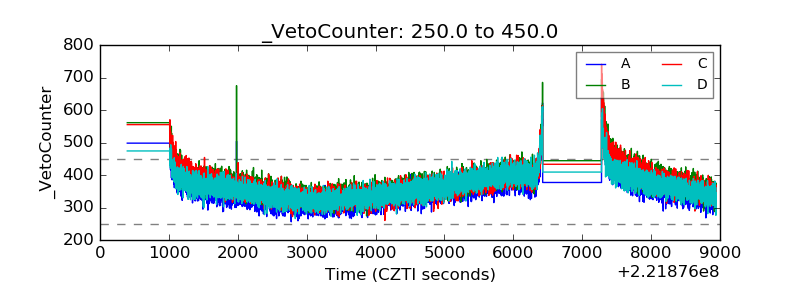 |