| Param | Original file | Final file |
|---|---|---|
| Filename | modeM0/AS1T01_151T01_9000000960_06986cztM0_level2.evt | modeM0/AS1T01_151T01_9000000960_06986cztM0_level2_quad_clean.evt |
| Size (bytes) | 804,709,440 | 132,975,360 |
| Size | 767.4 MB | 126.8 MB |
| Events in quadrant A | 6,155,565 | 789,583 |
| Events in quadrant B | 5,848,174 | 812,289 |
| Events in quadrant C | 5,625,740 | 796,963 |
| Events in quadrant D | 5,908,889 | 778,904 |
| Mode SS | |||
|---|---|---|---|
| Quadrant | BADHDUFLAG | Total packets | Discarded packets |
| A | 0 | 252 | 0 |
| B | 0 | 252 | 0 |
| C | 0 | 252 | 0 |
| D | 0 | 252 | 0 |
| Mode M9 | |||
|---|---|---|---|
| Quadrant | BADHDUFLAG | Total packets | Discarded packets |
| A | 0 | 25 | 0 |
| B | 0 | 25 | 0 |
| C | 0 | 25 | 0 |
| D | 0 | 25 | 0 |
| Mode M0 | |||
|---|---|---|---|
| Quadrant | BADHDUFLAG | Total packets | Discarded packets |
| A | 0 | 26818 | 4 |
| B | 0 | 25627 | 3 |
| C | 0 | 25387 | 3 |
| D | 0 | 25715 | 3 |
| Quadrant | Total seconds | Saturated seconds | Saturation percentage |
|---|---|---|---|
| A | 12282 | 304 | 2.475167% |
| B | 12282 | 72 | 0.586224% |
| C | 12282 | 42 | 0.341964% |
| D | 12282 | 40 | 0.325680% |
Noise dominated data is calculated using 1-second bins in cleaned event files. If a bin has >2000 counts, and if more than 50% of those come from <1% of pixels, then it is considered to be noise-dominated and hence unusable.
| Quadrant | # 1 sec bins | Bins with >0 counts | Bins with >2000 counts | High rate bins dominated by noise | Noise dominated (total time) | Noise dominated (detector-on time) | Marked lightcurve |
|---|---|---|---|---|---|---|---|
| A | 14152 | 12284 | 201 | 201 | 1.42% | 1.64% | 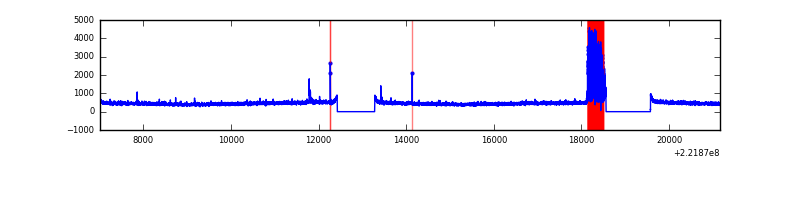 |
| B | 14152 | 12284 | 5 | 5 | 0.04% | 0.04% | 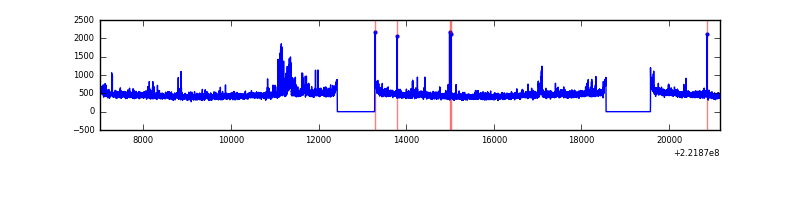 |
| C | 14152 | 12284 | 0 | 0 | 0.00% | 0.00% | 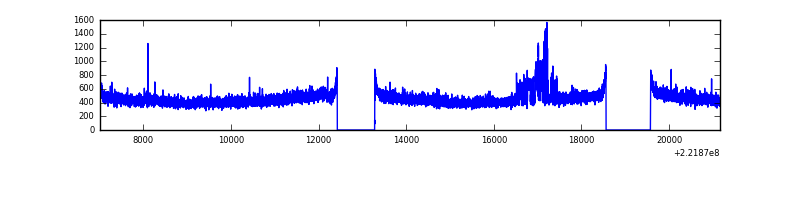 |
| D | 14152 | 12284 | 15 | 15 | 0.11% | 0.12% | 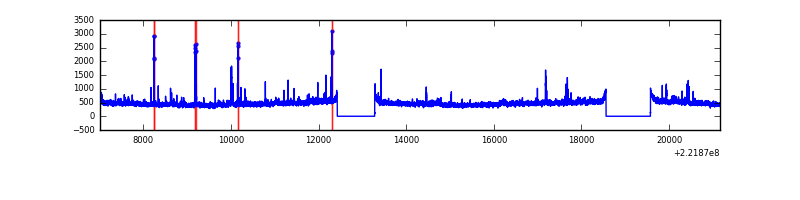 |
Top three noisy pixels from each quadrant. If the there are fewer than three noisy pixels in the level2.evt file, extra rows are filled as -1
| Pixel properties | Quadrant properties | ||||||
|---|---|---|---|---|---|---|---|
| Quadrant | DetID | PixID | Counts | Sigma | Mean | Median | Sigma |
| A | 14 | 239 | 660665 | 2297.12 | 1409 | 1376 | 287.0 |
| A | 13 | 14 | 31928 | 106.45 | 1409 | 1376 | 287.0 |
| A | 15 | 174 | 24944 | 82.12 | 1409 | 1376 | 287.0 |
| B | 0 | 214 | 87502 | 312.99 | 1438 | 1399 | 275.1 |
| B | 4 | 173 | 78506 | 280.29 | 1438 | 1399 | 275.1 |
| B | 0 | 219 | 67430 | 240.03 | 1438 | 1399 | 275.1 |
| C | 10 | 22 | 192782 | 595.96 | 1389 | 1394 | 321.1 |
| C | 13 | 61 | 10875 | 29.52 | 1389 | 1394 | 321.1 |
| C | 12 | 4 | 7353 | 18.56 | 1389 | 1394 | 321.1 |
| D | 8 | 195 | 431161 | 1260.94 | 1392 | 1346 | 340.9 |
| D | 2 | 136 | 136859 | 397.55 | 1392 | 1346 | 340.9 |
| D | 13 | 169 | 52047 | 148.74 | 1392 | 1346 | 340.9 |
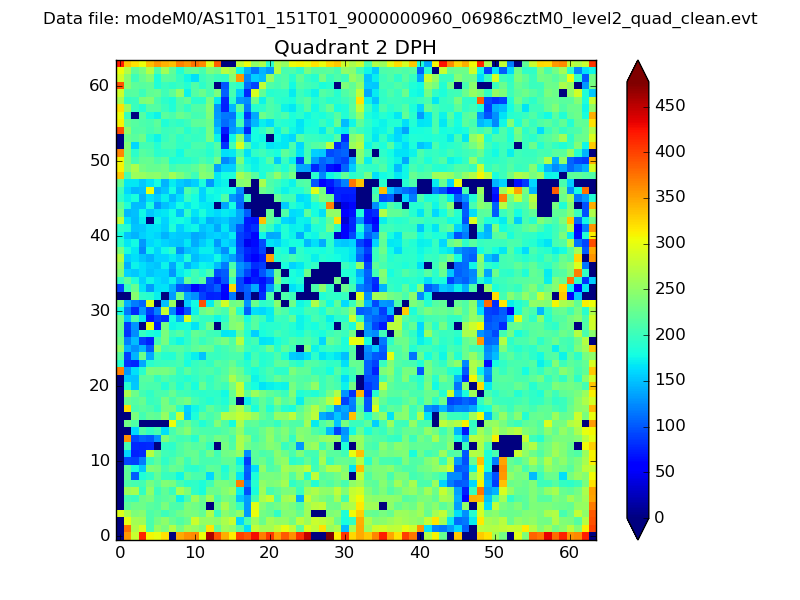
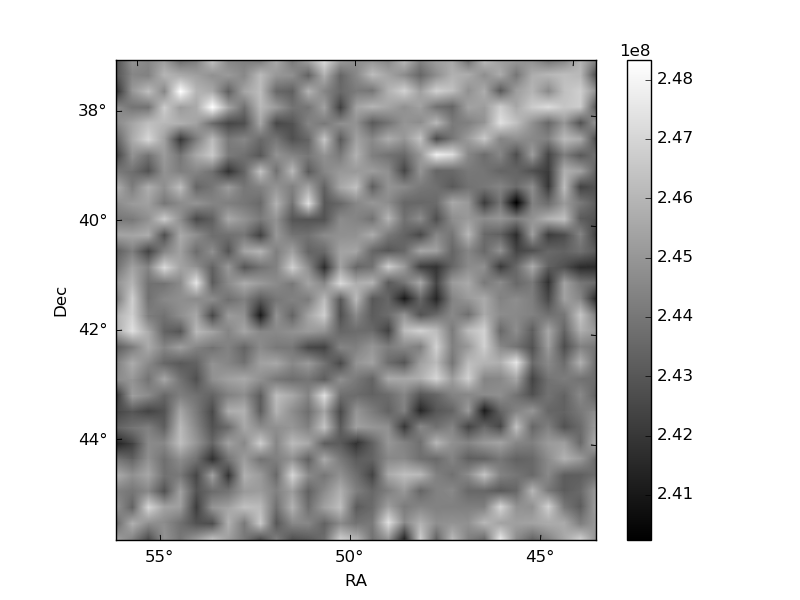
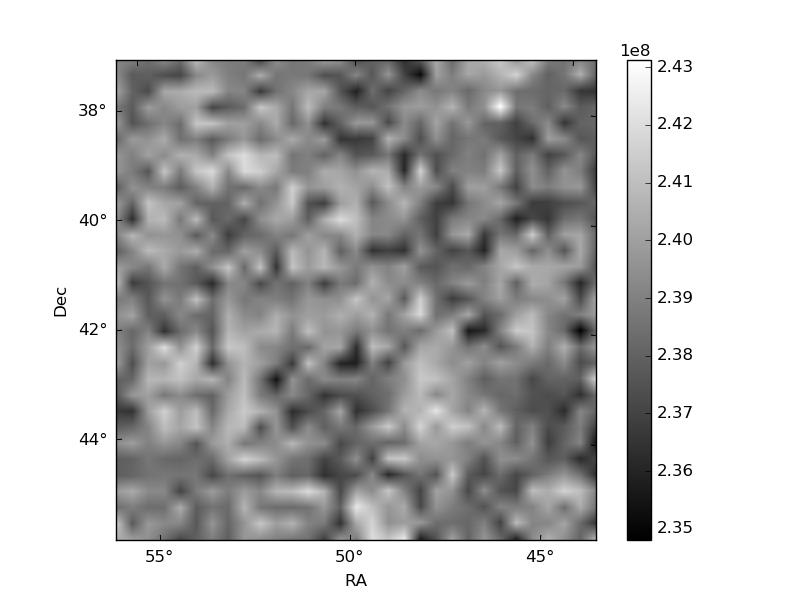
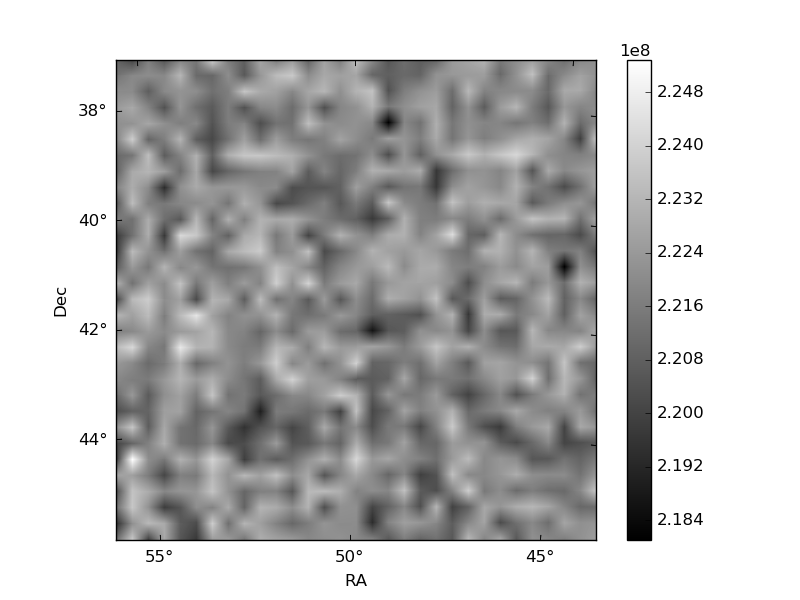
Histogram calculated using DETX and DETY for each event in the final _common_clean file
| Quadrant A | 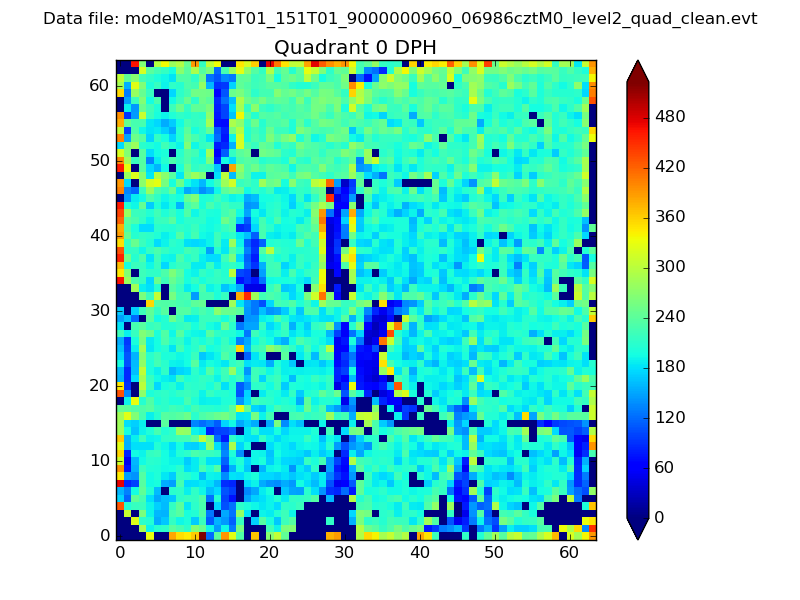 |
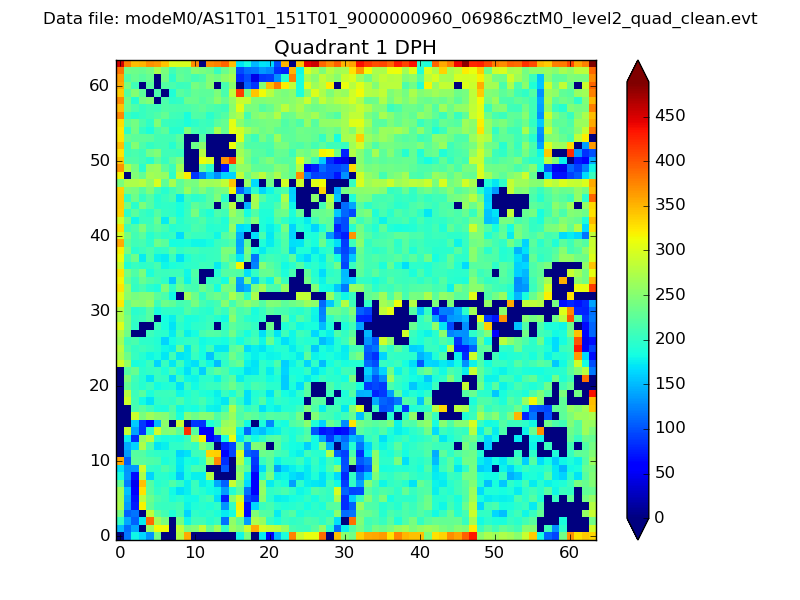 |
Quadrant B |
|---|---|---|---|
| Quadrant D | 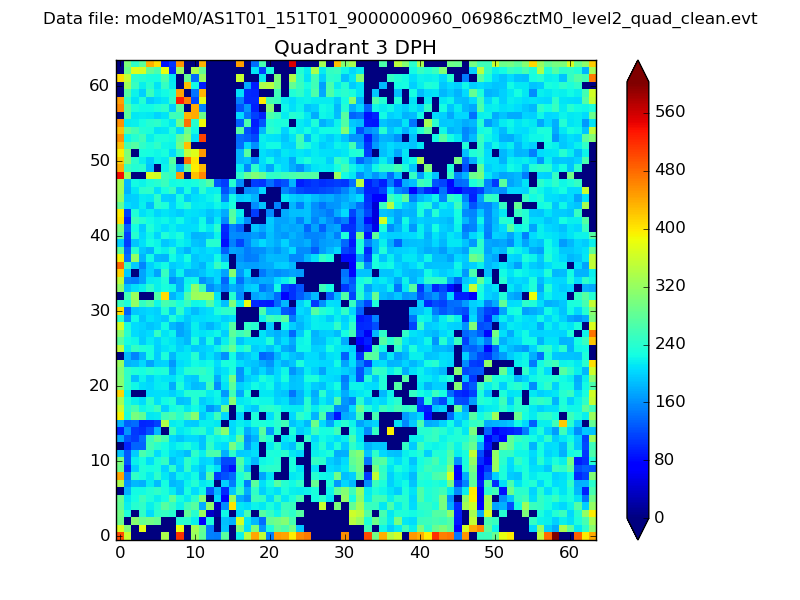 |
 |
Quadrant C |
| Plot type | Count rate plots | Images |
|---|---|---|
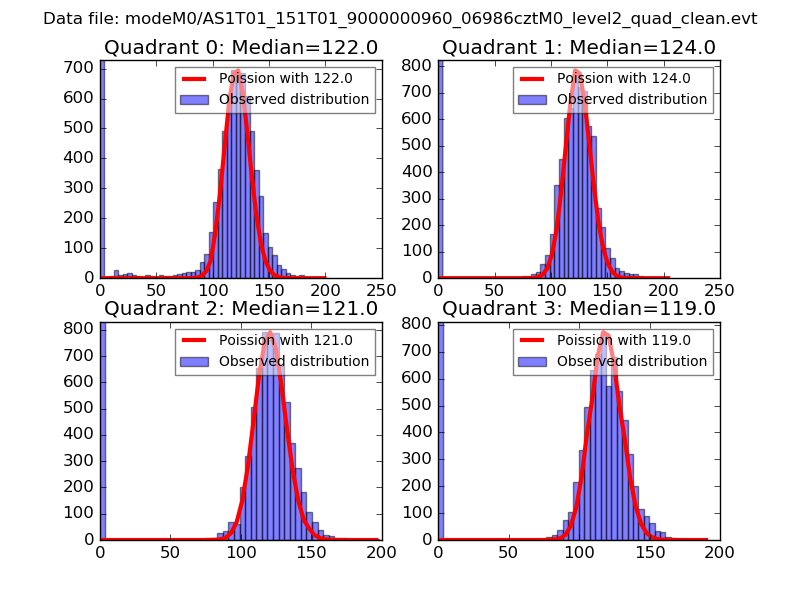
| Comparison with Poisson distribution Blue bars denote a histogram of data divided into 1 sec bins. Red curve is a Poisson curve with rate = median count rate of data. |
 |
 |
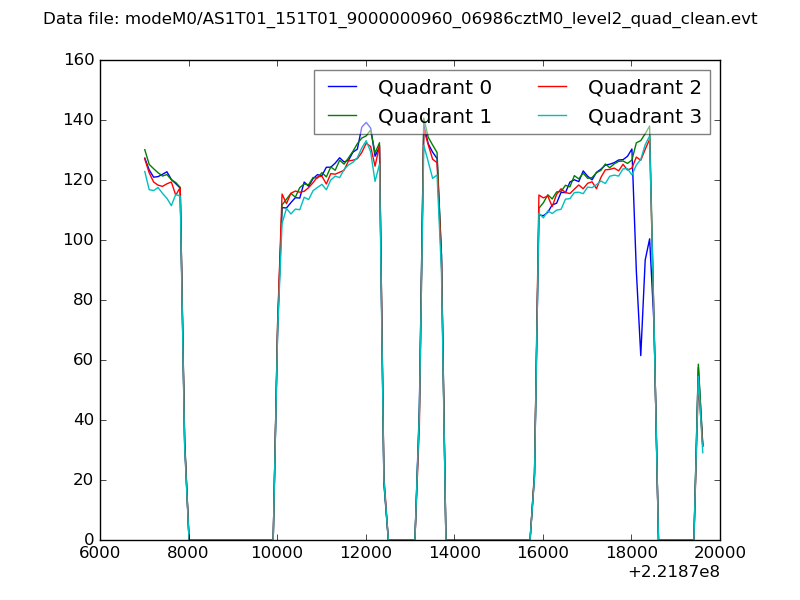
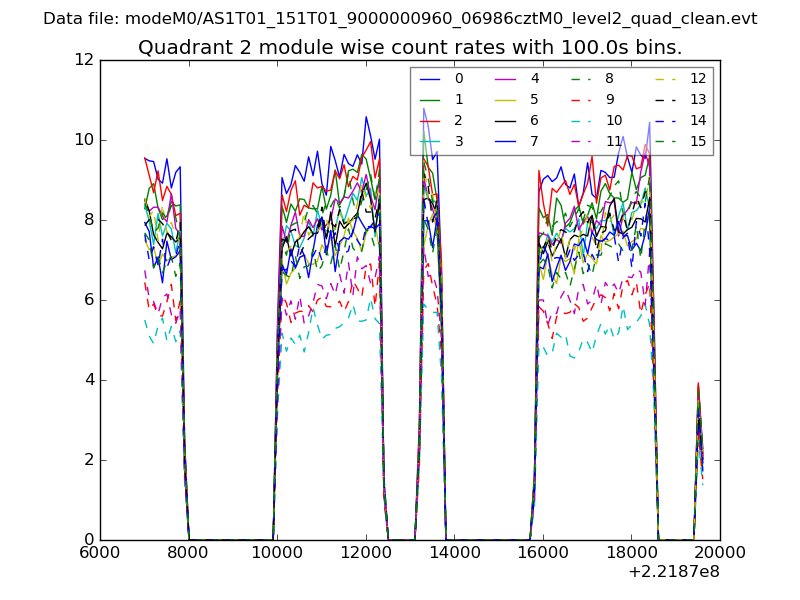
| Quadrant-wise count rates Data is divided into 100 sec bins |
 |
|
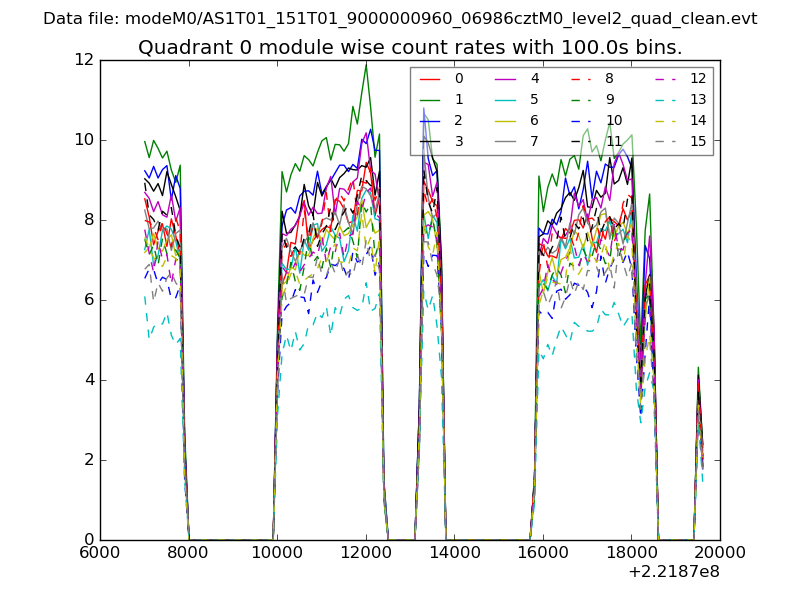
| Module-wise count rates for Quadrant A Data is divided into 100 sec bins |
 |
 |
| Module-wise count rates for Quadrant B Data is divided into 100 sec bins |
 |
 |
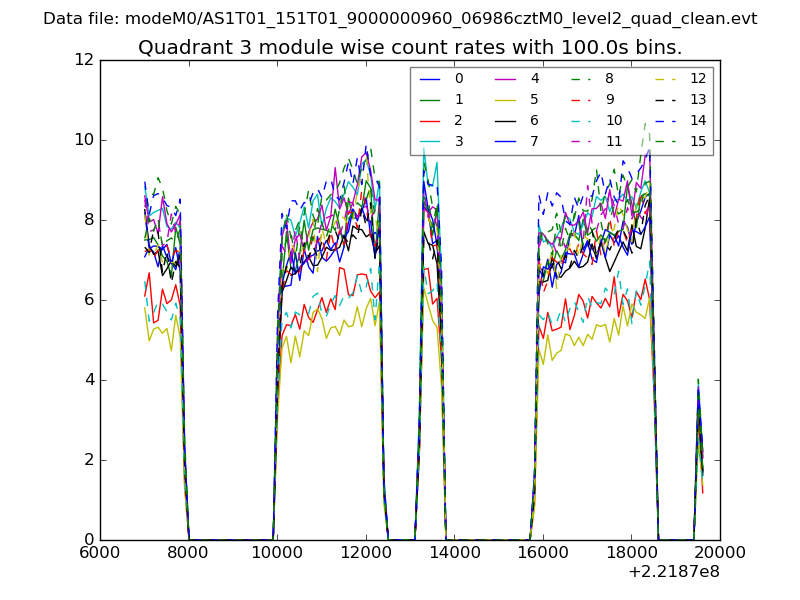
| Module-wise count rates for Quadrant C Data is divided into 100 sec bins |
 |
 |
| Module-wise count rates for Quadrant D Data is divided into 100 sec bins |
 |
 |
| Parameter | Plot |
|---|---|
| CZT HV Monitor |  |
| D_VDD | 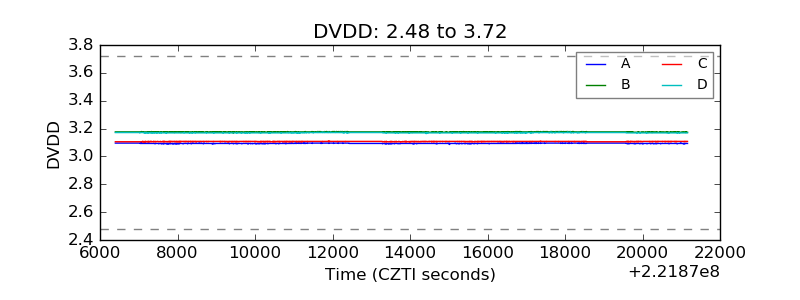 |
| Temperature 1 | 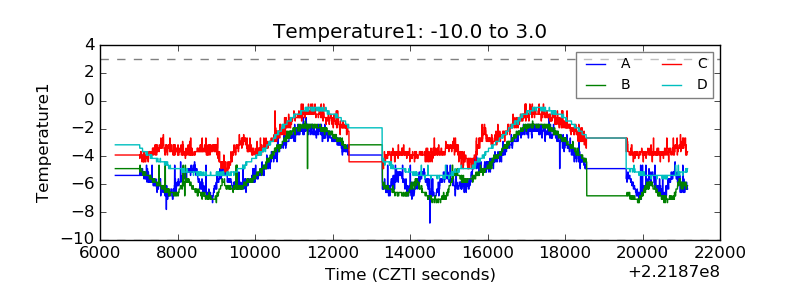 |
| Veto HV Monitor | 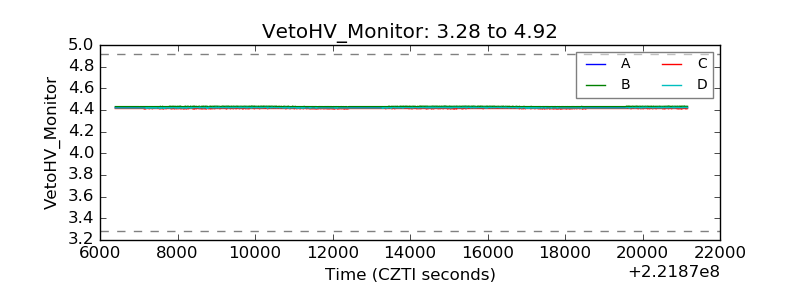 |
| Veto LLD | 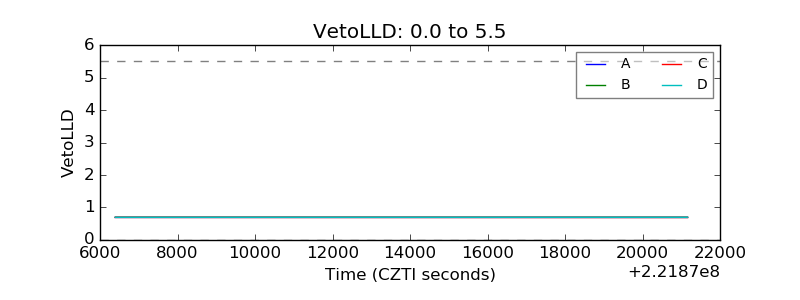 |
| Alpha Counter | 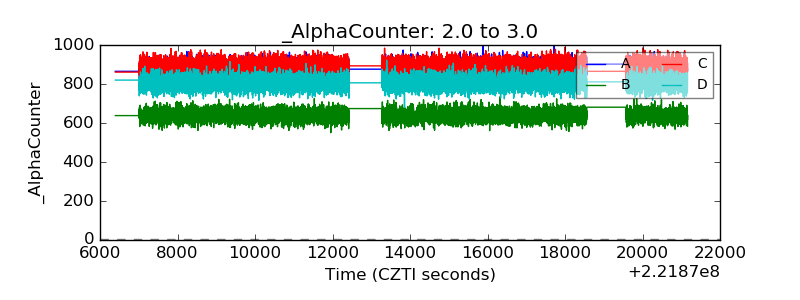 |
| _CPM_Rate | 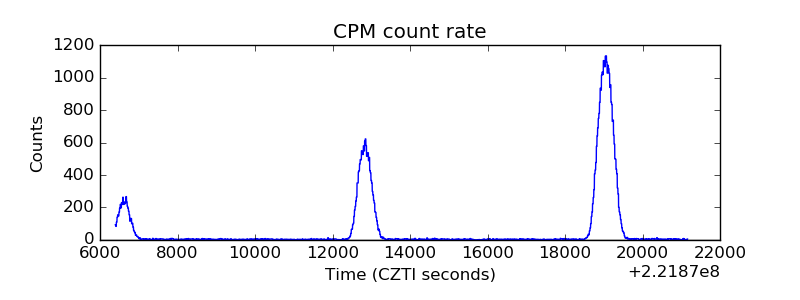 |
| CZT Counter | 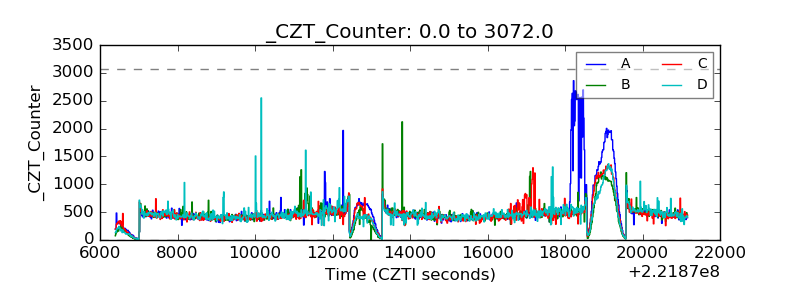 |
| +2.5 Volts monitor |  |
| +5 Volts monitor | 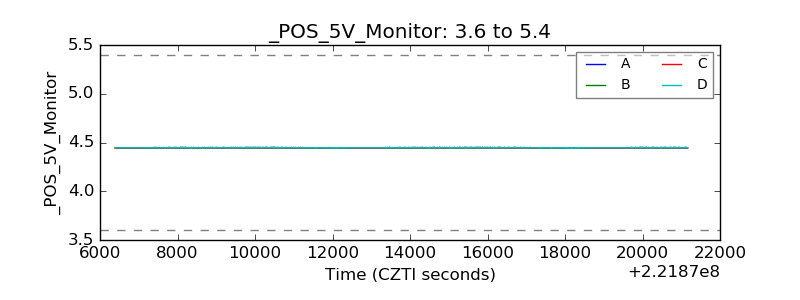 |
| _ROLL_ROT | 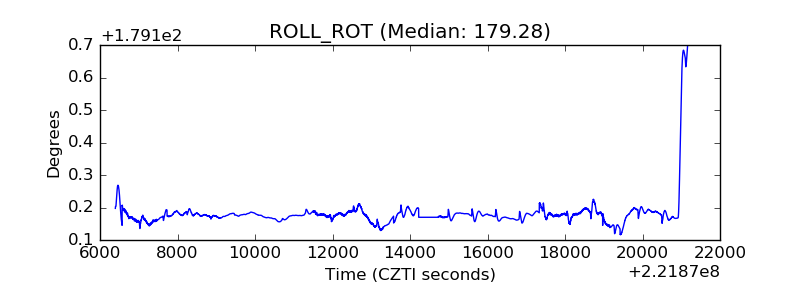 |
| _Roll_DEC | 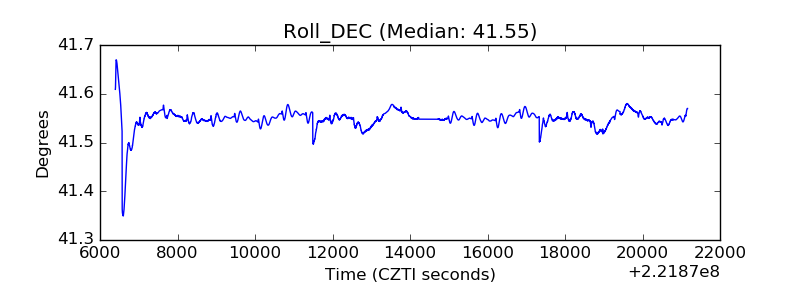 |
| _Roll_RA | 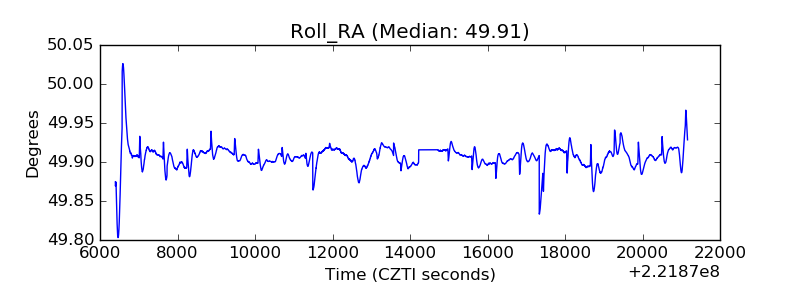 |
| Veto Counter | 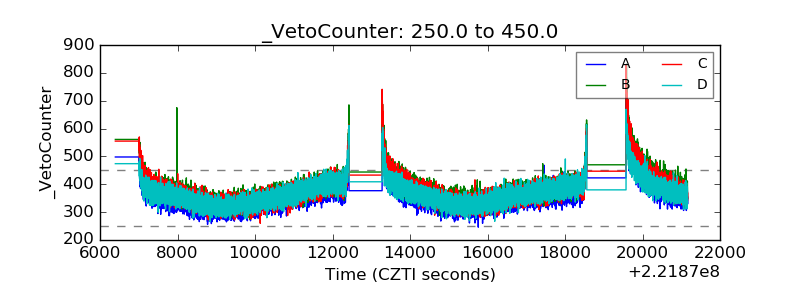 |