| Param | Original file | Final file |
|---|---|---|
| Filename | modeM0/AS1T01_151T01_9000000960_06989cztM0_level2.evt | modeM0/AS1T01_151T01_9000000960_06989cztM0_level2_quad_clean.evt |
| Size (bytes) | 437,425,920 | 69,655,680 |
| Size | 417.2 MB | 66.4 MB |
| Events in quadrant A | 3,120,759 | 421,524 |
| Events in quadrant B | 3,332,165 | 424,642 |
| Events in quadrant C | 3,028,643 | 415,441 |
| Events in quadrant D | 3,333,587 | 403,762 |
| Mode SS | |||
|---|---|---|---|
| Quadrant | BADHDUFLAG | Total packets | Discarded packets |
| A | 0 | 128 | 0 |
| B | 0 | 128 | 0 |
| C | 0 | 128 | 0 |
| D | 0 | 128 | 0 |
| Mode M9 | |||
|---|---|---|---|
| Quadrant | BADHDUFLAG | Total packets | Discarded packets |
| A | 0 | 13 | 0 |
| B | 0 | 13 | 0 |
| C | 0 | 13 | 0 |
| D | 0 | 14 | 0 |
| Mode M0 | |||
|---|---|---|---|
| Quadrant | BADHDUFLAG | Total packets | Discarded packets |
| A | 0 | 13247 | 3 |
| B | 0 | 13830 | 2 |
| C | 0 | 13148 | 2 |
| D | 0 | 13730 | 2 |
| Quadrant | Total seconds | Saturated seconds | Saturation percentage |
|---|---|---|---|
| A | 6362 | 67 | 1.053128% |
| B | 6362 | 76 | 1.194593% |
| C | 6362 | 37 | 0.581578% |
| D | 6362 | 46 | 0.723043% |
Noise dominated data is calculated using 1-second bins in cleaned event files. If a bin has >2000 counts, and if more than 50% of those come from <1% of pixels, then it is considered to be noise-dominated and hence unusable.
| Quadrant | # 1 sec bins | Bins with >0 counts | Bins with >2000 counts | High rate bins dominated by noise | Noise dominated (total time) | Noise dominated (detector-on time) | Marked lightcurve |
|---|---|---|---|---|---|---|---|
| A | 7592 | 6363 | 2 | 2 | 0.03% | 0.03% | 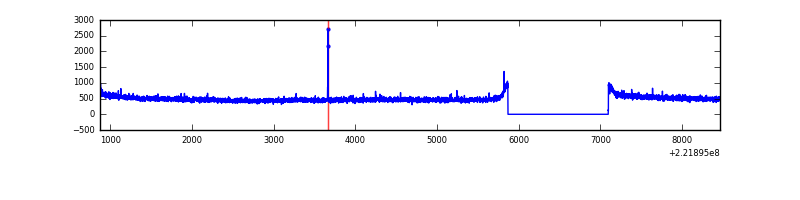 |
| B | 7592 | 6363 | 4 | 4 | 0.05% | 0.06% | 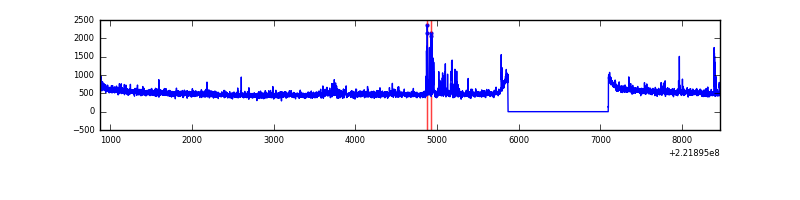 |
| C | 7592 | 6363 | 0 | 0 | 0.00% | 0.00% | 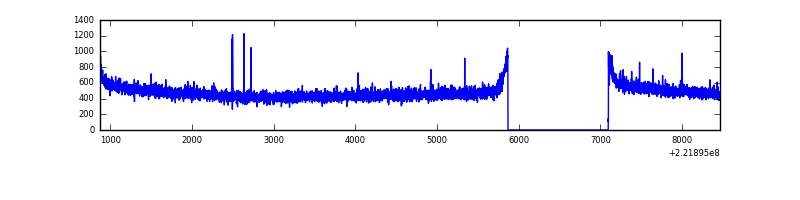 |
| D | 7592 | 6363 | 7 | 7 | 0.09% | 0.11% | 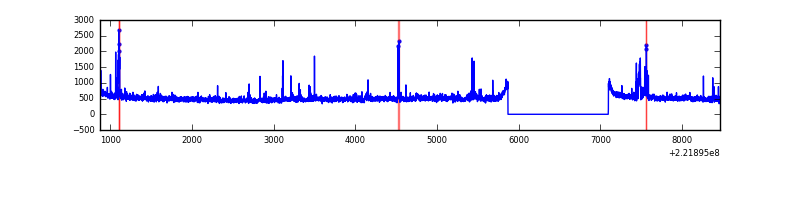 |
Top three noisy pixels from each quadrant. If the there are fewer than three noisy pixels in the level2.evt file, extra rows are filled as -1
| Pixel properties | Quadrant properties | ||||||
|---|---|---|---|---|---|---|---|
| Quadrant | DetID | PixID | Counts | Sigma | Mean | Median | Sigma |
| A | 4 | 2 | 9823 | 55.04 | 805 | 788 | 164.2 |
| A | 0 | 226 | 7655 | 41.83 | 805 | 788 | 164.2 |
| A | 12 | 194 | 7276 | 39.52 | 805 | 788 | 164.2 |
| B | 0 | 228 | 87902 | 569.96 | 809 | 789 | 152.8 |
| B | 0 | 219 | 34810 | 222.59 | 809 | 789 | 152.8 |
| B | 4 | 173 | 23553 | 148.94 | 809 | 789 | 152.8 |
| C | 13 | 61 | 6188 | 30.44 | 774 | 778 | 177.8 |
| C | 5 | 252 | 4193 | 19.21 | 774 | 778 | 177.8 |
| C | 12 | 4 | 4107 | 18.73 | 774 | 778 | 177.8 |
| D | 8 | 195 | 267463 | 1422.48 | 775 | 753 | 187.5 |
| D | 9 | 68 | 44760 | 234.71 | 775 | 753 | 187.5 |
| D | 13 | 169 | 37377 | 195.33 | 775 | 753 | 187.5 |
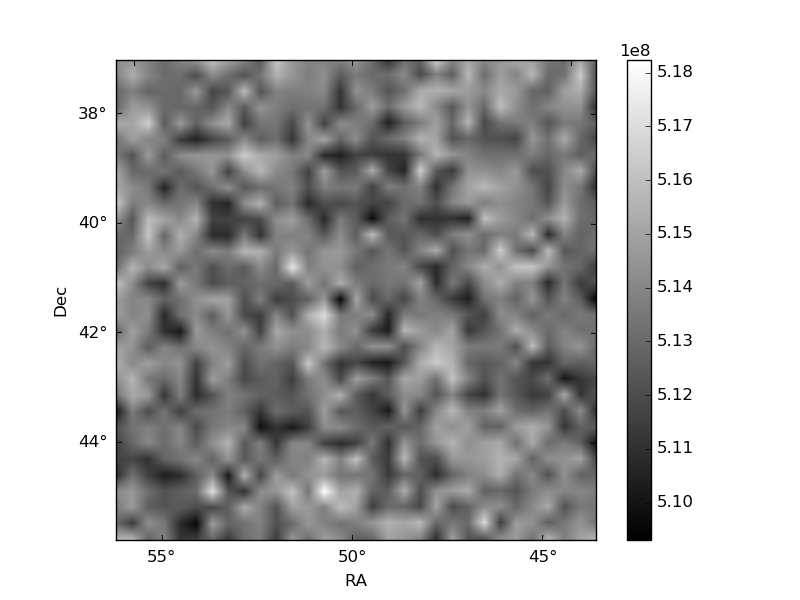
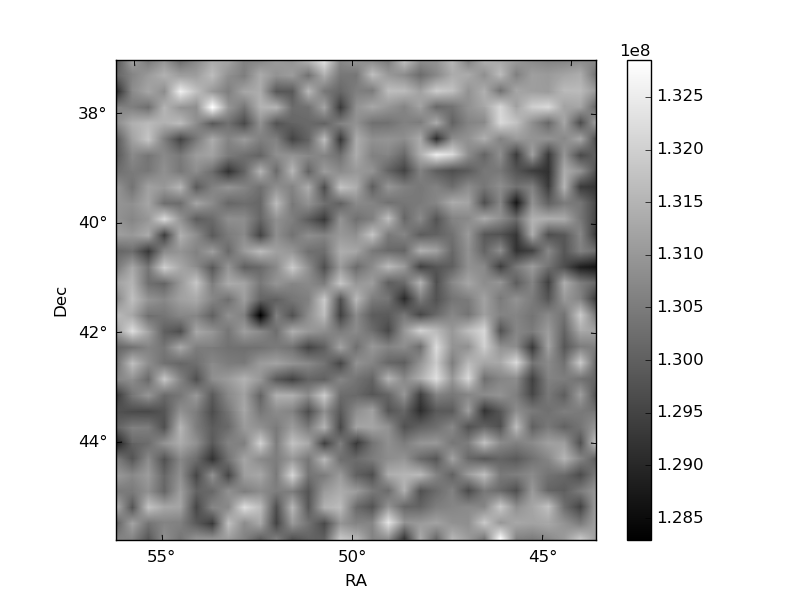
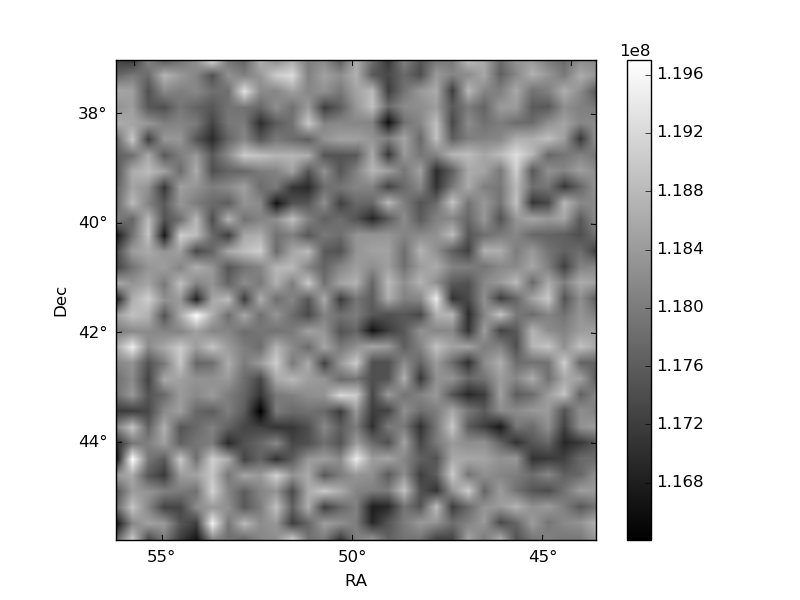
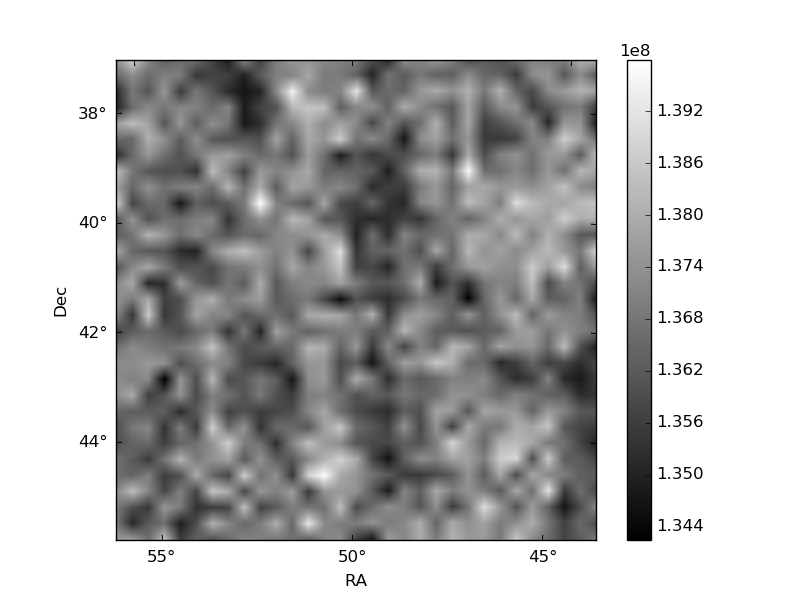
Histogram calculated using DETX and DETY for each event in the final _common_clean file
| Quadrant A | 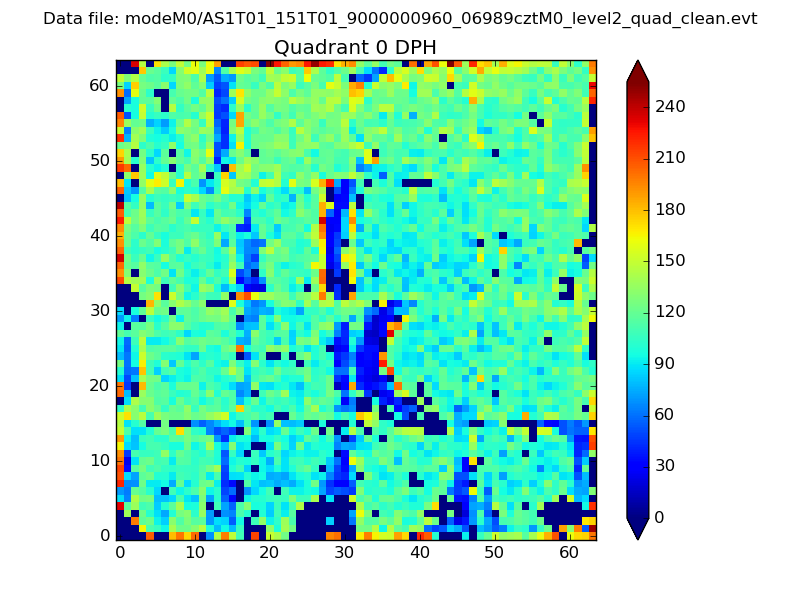 |
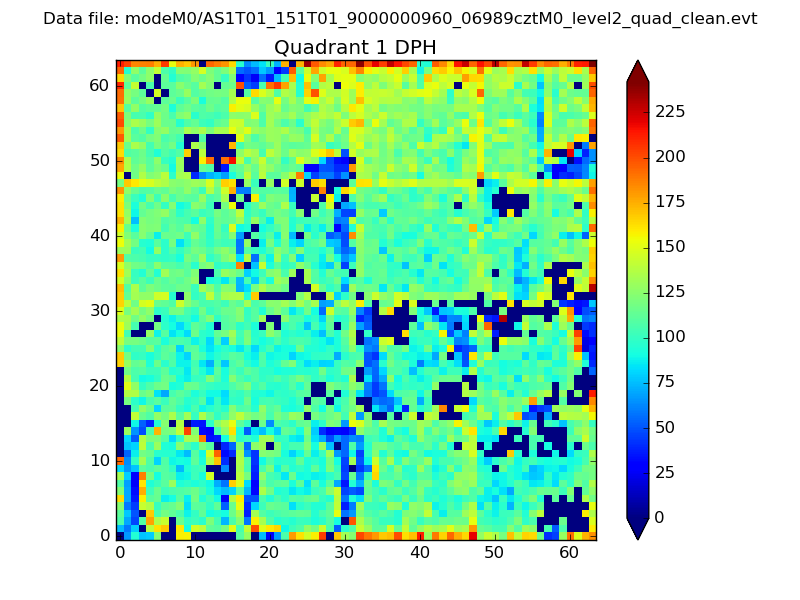 |
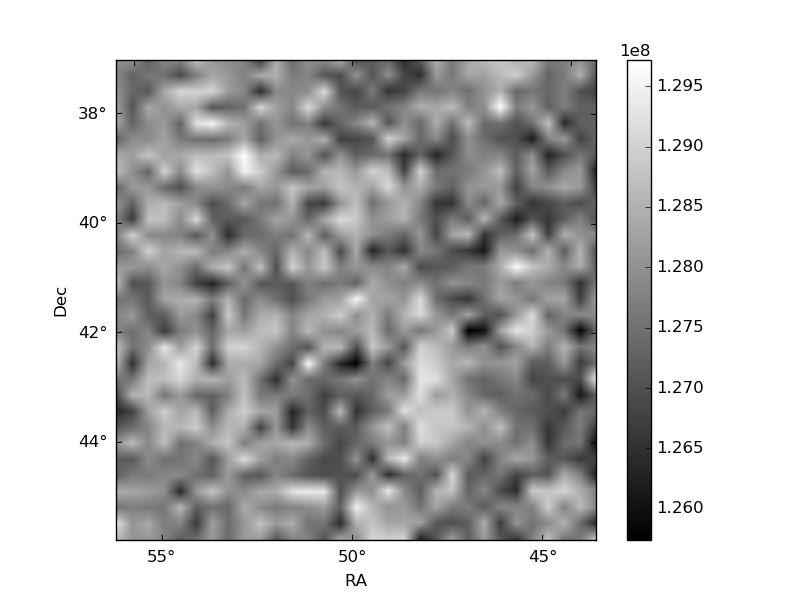
Quadrant B |
|---|---|---|---|
| Quadrant D | 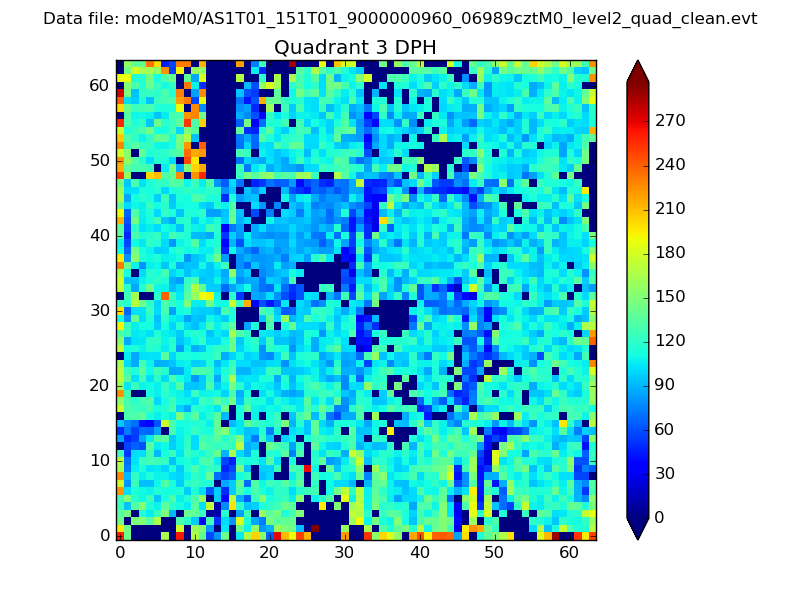 |
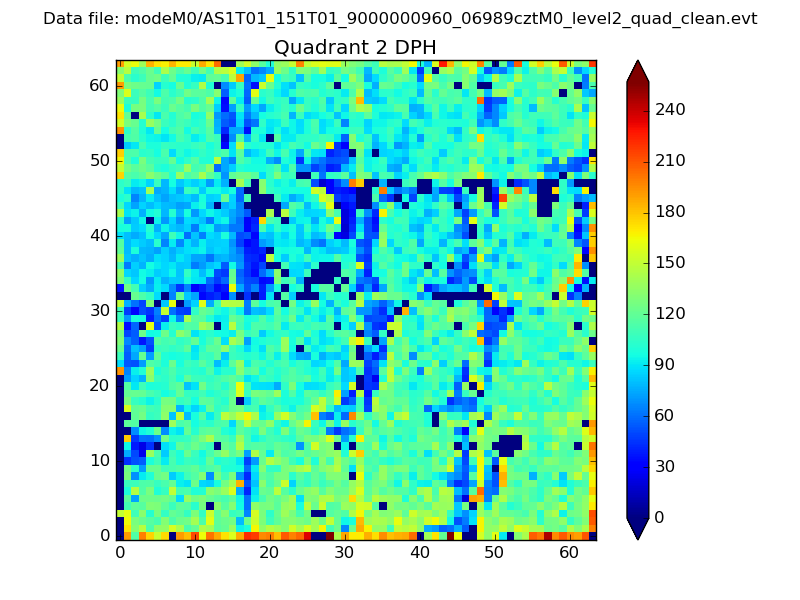 |
Quadrant C |
| Plot type | Count rate plots | Images |
|---|---|---|
| Comparison with Poisson distribution Blue bars denote a histogram of data divided into 1 sec bins. Red curve is a Poisson curve with rate = median count rate of data. |
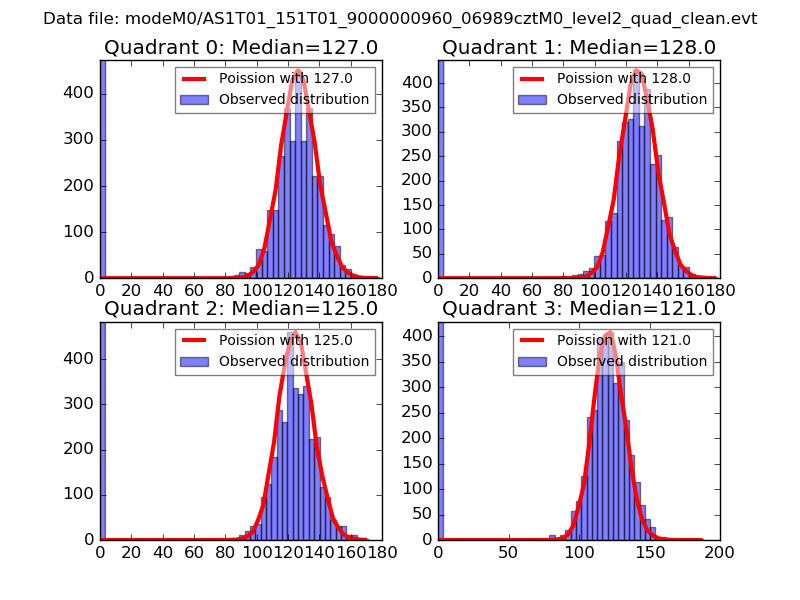 |
 |
| Quadrant-wise count rates Data is divided into 100 sec bins |
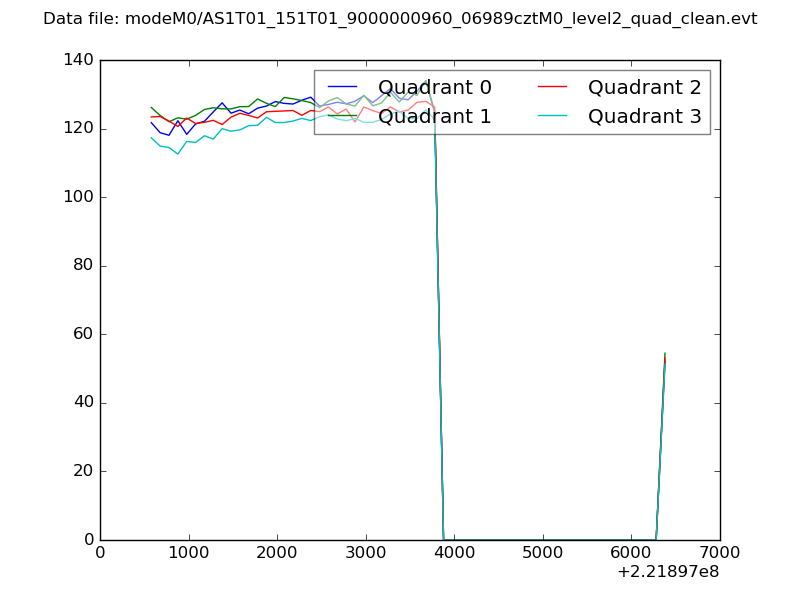 |
|
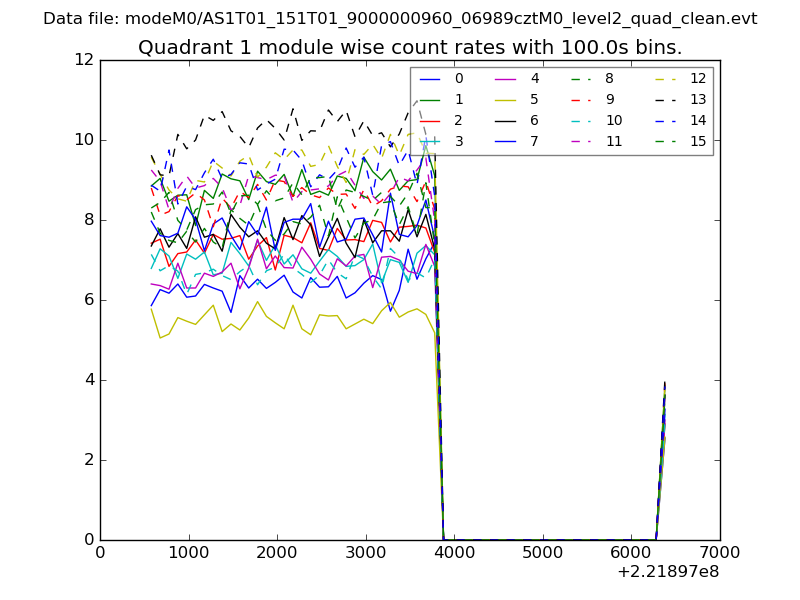
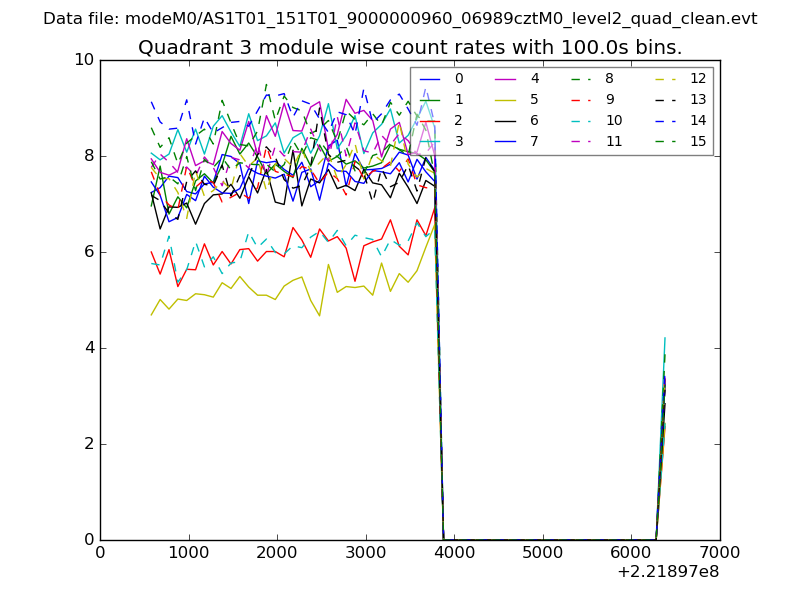
| Module-wise count rates for Quadrant A Data is divided into 100 sec bins |
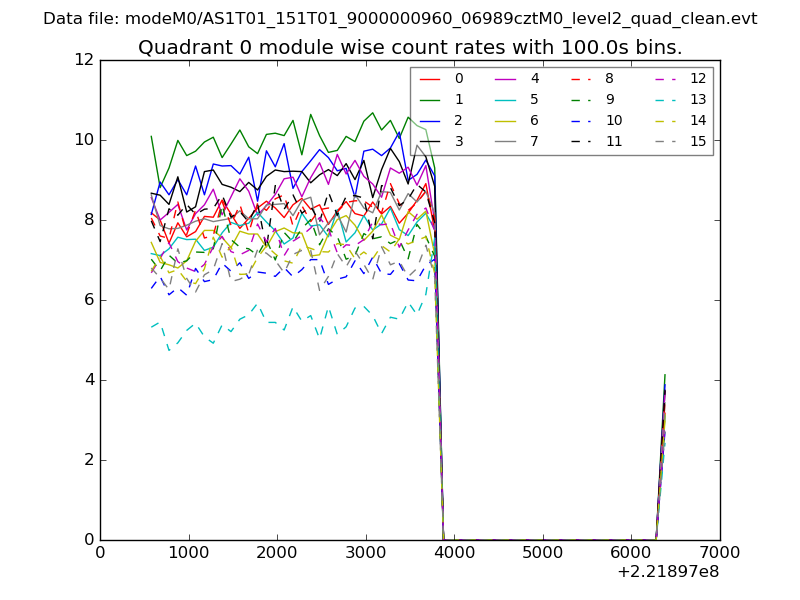 |
 |
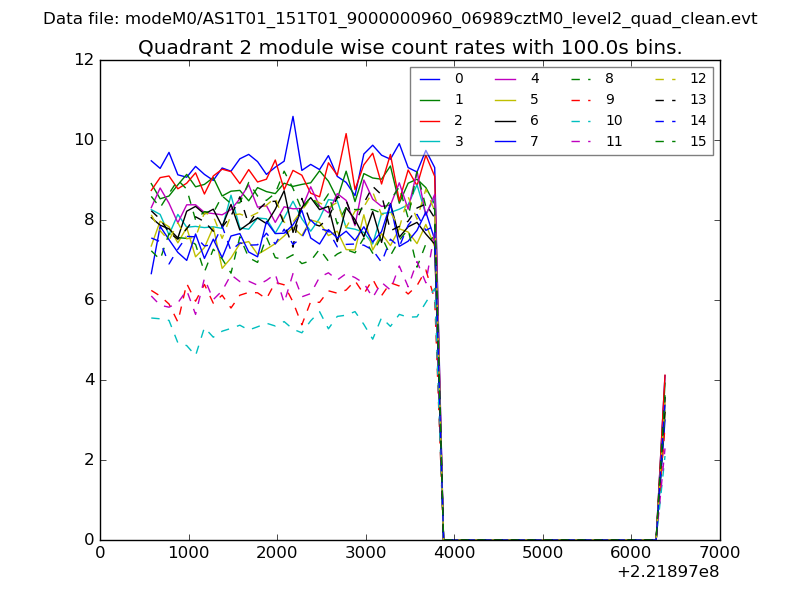
| Module-wise count rates for Quadrant B Data is divided into 100 sec bins |
 |
 |
| Module-wise count rates for Quadrant C Data is divided into 100 sec bins |
 |
 |
| Module-wise count rates for Quadrant D Data is divided into 100 sec bins |
 |
 |
| Parameter | Plot |
|---|---|
| CZT HV Monitor | 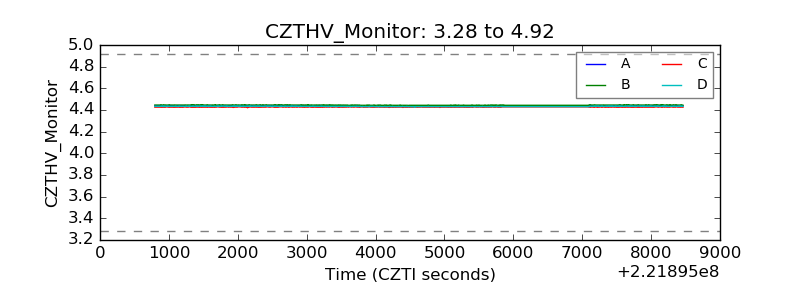 |
| D_VDD | 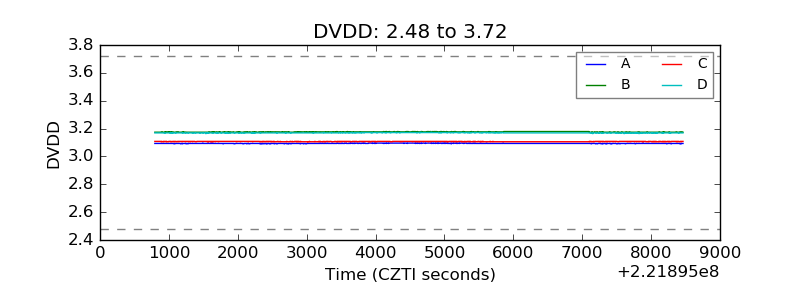 |
| Temperature 1 | 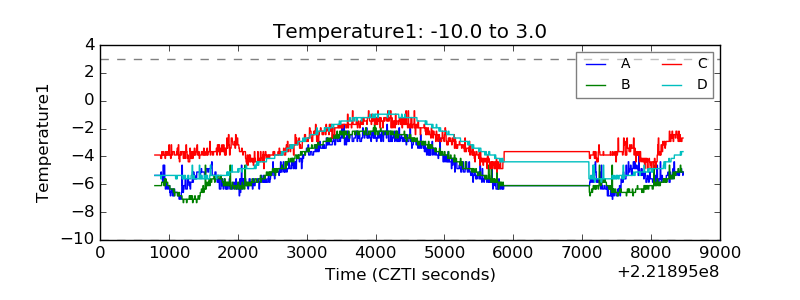 |
| Veto HV Monitor | 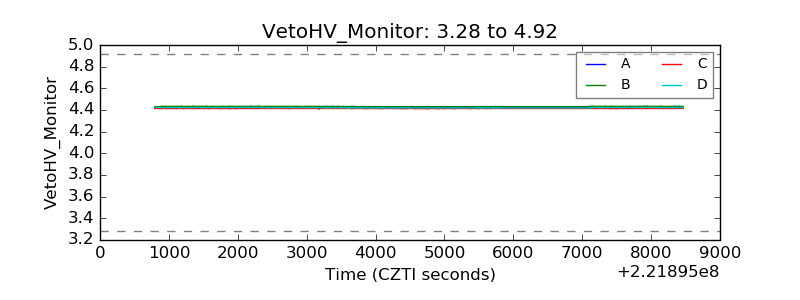 |
| Veto LLD | 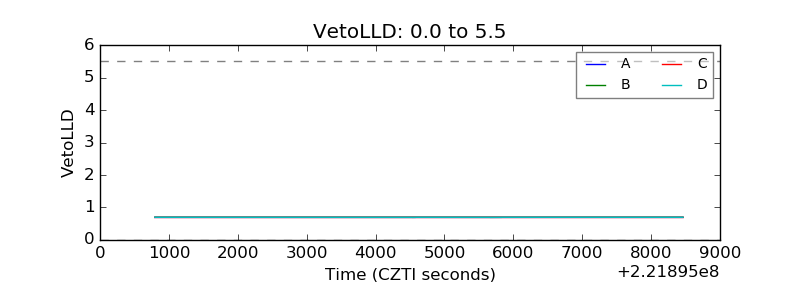 |
| Alpha Counter | 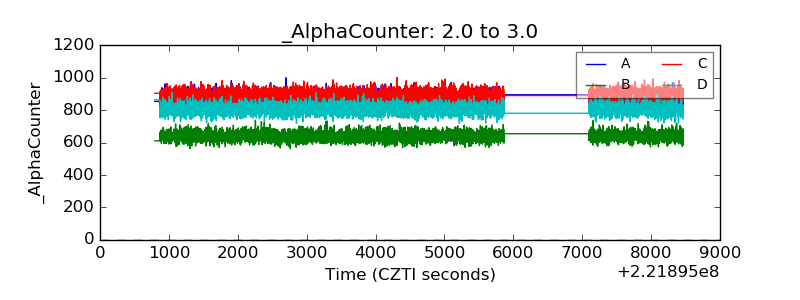 |
| _CPM_Rate | 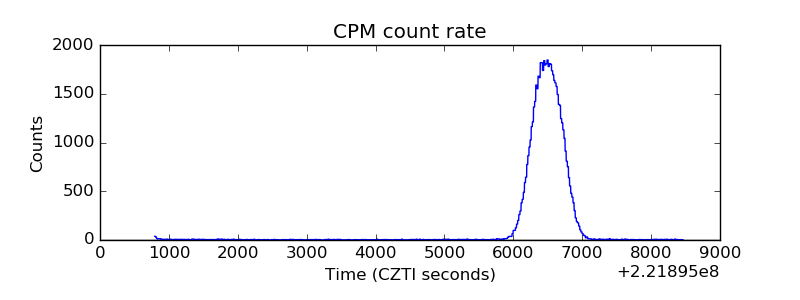 |
| CZT Counter | 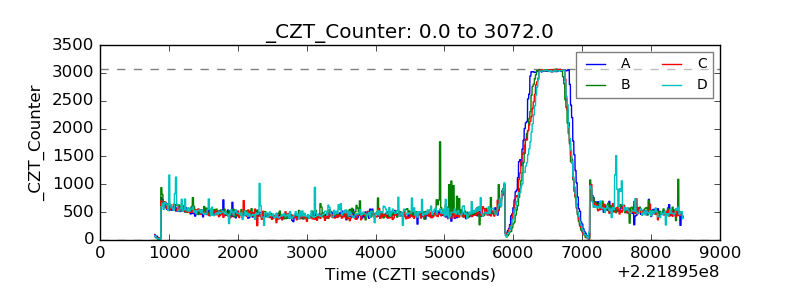 |
| +2.5 Volts monitor | 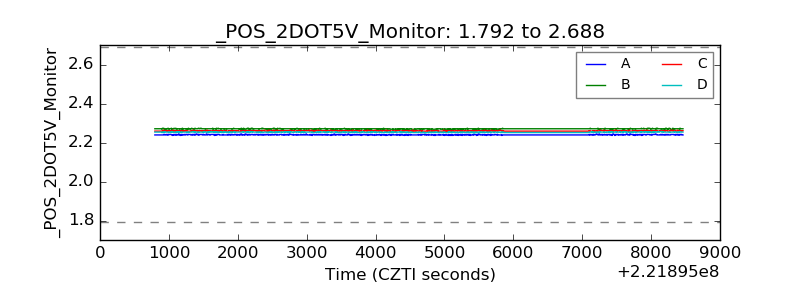 |
| +5 Volts monitor | 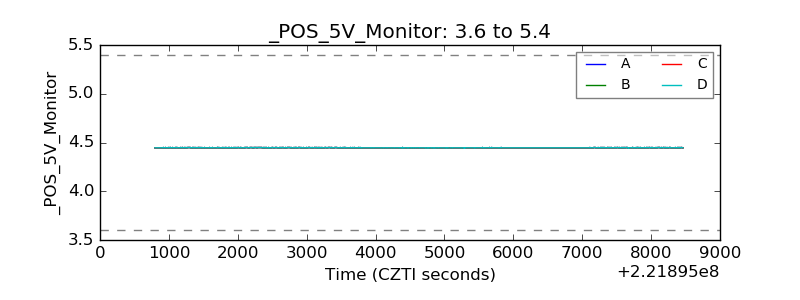 |
| _ROLL_ROT | 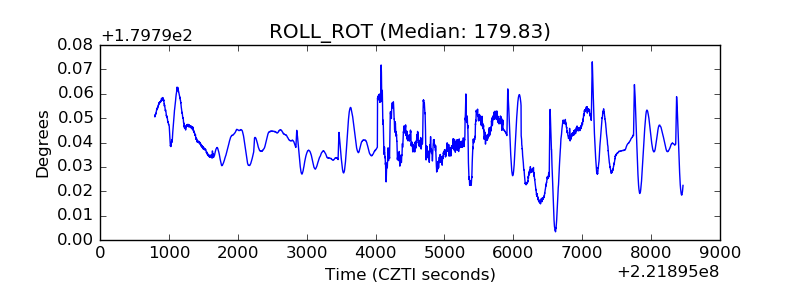 |
| _Roll_DEC | 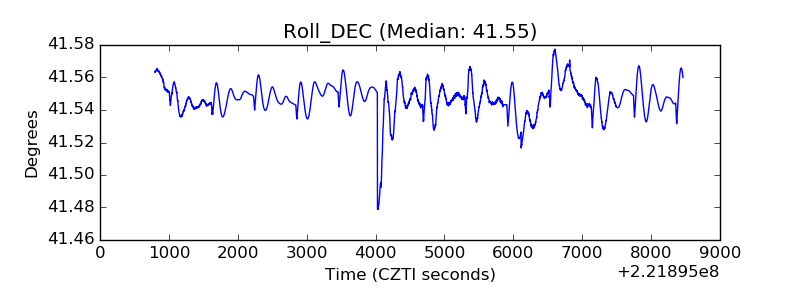 |
| _Roll_RA | 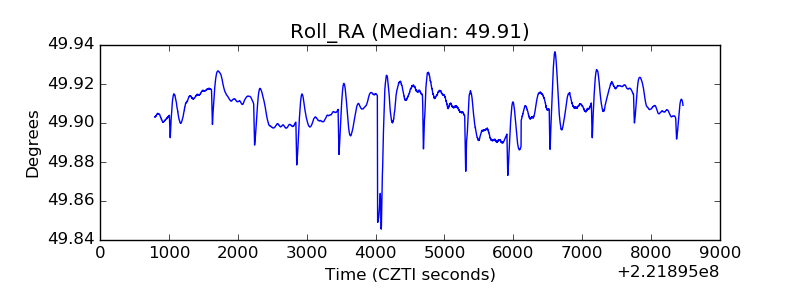 |
| Veto Counter | 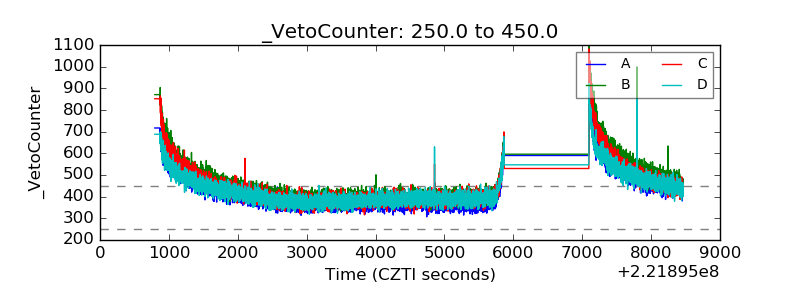 |