| Param | Original file | Final file |
|---|---|---|
| Filename | modeM0/AS1T01_151T01_9000000960_06990cztM0_level2.evt | modeM0/AS1T01_151T01_9000000960_06990cztM0_level2_quad_clean.evt |
| Size (bytes) | 450,527,040 | 85,089,600 |
| Size | 429.7 MB | 81.1 MB |
| Events in quadrant A | 3,198,695 | 541,928 |
| Events in quadrant B | 3,562,863 | 548,347 |
| Events in quadrant C | 3,070,203 | 530,000 |
| Events in quadrant D | 3,383,187 | 515,553 |
| Mode SS | |||
|---|---|---|---|
| Quadrant | BADHDUFLAG | Total packets | Discarded packets |
| A | 0 | 128 | 0 |
| B | 0 | 128 | 0 |
| C | 0 | 128 | 0 |
| D | 0 | 128 | 0 |
| Mode M9 | |||
|---|---|---|---|
| Quadrant | BADHDUFLAG | Total packets | Discarded packets |
| A | 0 | 16 | 0 |
| B | 0 | 16 | 0 |
| C | 0 | 16 | 0 |
| D | 0 | 17 | 0 |
| Mode M0 | |||
|---|---|---|---|
| Quadrant | BADHDUFLAG | Total packets | Discarded packets |
| A | 0 | 13321 | 3 |
| B | 0 | 14428 | 2 |
| C | 0 | 13153 | 2 |
| D | 0 | 13901 | 2 |
| Quadrant | Total seconds | Saturated seconds | Saturation percentage |
|---|---|---|---|
| A | 6319 | 103 | 1.630005% |
| B | 6319 | 236 | 3.734768% |
| C | 6319 | 54 | 0.854566% |
| D | 6319 | 86 | 1.360975% |
Noise dominated data is calculated using 1-second bins in cleaned event files. If a bin has >2000 counts, and if more than 50% of those come from <1% of pixels, then it is considered to be noise-dominated and hence unusable.
| Quadrant | # 1 sec bins | Bins with >0 counts | Bins with >2000 counts | High rate bins dominated by noise | Noise dominated (total time) | Noise dominated (detector-on time) | Marked lightcurve |
|---|---|---|---|---|---|---|---|
| A | 7614 | 6320 | 1 | 1 | 0.01% | 0.02% | 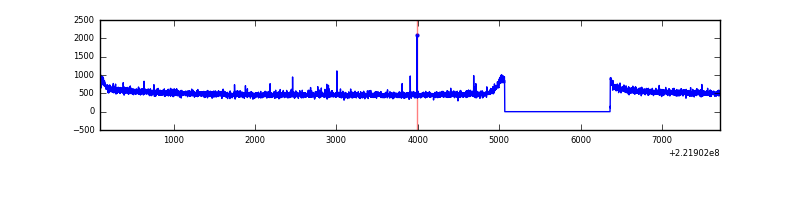 |
| B | 7614 | 6320 | 104 | 104 | 1.37% | 1.65% |  |
| C | 7614 | 6320 | 0 | 0 | 0.00% | 0.00% | 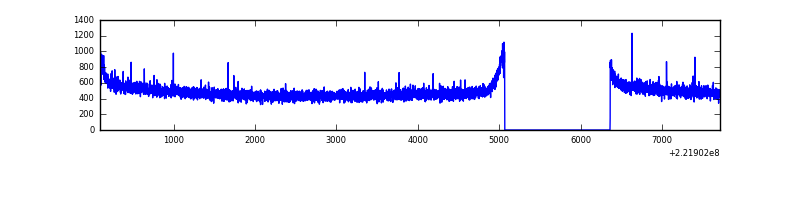 |
| D | 7614 | 6320 | 32 | 32 | 0.42% | 0.51% | 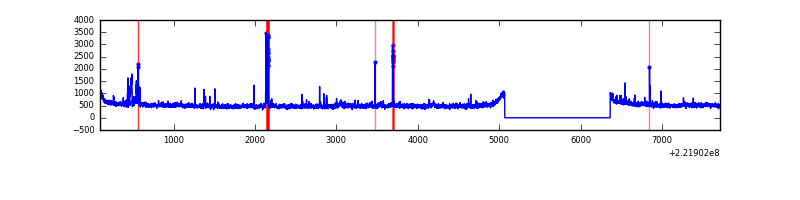 |
Top three noisy pixels from each quadrant. If the there are fewer than three noisy pixels in the level2.evt file, extra rows are filled as -1
| Pixel properties | Quadrant properties | ||||||
|---|---|---|---|---|---|---|---|
| Quadrant | DetID | PixID | Counts | Sigma | Mean | Median | Sigma |
| A | 15 | 234 | 11586 | 64.97 | 826 | 807 | 165.9 |
| A | 13 | 14 | 9241 | 50.83 | 826 | 807 | 165.9 |
| A | 0 | 226 | 8047 | 43.64 | 826 | 807 | 165.9 |
| B | 4 | 81 | 247598 | 1599.54 | 820 | 804 | 154.3 |
| B | 0 | 214 | 53031 | 338.5 | 820 | 804 | 154.3 |
| B | 10 | 252 | 21388 | 133.41 | 820 | 804 | 154.3 |
| C | 13 | 61 | 6278 | 30.53 | 785 | 789 | 179.8 |
| C | 12 | 4 | 3213 | 13.48 | 785 | 789 | 179.8 |
| C | 7 | 247 | 2363 | 8.75 | 785 | 789 | 179.8 |
| D | 8 | 195 | 178351 | 916.11 | 794 | 771 | 193.8 |
| D | 2 | 33 | 59935 | 305.22 | 794 | 771 | 193.8 |
| D | 9 | 68 | 57195 | 291.08 | 794 | 771 | 193.8 |
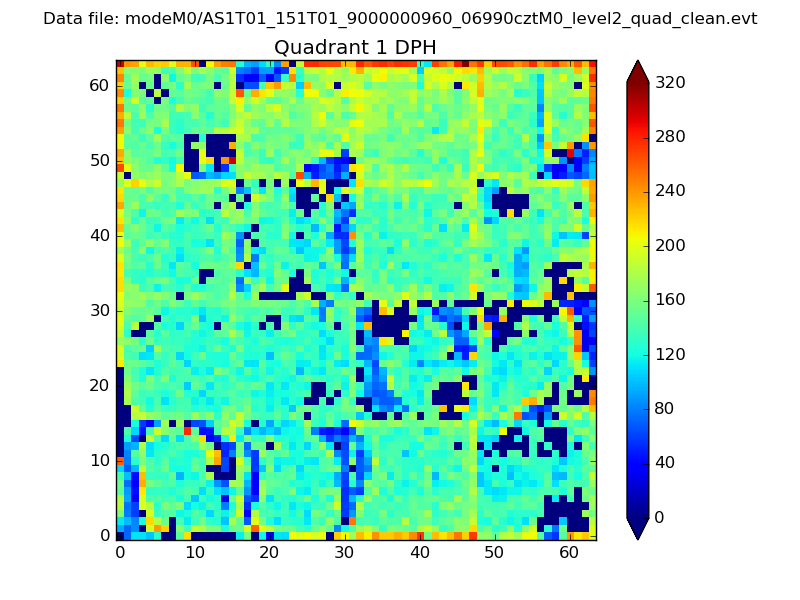
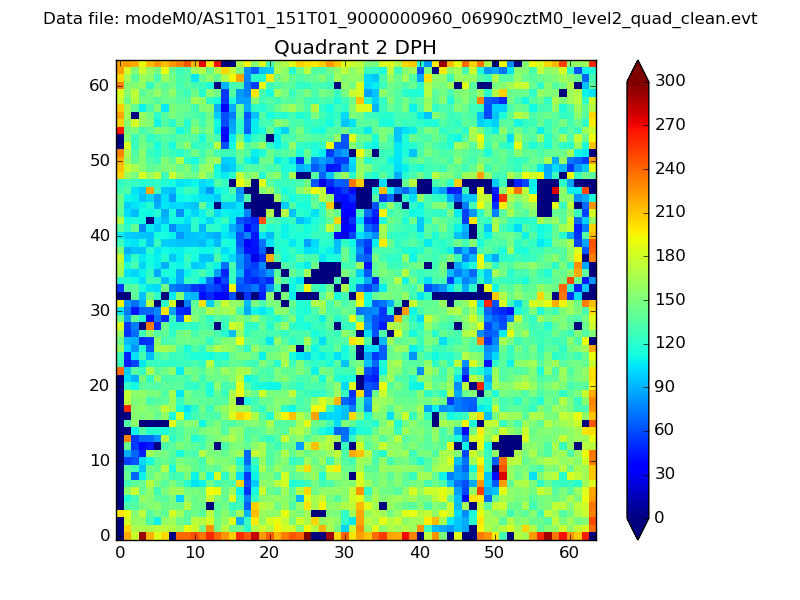
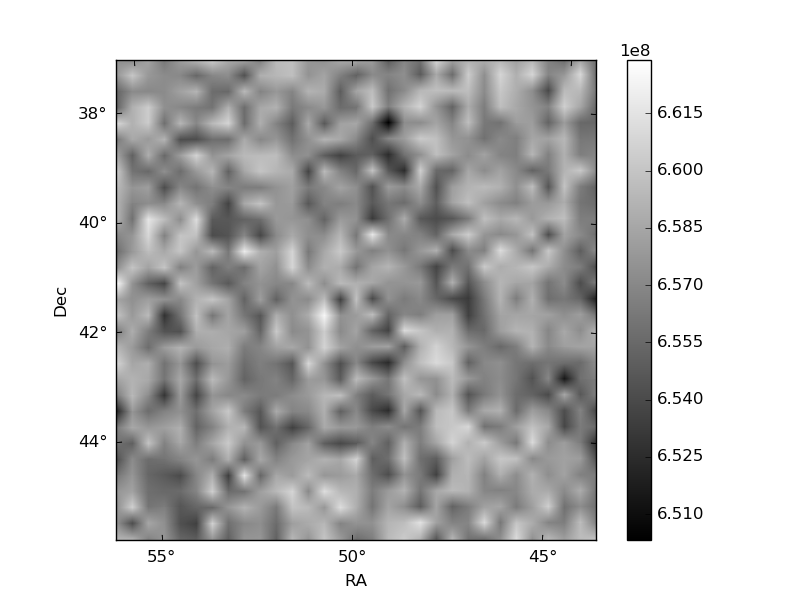
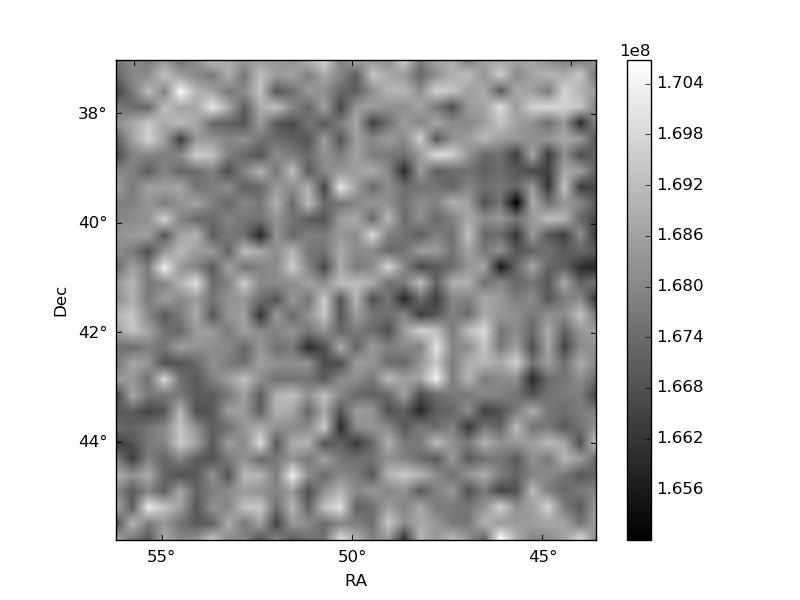
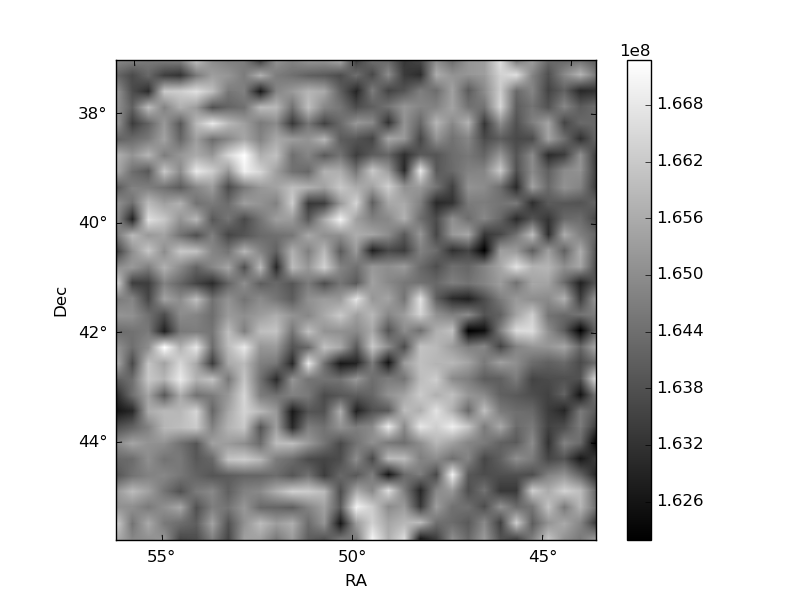
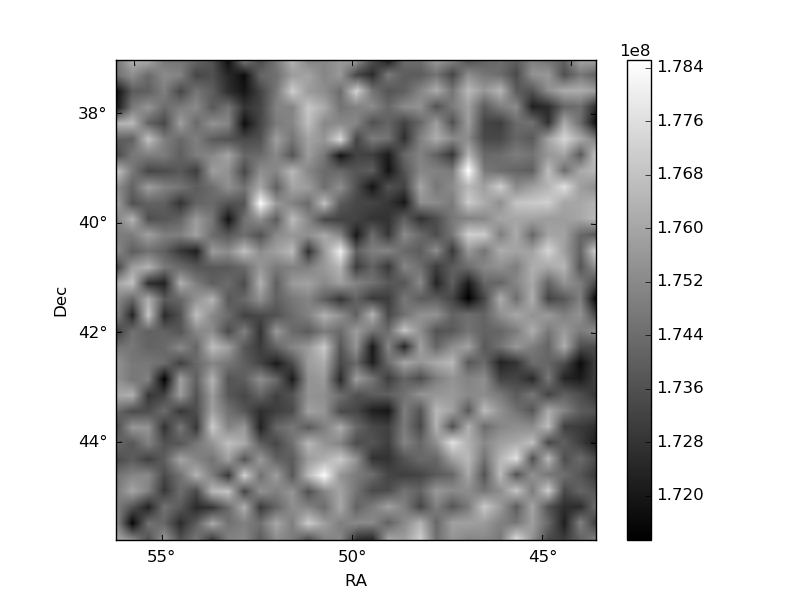
Histogram calculated using DETX and DETY for each event in the final _common_clean file
| Quadrant A | 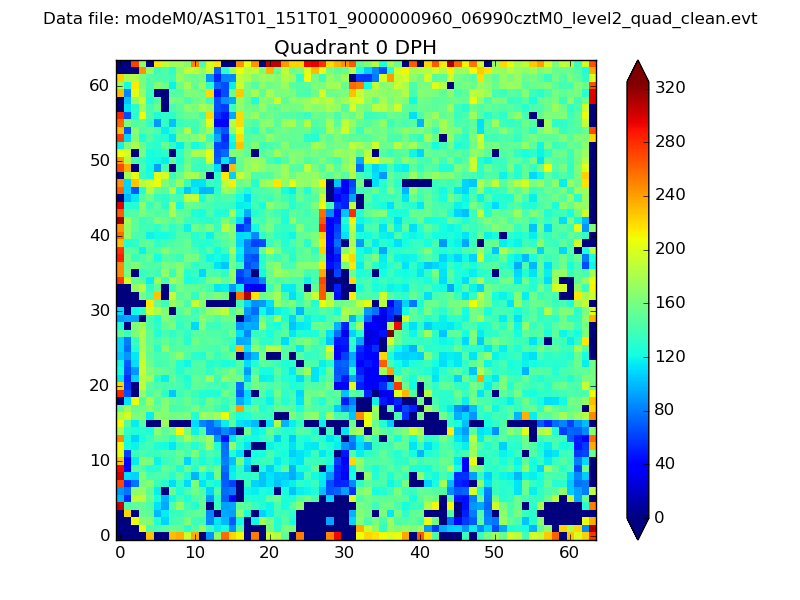 |
 |
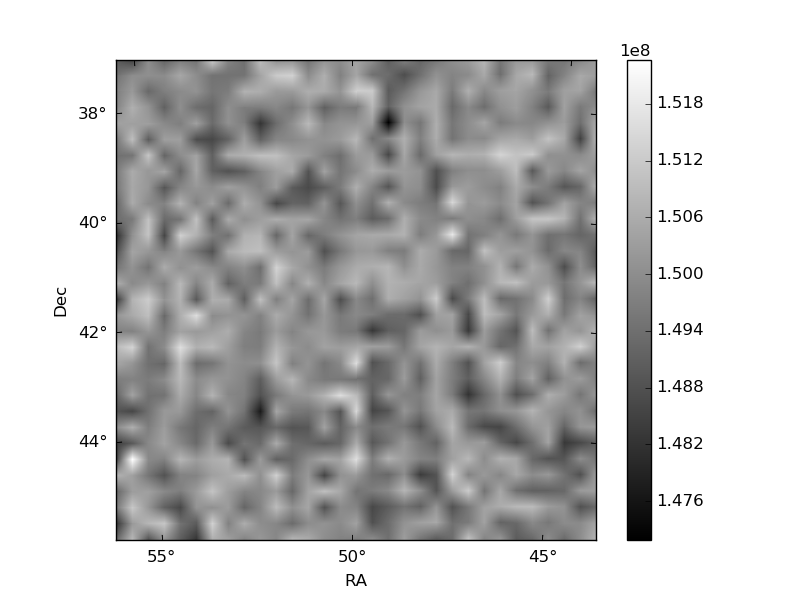
Quadrant B |
|---|---|---|---|
| Quadrant D | 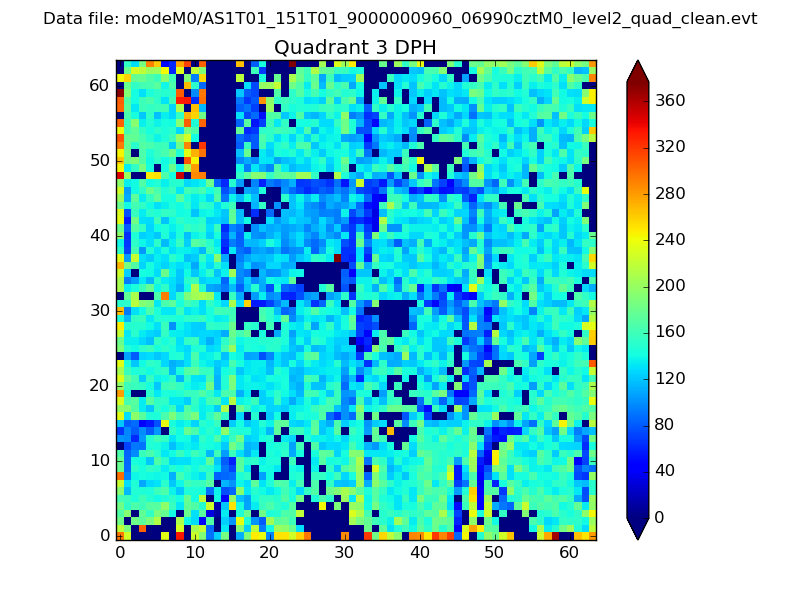 |
 |
Quadrant C |
| Plot type | Count rate plots | Images |
|---|---|---|
| Comparison with Poisson distribution Blue bars denote a histogram of data divided into 1 sec bins. Red curve is a Poisson curve with rate = median count rate of data. |
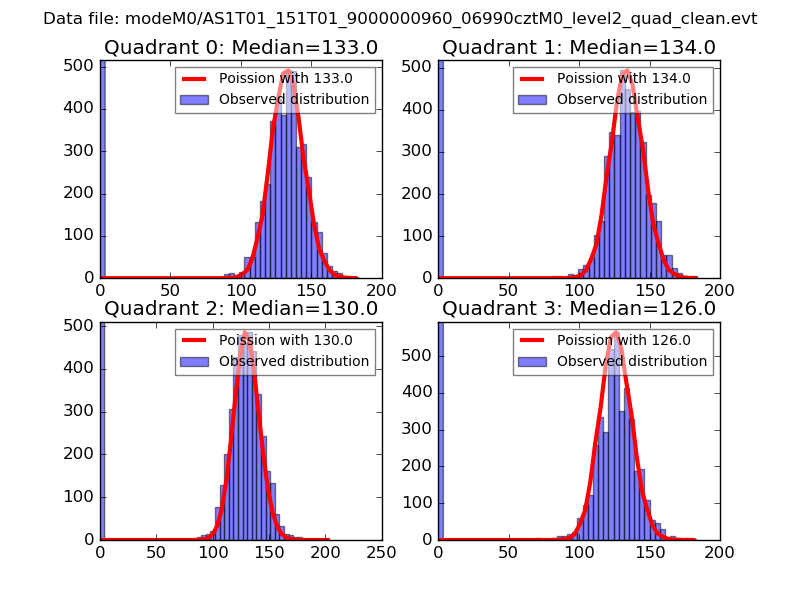 |
 |
| Quadrant-wise count rates Data is divided into 100 sec bins |
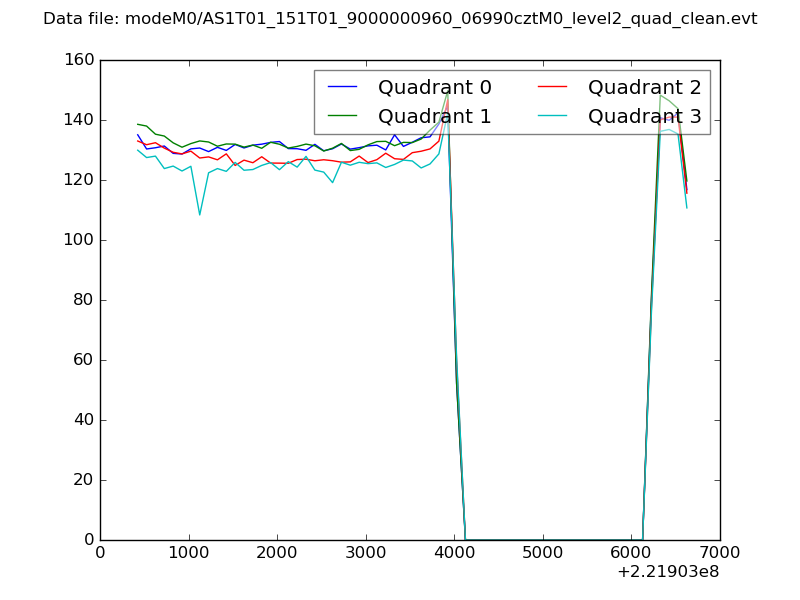 |
|
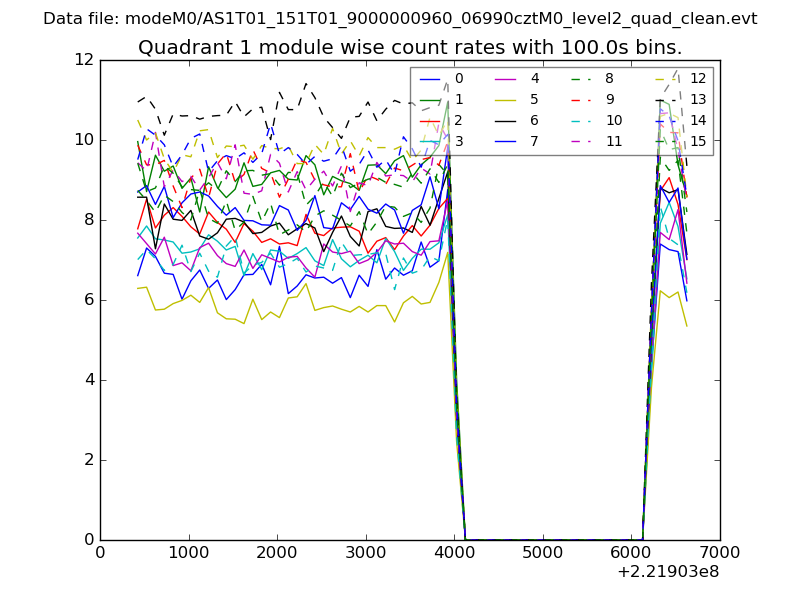
| Module-wise count rates for Quadrant A Data is divided into 100 sec bins |
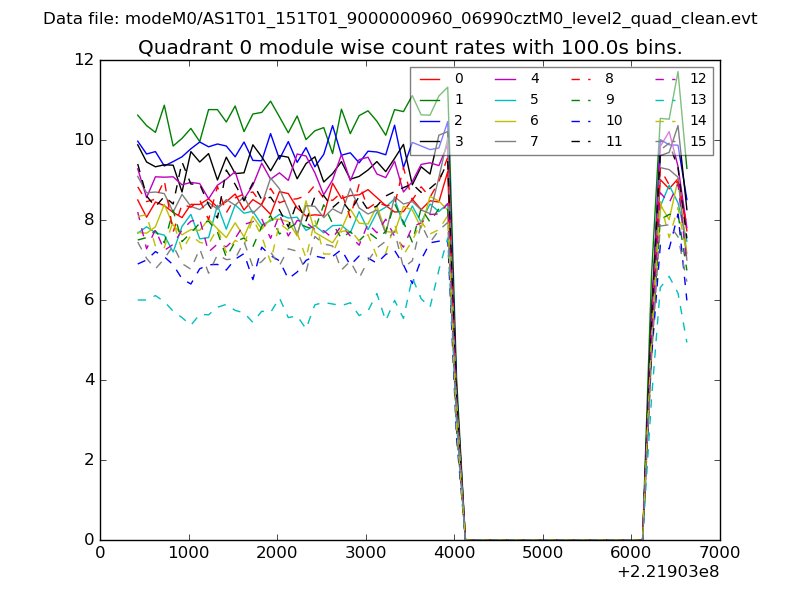 |
 |
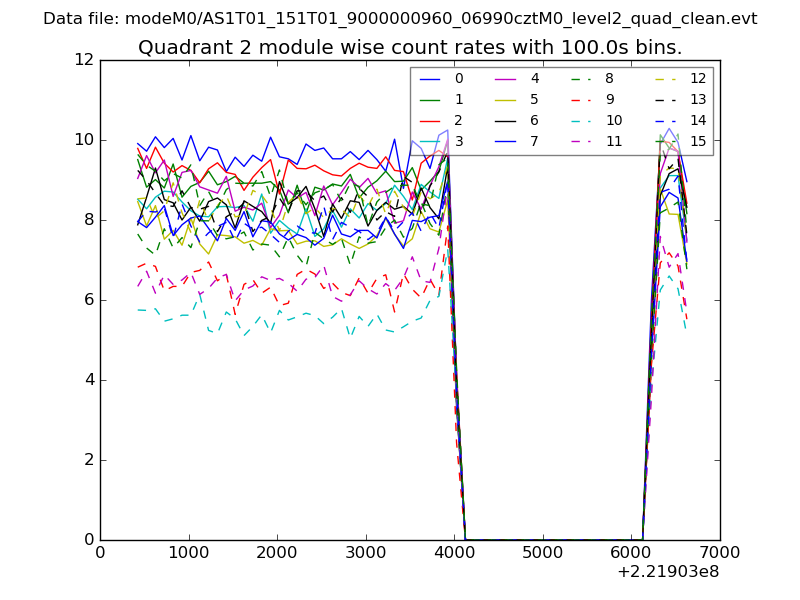
| Module-wise count rates for Quadrant B Data is divided into 100 sec bins |
 |
 |
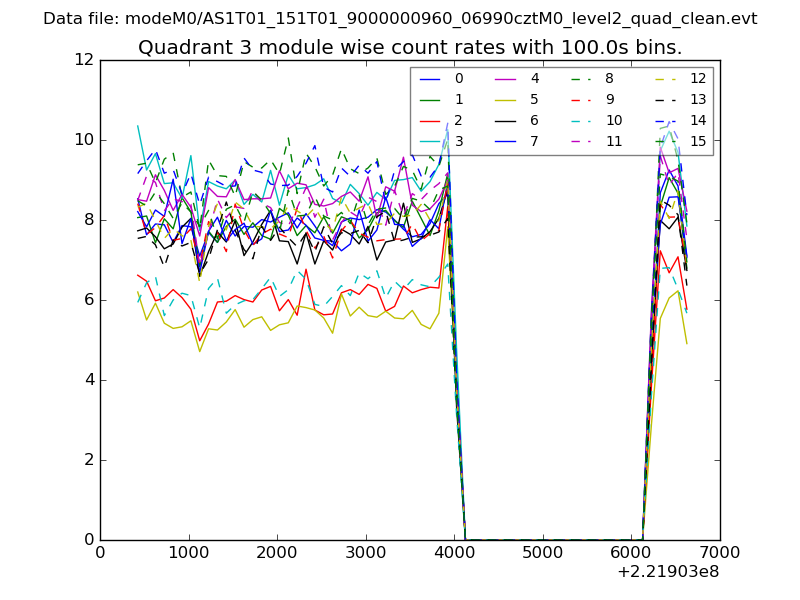
| Module-wise count rates for Quadrant C Data is divided into 100 sec bins |
 |
 |
| Module-wise count rates for Quadrant D Data is divided into 100 sec bins |
 |
 |
| Parameter | Plot |
|---|---|
| CZT HV Monitor | 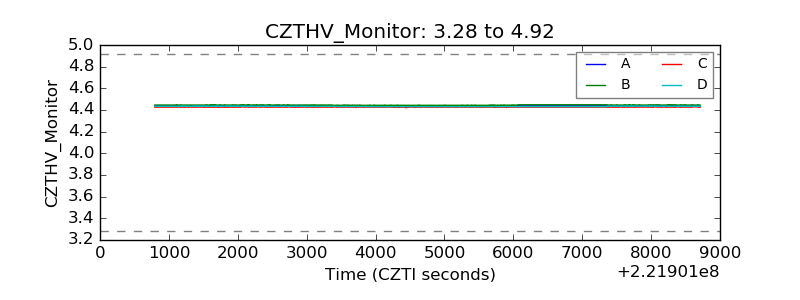 |
| D_VDD | 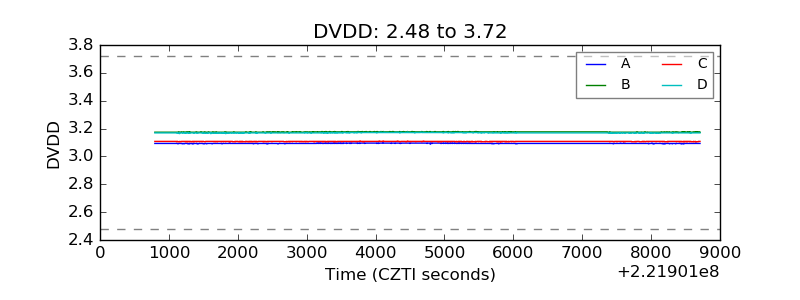 |
| Temperature 1 | 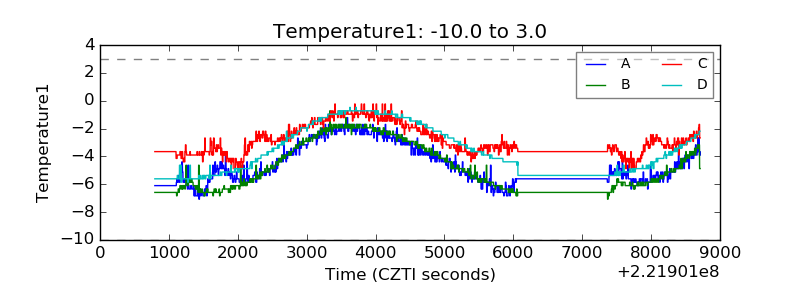 |
| Veto HV Monitor | 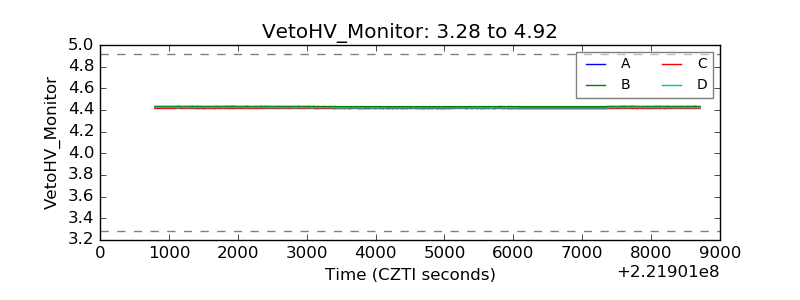 |
| Veto LLD | 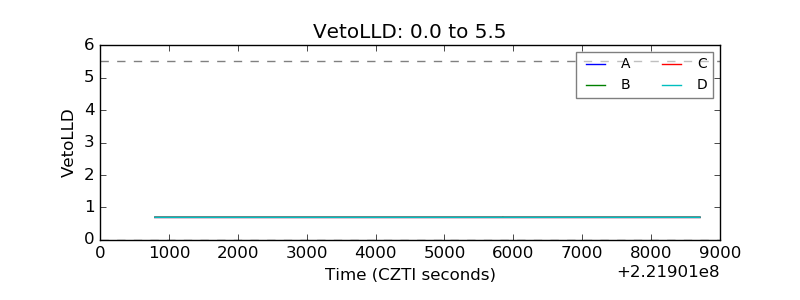 |
| Alpha Counter | 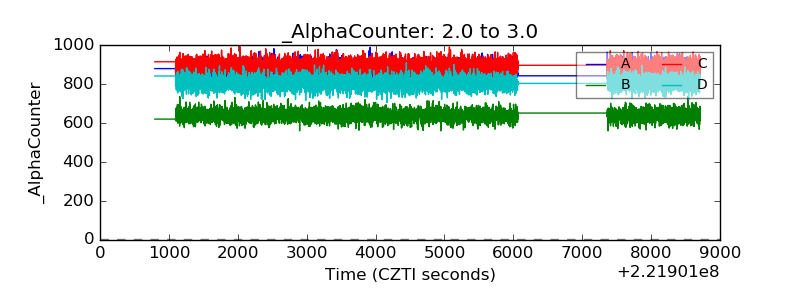 |
| _CPM_Rate | 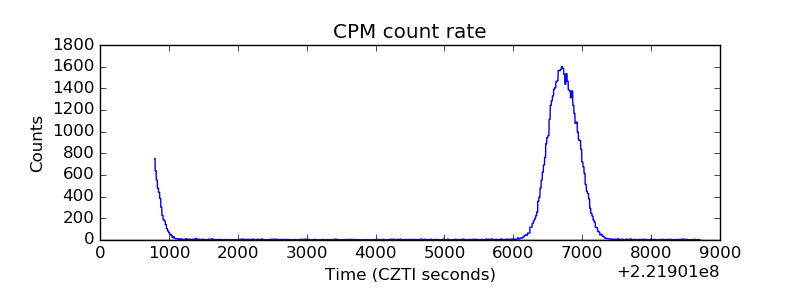 |
| CZT Counter | 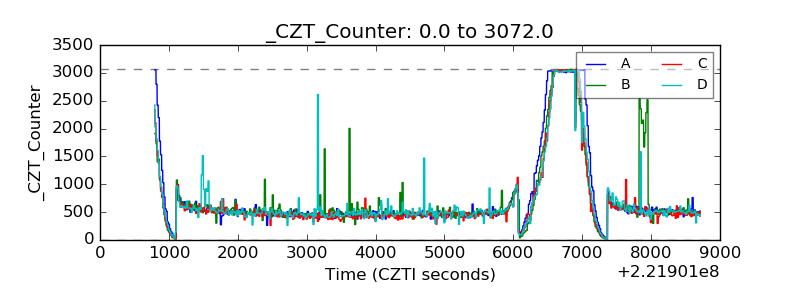 |
| +2.5 Volts monitor | 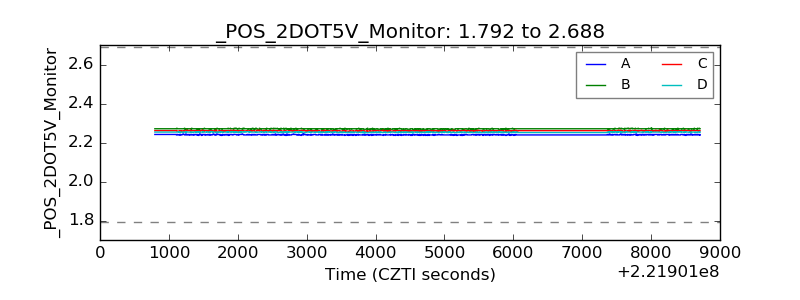 |
| +5 Volts monitor |  |
| _ROLL_ROT | 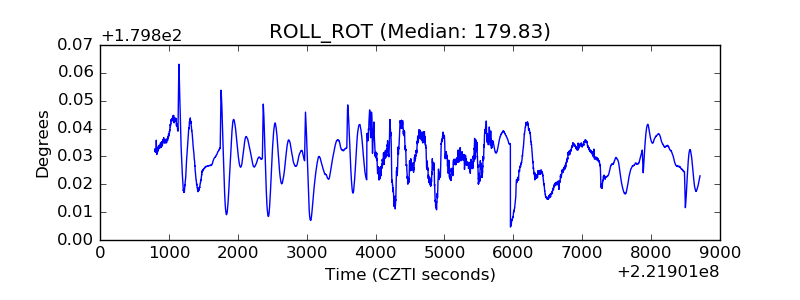 |
| _Roll_DEC | 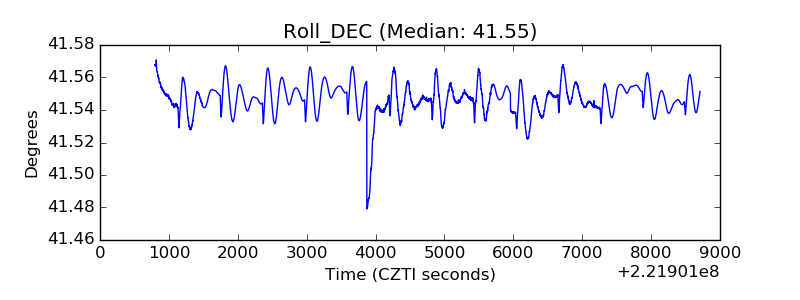 |
| _Roll_RA | 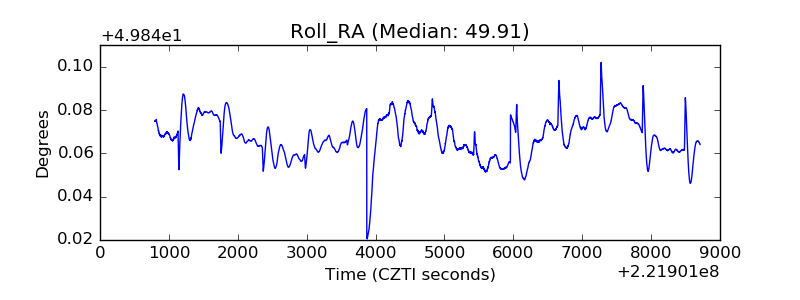 |
| Veto Counter | 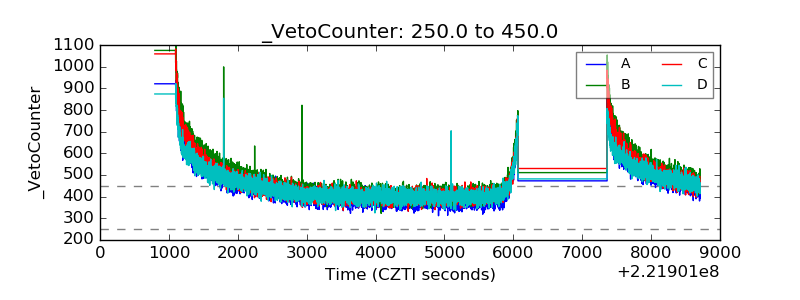 |