| Param | Original file | Final file |
|---|---|---|
| Filename | modeM0/AS1T01_151T01_9000000960_06992cztM0_level2.evt | modeM0/AS1T01_151T01_9000000960_06992cztM0_level2_quad_clean.evt |
| Size (bytes) | 443,880,000 | 100,350,720 |
| Size | 423.3 MB | 95.7 MB |
| Events in quadrant A | 3,241,719 | 661,507 |
| Events in quadrant B | 3,283,994 | 662,154 |
| Events in quadrant C | 3,012,992 | 640,864 |
| Events in quadrant D | 3,467,011 | 626,151 |
| Mode SS | |||
|---|---|---|---|
| Quadrant | BADHDUFLAG | Total packets | Discarded packets |
| A | 0 | 132 | 0 |
| B | 0 | 132 | 0 |
| C | 0 | 132 | 0 |
| D | 0 | 132 | 0 |
| Mode M9 | |||
|---|---|---|---|
| Quadrant | BADHDUFLAG | Total packets | Discarded packets |
| A | 0 | 12 | 0 |
| B | 0 | 12 | 0 |
| C | 0 | 12 | 0 |
| D | 0 | 13 | 0 |
| Mode M0 | |||
|---|---|---|---|
| Quadrant | BADHDUFLAG | Total packets | Discarded packets |
| A | 0 | 13673 | 4 |
| B | 0 | 13761 | 3 |
| C | 0 | 13250 | 3 |
| D | 0 | 14245 | 3 |
| Quadrant | Total seconds | Saturated seconds | Saturation percentage |
|---|---|---|---|
| A | 6423 | 143 | 2.226374% |
| B | 6423 | 156 | 2.428772% |
| C | 6423 | 93 | 1.447922% |
| D | 6423 | 138 | 2.148529% |
Noise dominated data is calculated using 1-second bins in cleaned event files. If a bin has >2000 counts, and if more than 50% of those come from <1% of pixels, then it is considered to be noise-dominated and hence unusable.
| Quadrant | # 1 sec bins | Bins with >0 counts | Bins with >2000 counts | High rate bins dominated by noise | Noise dominated (total time) | Noise dominated (detector-on time) | Marked lightcurve |
|---|---|---|---|---|---|---|---|
| A | 7603 | 6425 | 7 | 7 | 0.09% | 0.11% | 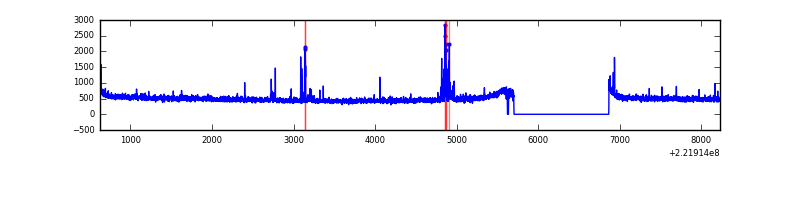 |
| B | 7603 | 6425 | 5 | 5 | 0.07% | 0.08% | 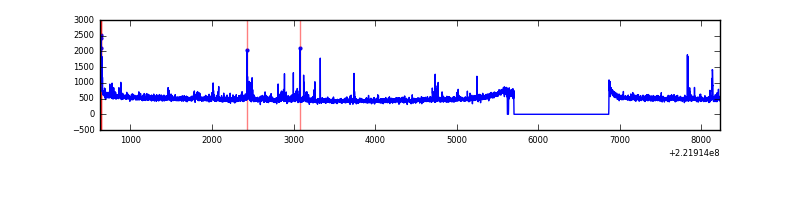 |
| C | 7603 | 6425 | 0 | 0 | 0.00% | 0.00% | 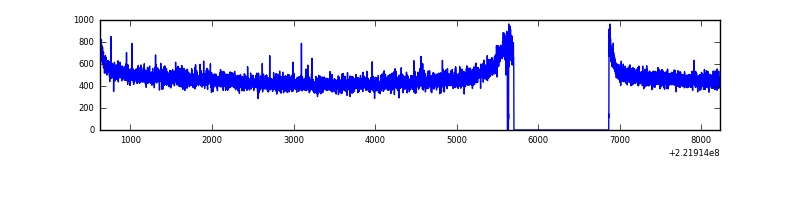 |
| D | 7603 | 6425 | 26 | 26 | 0.34% | 0.40% | 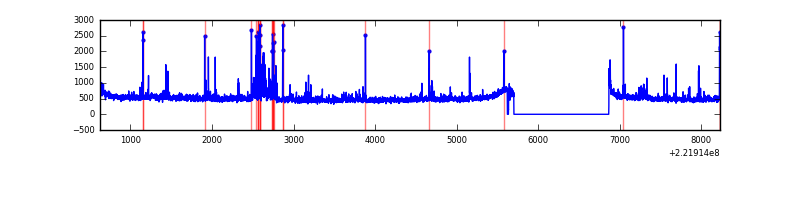 |
Top three noisy pixels from each quadrant. If the there are fewer than three noisy pixels in the level2.evt file, extra rows are filled as -1
| Pixel properties | Quadrant properties | ||||||
|---|---|---|---|---|---|---|---|
| Quadrant | DetID | PixID | Counts | Sigma | Mean | Median | Sigma |
| A | 15 | 234 | 119224 | 721.72 | 808 | 791 | 164.1 |
| A | 0 | 226 | 7873 | 43.16 | 808 | 791 | 164.1 |
| A | 12 | 194 | 7405 | 40.31 | 808 | 791 | 164.1 |
| B | 0 | 228 | 41388 | 265.52 | 803 | 784 | 152.9 |
| B | 0 | 214 | 30994 | 197.55 | 803 | 784 | 152.9 |
| B | 0 | 219 | 30588 | 194.89 | 803 | 784 | 152.9 |
| C | 13 | 61 | 6038 | 29.74 | 770 | 777 | 176.9 |
| C | 1 | 16 | 3444 | 15.07 | 770 | 777 | 176.9 |
| C | 1 | 3 | 2736 | 11.07 | 770 | 777 | 176.9 |
| D | 8 | 195 | 229892 | 1213.7 | 780 | 755 | 188.8 |
| D | 14 | 34 | 143740 | 757.37 | 780 | 755 | 188.8 |
| D | 2 | 14 | 46297 | 241.23 | 780 | 755 | 188.8 |
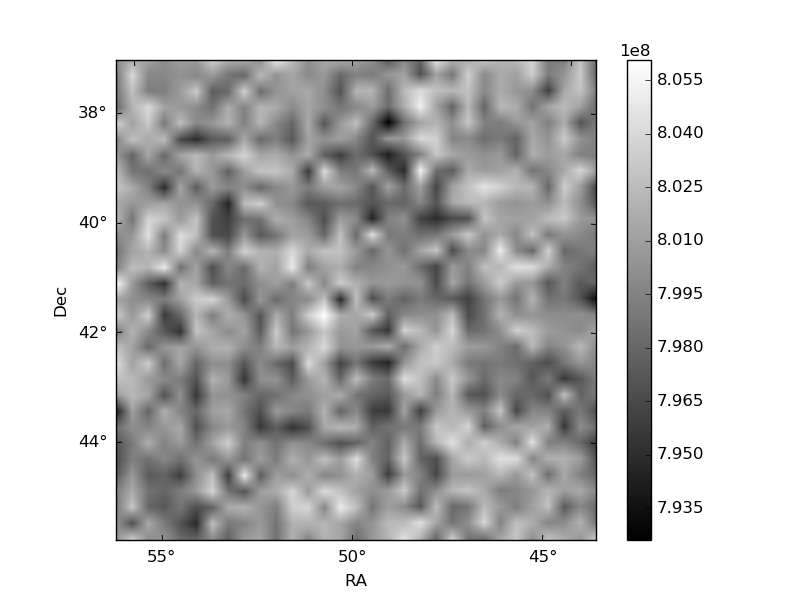
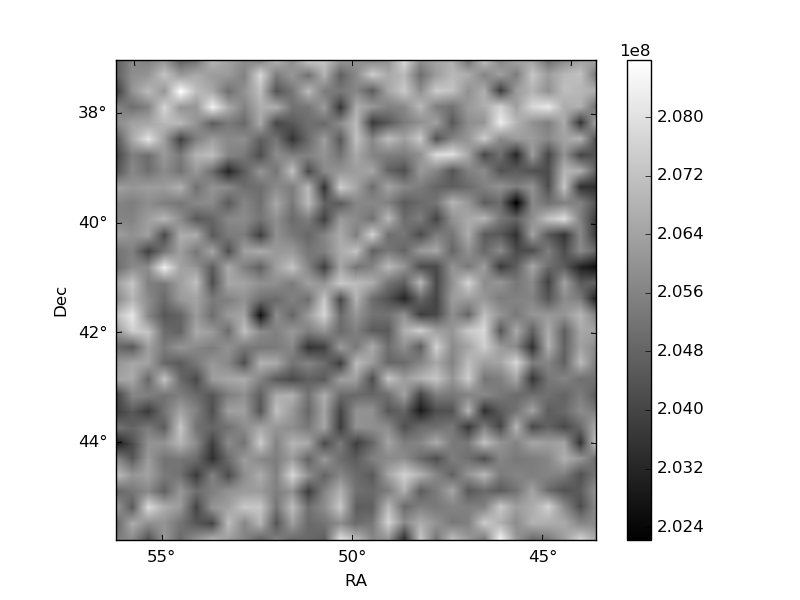
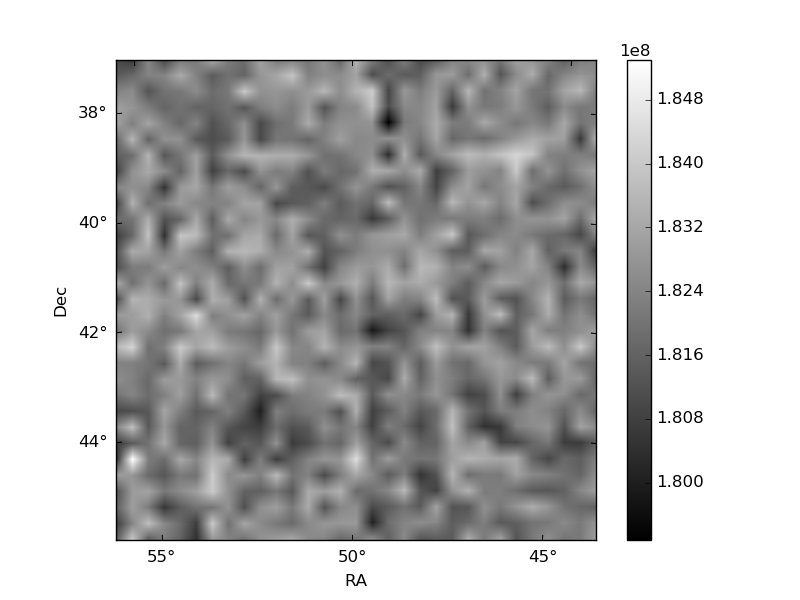
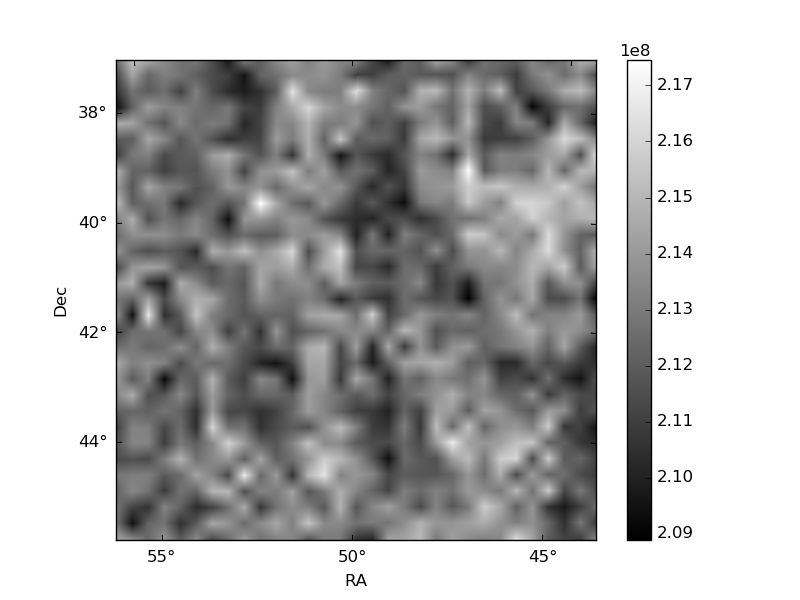
Histogram calculated using DETX and DETY for each event in the final _common_clean file
| Quadrant A | 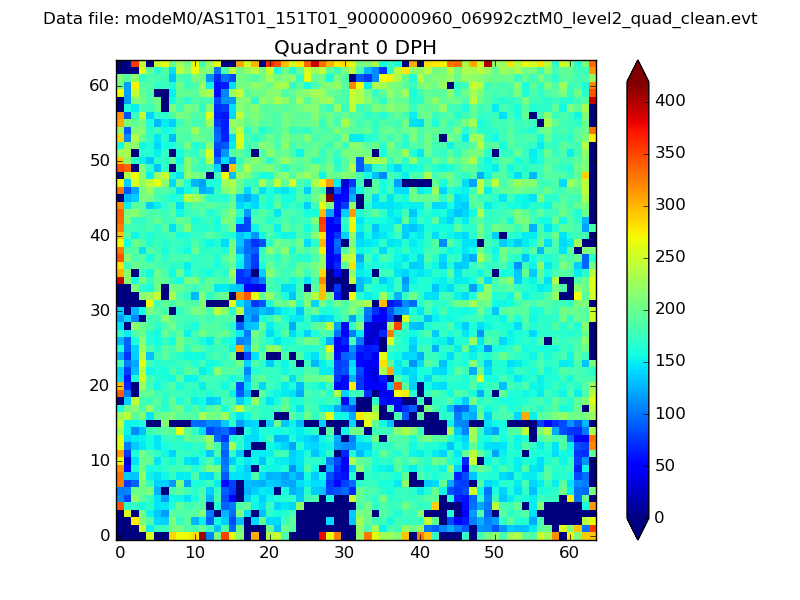 |
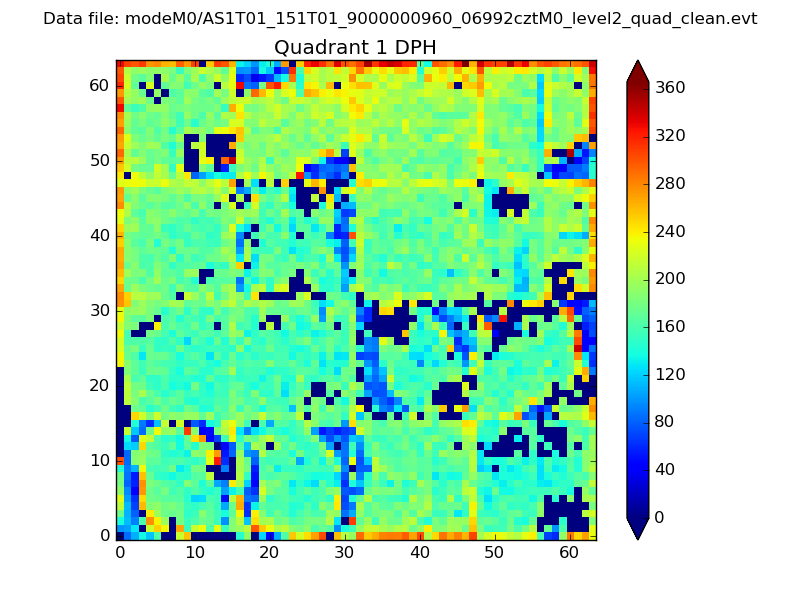 |
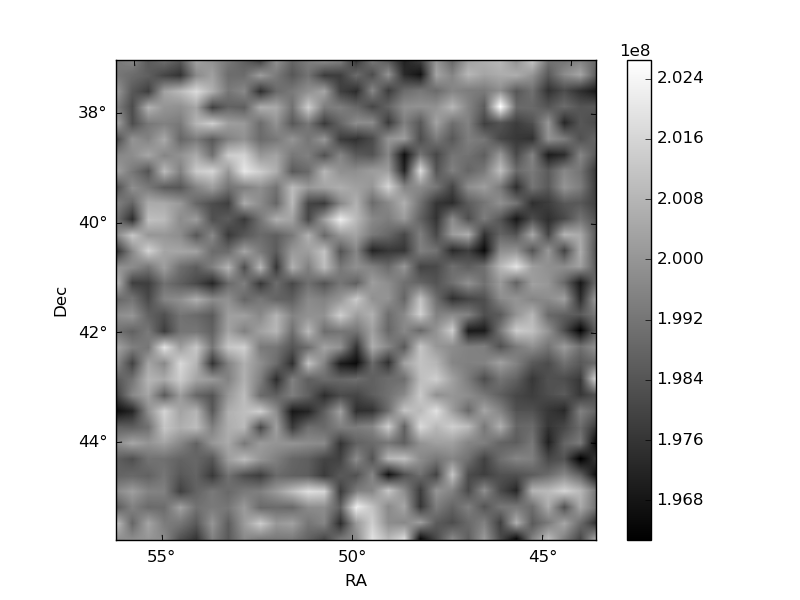
Quadrant B |
|---|---|---|---|
| Quadrant D | 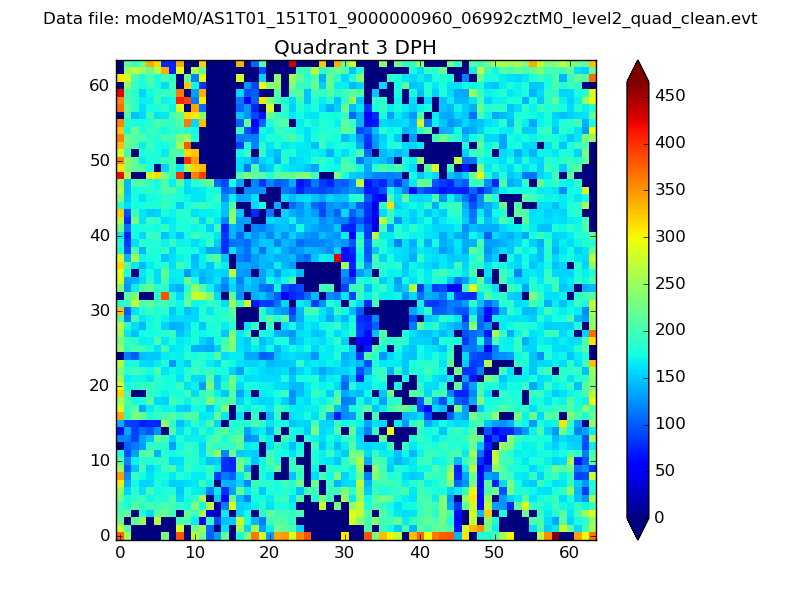 |
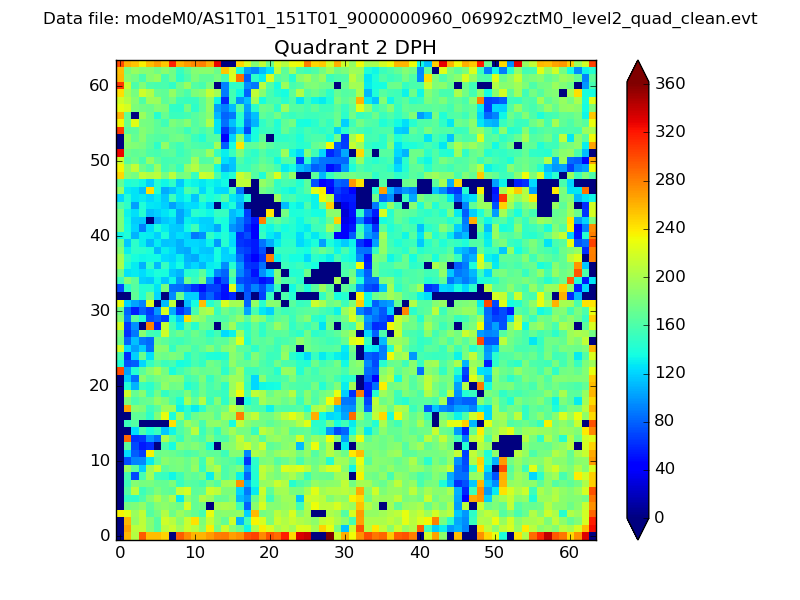 |
Quadrant C |
| Plot type | Count rate plots | Images |
|---|---|---|
| Comparison with Poisson distribution Blue bars denote a histogram of data divided into 1 sec bins. Red curve is a Poisson curve with rate = median count rate of data. |
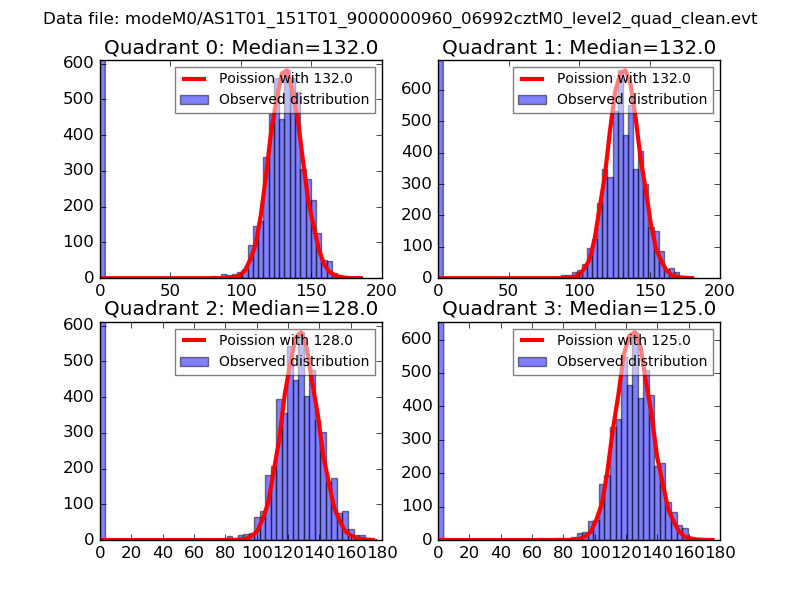 |
 |
| Quadrant-wise count rates Data is divided into 100 sec bins |
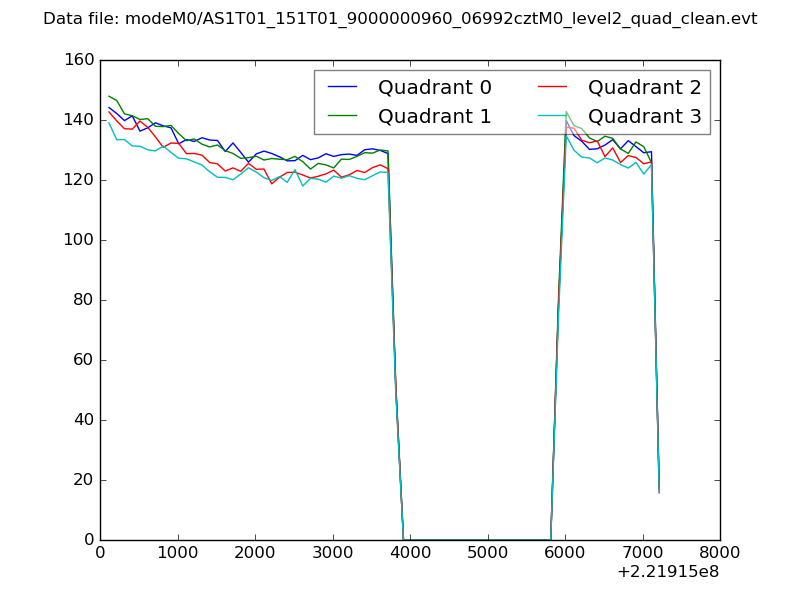 |
|
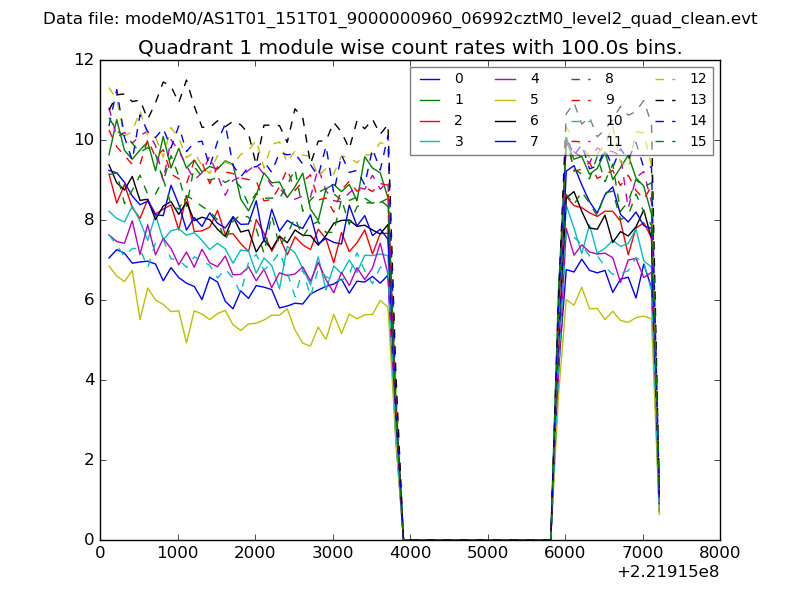
| Module-wise count rates for Quadrant A Data is divided into 100 sec bins |
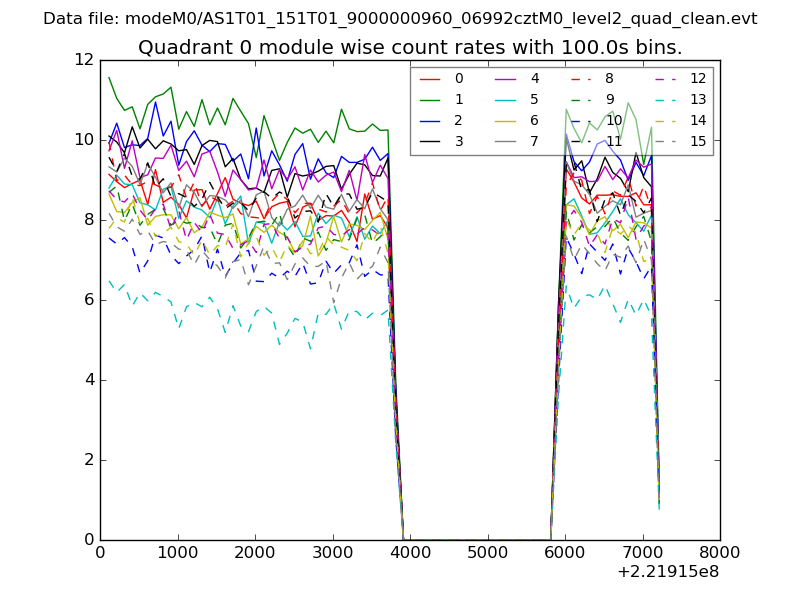 |
 |
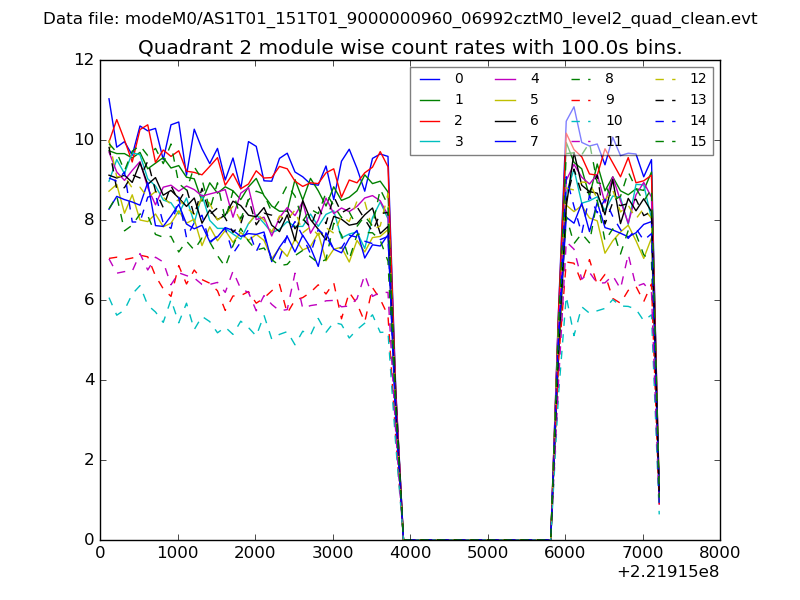
| Module-wise count rates for Quadrant B Data is divided into 100 sec bins |
 |
 |
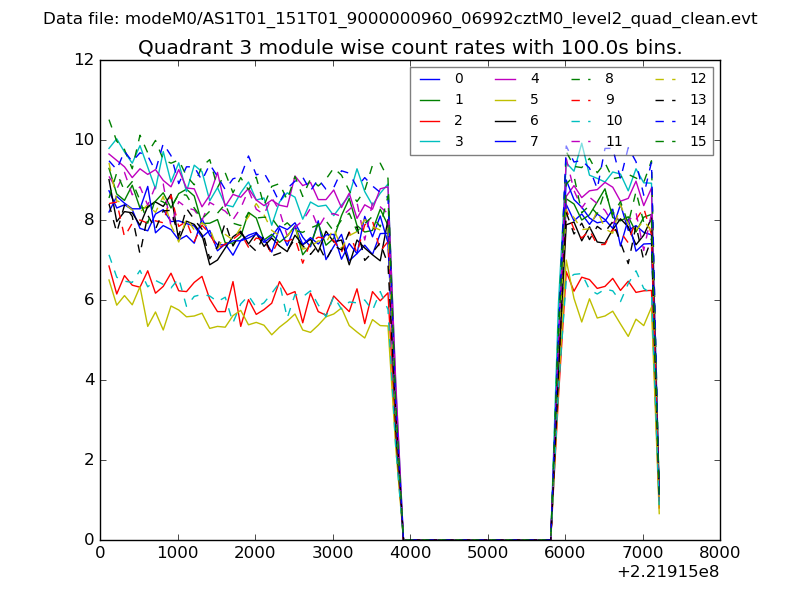
| Module-wise count rates for Quadrant C Data is divided into 100 sec bins |
 |
 |
| Module-wise count rates for Quadrant D Data is divided into 100 sec bins |
 |
 |
| Parameter | Plot |
|---|---|
| CZT HV Monitor | 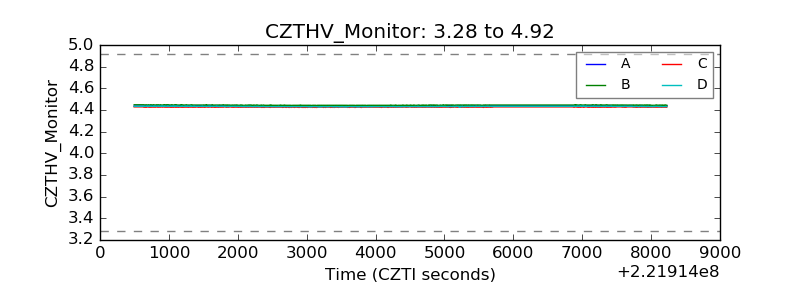 |
| D_VDD | 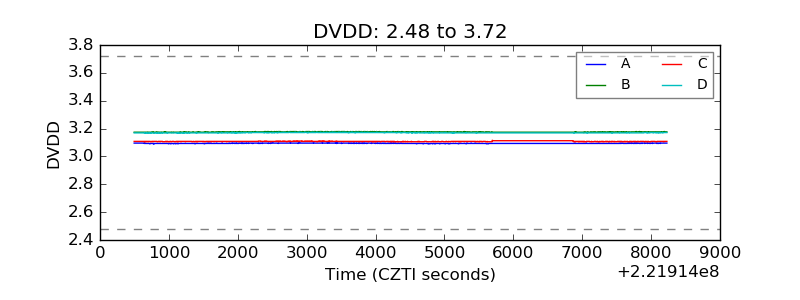 |
| Temperature 1 | 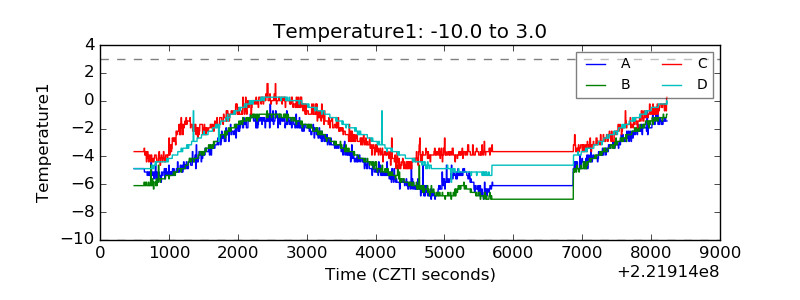 |
| Veto HV Monitor | 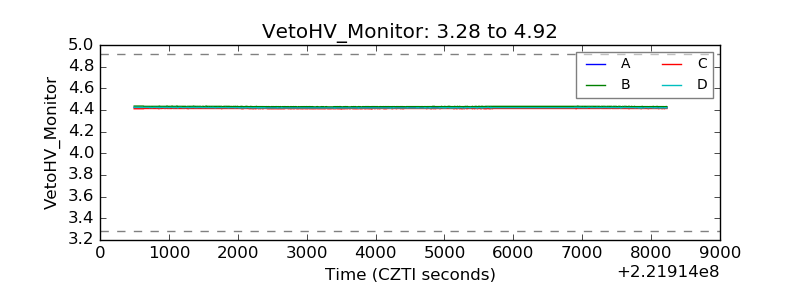 |
| Veto LLD | 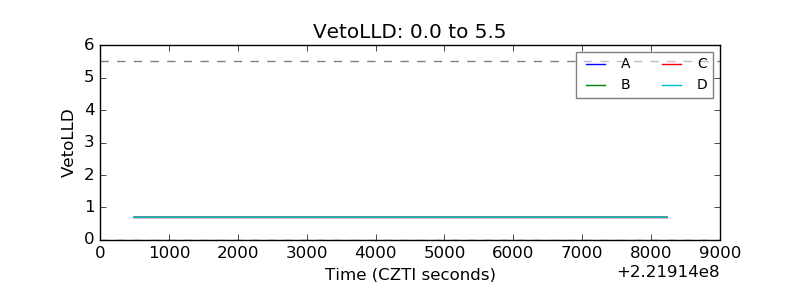 |
| Alpha Counter | 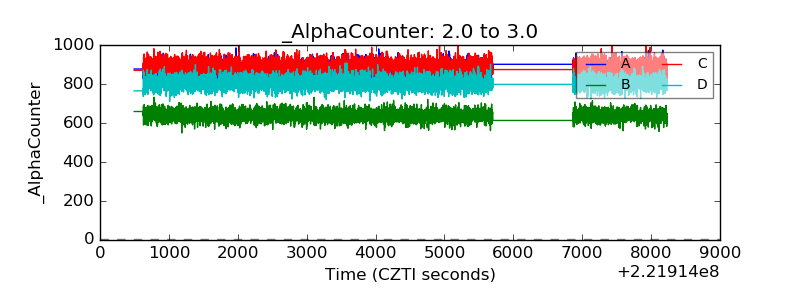 |
| _CPM_Rate | 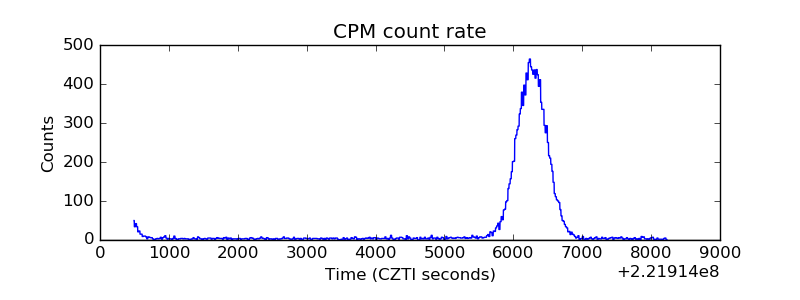 |
| CZT Counter | 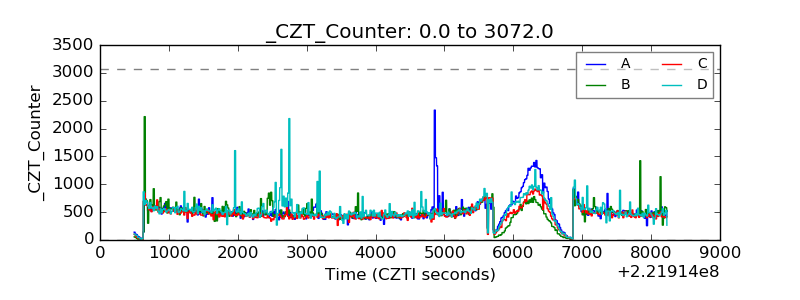 |
| +2.5 Volts monitor | 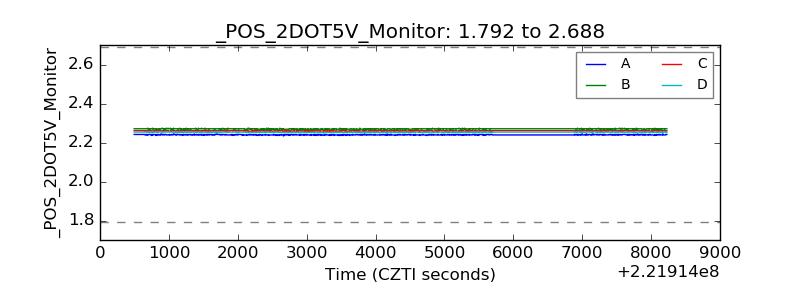 |
| +5 Volts monitor |  |
| _ROLL_ROT | 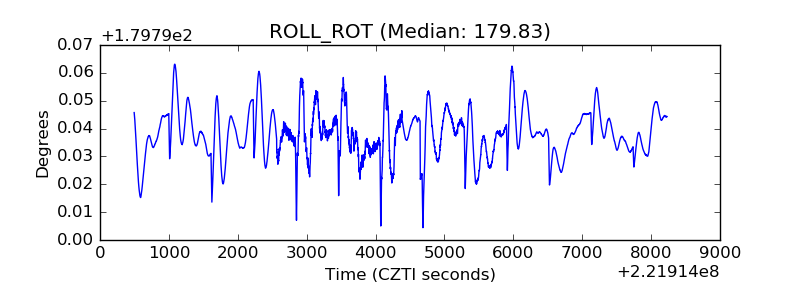 |
| _Roll_DEC |  |
| _Roll_RA | 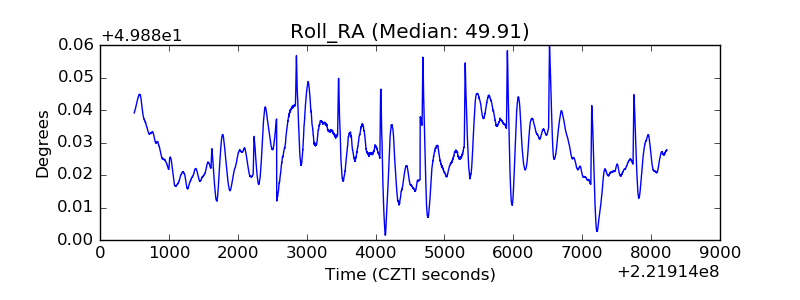 |
| Veto Counter | 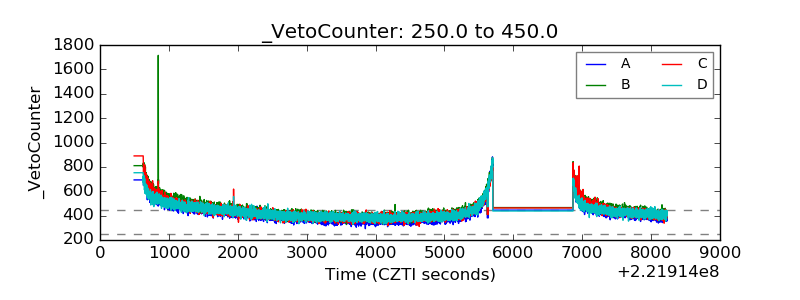 |