| Param | Original file | Final file |
|---|---|---|
| Filename | modeM0/AS1T01_151T01_9000000960_06995cztM0_level2.evt | modeM0/AS1T01_151T01_9000000960_06995cztM0_level2_quad_clean.evt |
| Size (bytes) | 495,685,440 | 105,917,760 |
| Size | 472.7 MB | 101.0 MB |
| Events in quadrant A | 3,525,730 | 677,840 |
| Events in quadrant B | 3,756,614 | 679,562 |
| Events in quadrant C | 3,450,214 | 666,427 |
| Events in quadrant D | 3,758,938 | 651,146 |
| Mode SS | |||
|---|---|---|---|
| Quadrant | BADHDUFLAG | Total packets | Discarded packets |
| A | 0 | 154 | 0 |
| B | 0 | 154 | 0 |
| C | 0 | 154 | 0 |
| D | 0 | 154 | 0 |
| Mode M9 | |||
|---|---|---|---|
| Quadrant | BADHDUFLAG | Total packets | Discarded packets |
| A | 0 | 5 | 0 |
| B | 0 | 5 | 0 |
| C | 0 | 5 | 0 |
| D | 0 | 6 | 0 |
| Mode M0 | |||
|---|---|---|---|
| Quadrant | BADHDUFLAG | Total packets | Discarded packets |
| A | 0 | 15890 | 3 |
| B | 0 | 16357 | 2 |
| C | 0 | 15799 | 2 |
| D | 0 | 16339 | 2 |
| Quadrant | Total seconds | Saturated seconds | Saturation percentage |
|---|---|---|---|
| A | 7664 | 67 | 0.874217% |
| B | 7664 | 88 | 1.148225% |
| C | 7664 | 27 | 0.352296% |
| D | 7664 | 44 | 0.574113% |
Noise dominated data is calculated using 1-second bins in cleaned event files. If a bin has >2000 counts, and if more than 50% of those come from <1% of pixels, then it is considered to be noise-dominated and hence unusable.
| Quadrant | # 1 sec bins | Bins with >0 counts | Bins with >2000 counts | High rate bins dominated by noise | Noise dominated (total time) | Noise dominated (detector-on time) | Marked lightcurve |
|---|---|---|---|---|---|---|---|
| A | 7919 | 7666 | 0 | 0 | 0.00% | 0.00% | 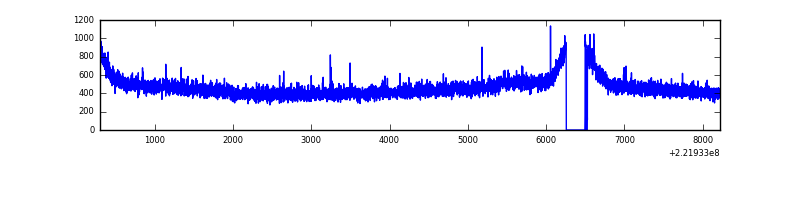 |
| B | 7919 | 7666 | 1 | 1 | 0.01% | 0.01% | 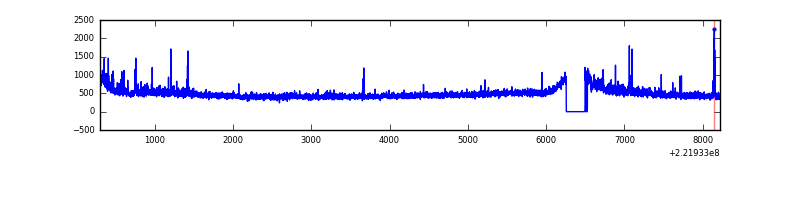 |
| C | 7919 | 7666 | 0 | 0 | 0.00% | 0.00% | 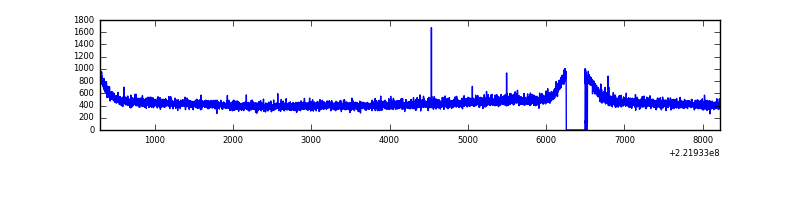 |
| D | 7919 | 7666 | 5 | 5 | 0.06% | 0.07% | 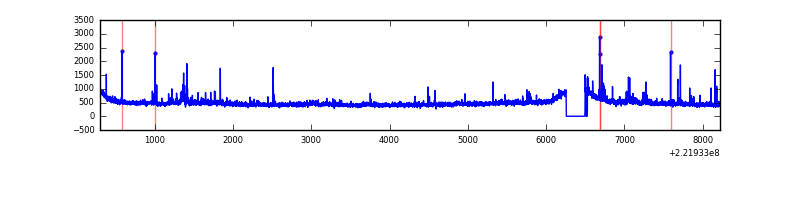 |
Top three noisy pixels from each quadrant. If the there are fewer than three noisy pixels in the level2.evt file, extra rows are filled as -1
| Pixel properties | Quadrant properties | ||||||
|---|---|---|---|---|---|---|---|
| Quadrant | DetID | PixID | Counts | Sigma | Mean | Median | Sigma |
| A | 15 | 234 | 10645 | 52.58 | 909 | 888 | 185.6 |
| A | 0 | 226 | 8858 | 42.95 | 909 | 888 | 185.6 |
| A | 12 | 194 | 8460 | 40.8 | 909 | 888 | 185.6 |
| B | 0 | 214 | 91650 | 516.13 | 911 | 889 | 175.9 |
| B | 4 | 173 | 40573 | 225.67 | 911 | 889 | 175.9 |
| B | 15 | 85 | 25595 | 140.49 | 911 | 889 | 175.9 |
| C | 13 | 61 | 6900 | 29.26 | 881 | 888 | 205.5 |
| C | 8 | 128 | 4370 | 16.95 | 881 | 888 | 205.5 |
| C | 8 | 112 | 2938 | 9.98 | 881 | 888 | 205.5 |
| D | 8 | 195 | 256096 | 1165.25 | 890 | 859 | 219.0 |
| D | 14 | 34 | 44061 | 197.23 | 890 | 859 | 219.0 |
| D | 7 | 55 | 22812 | 100.22 | 890 | 859 | 219.0 |
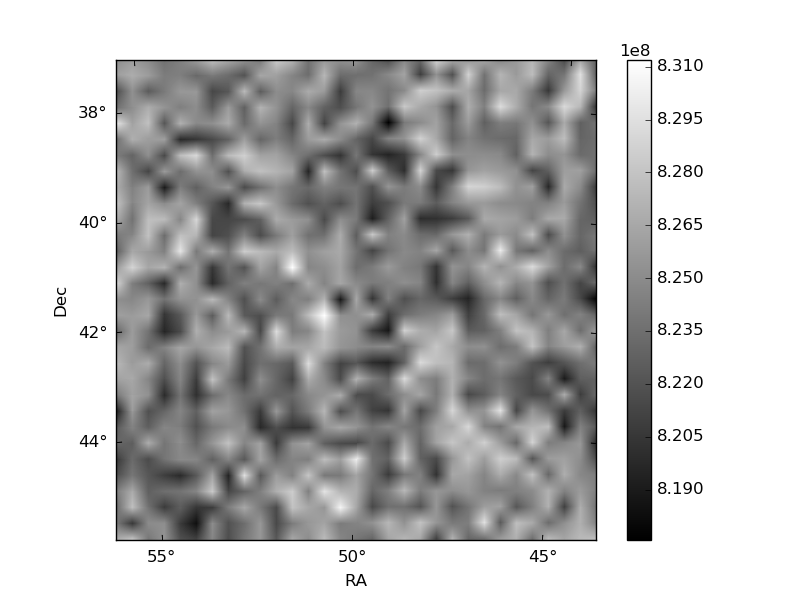
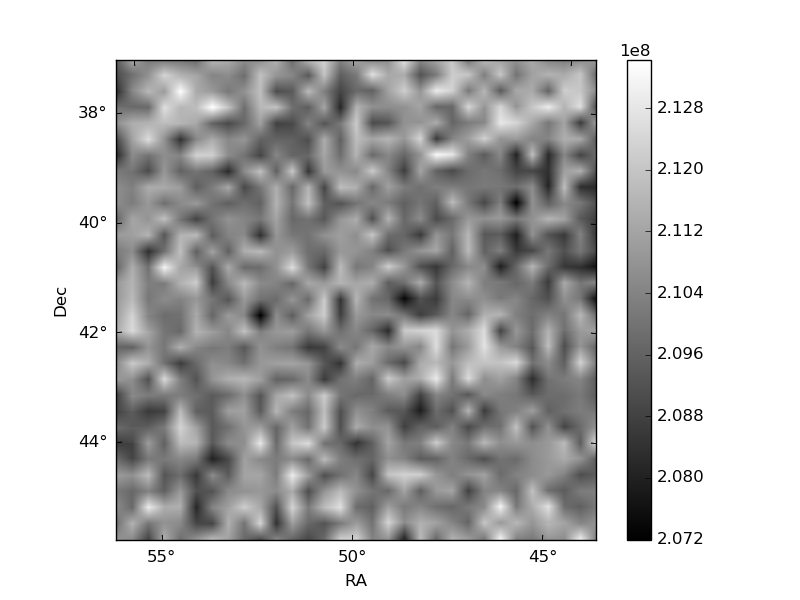
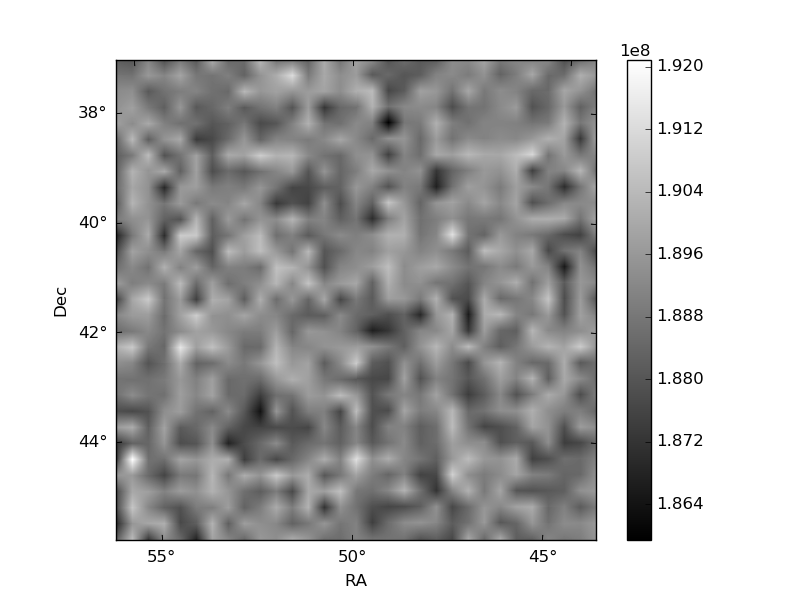
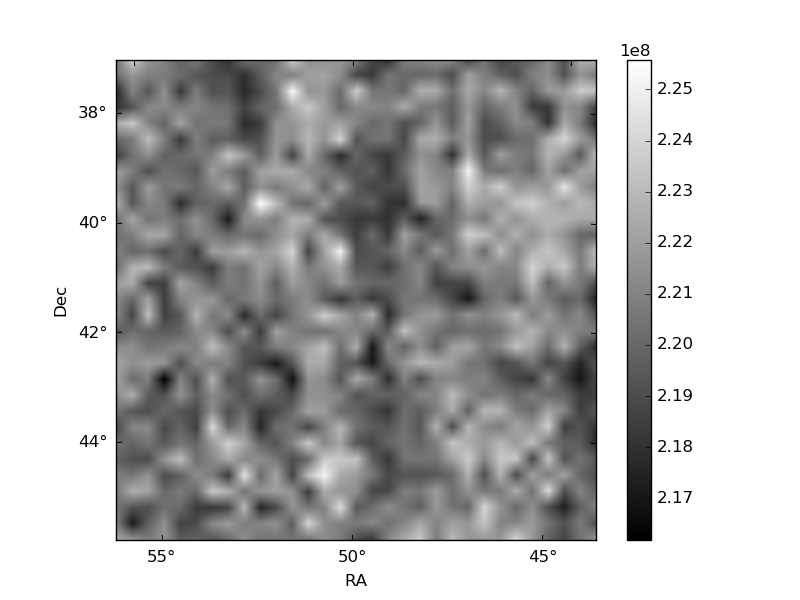
Histogram calculated using DETX and DETY for each event in the final _common_clean file
| Quadrant A | 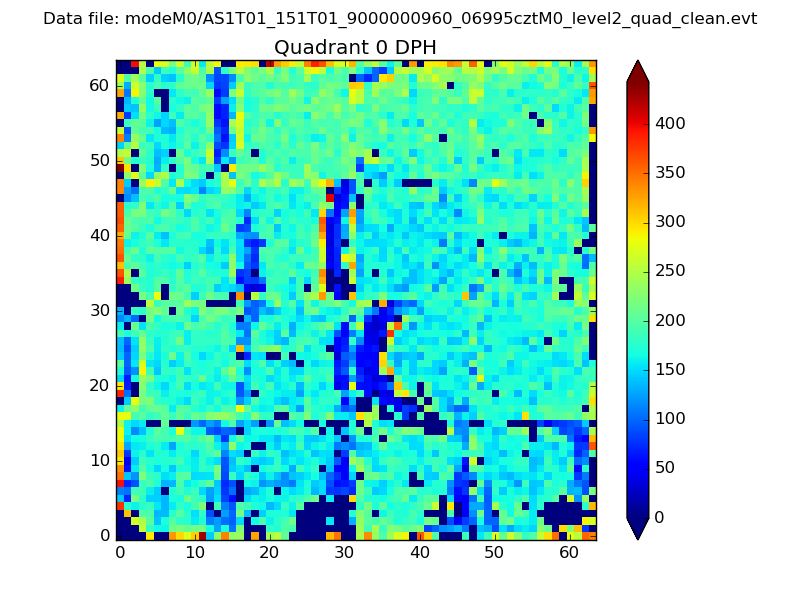 |
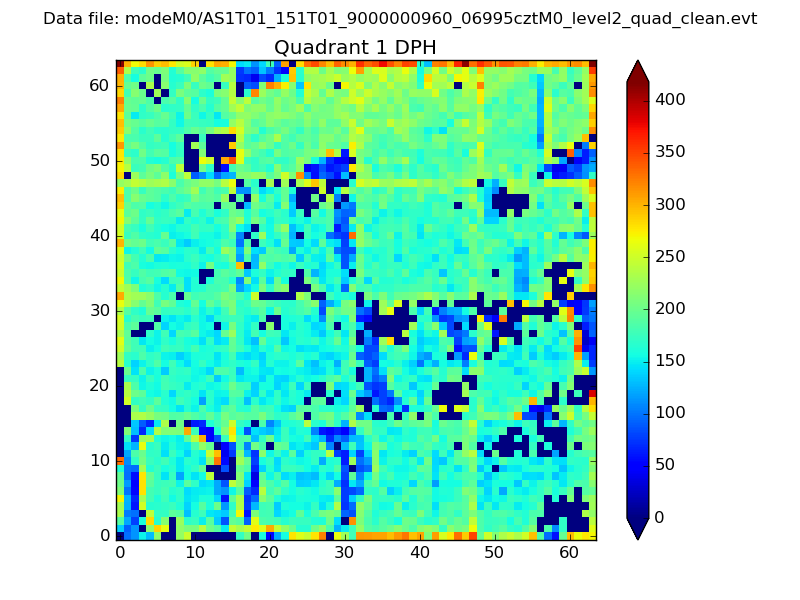 |
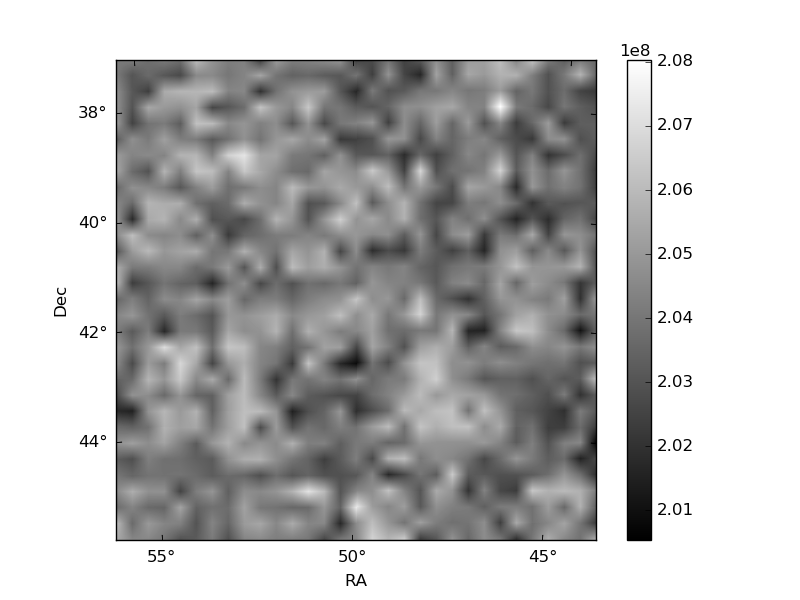
Quadrant B |
|---|---|---|---|
| Quadrant D | 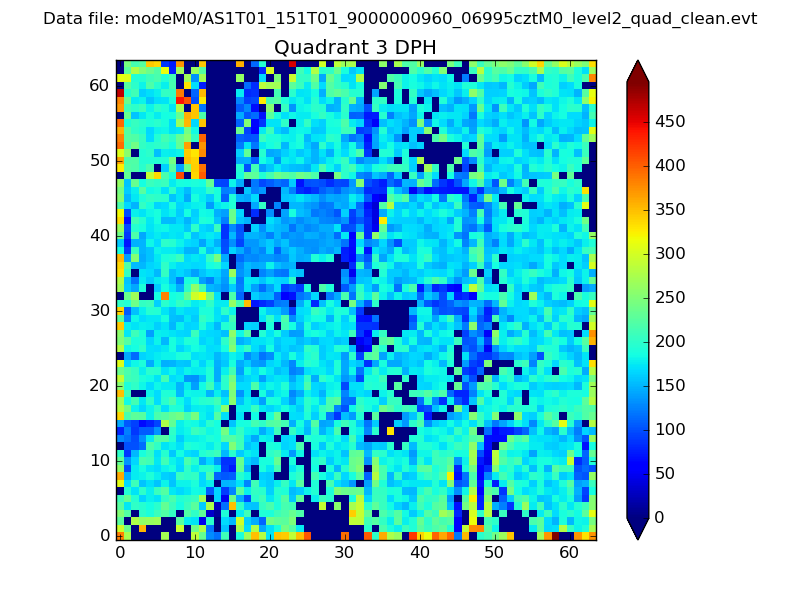 |
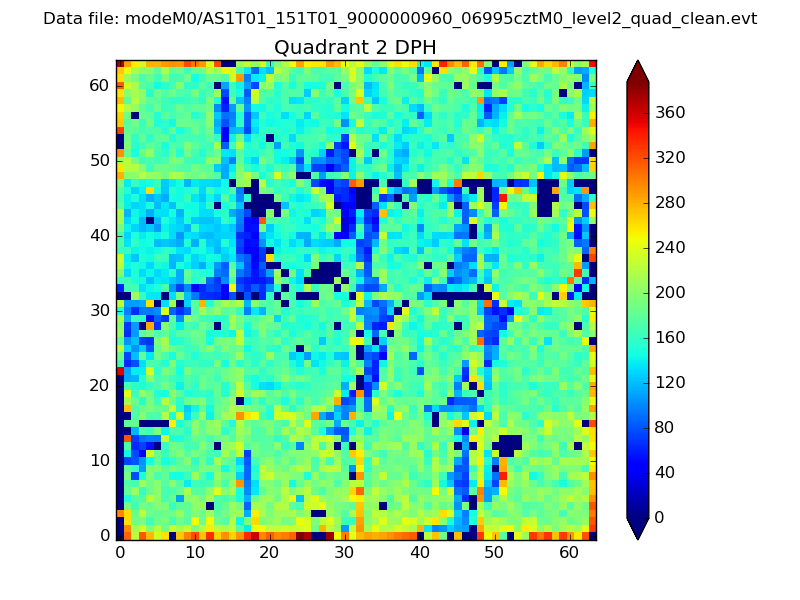 |
Quadrant C |
| Plot type | Count rate plots | Images |
|---|---|---|
| Comparison with Poisson distribution Blue bars denote a histogram of data divided into 1 sec bins. Red curve is a Poisson curve with rate = median count rate of data. |
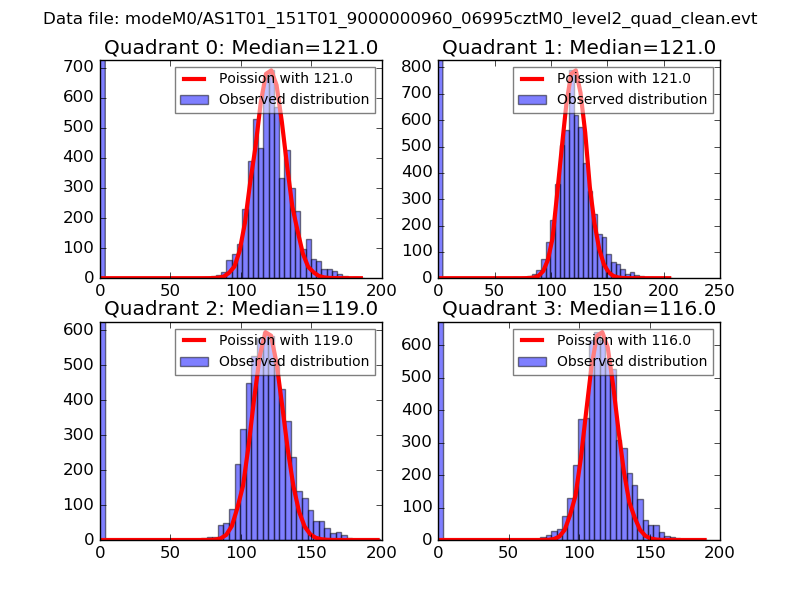 |
 |
| Quadrant-wise count rates Data is divided into 100 sec bins |
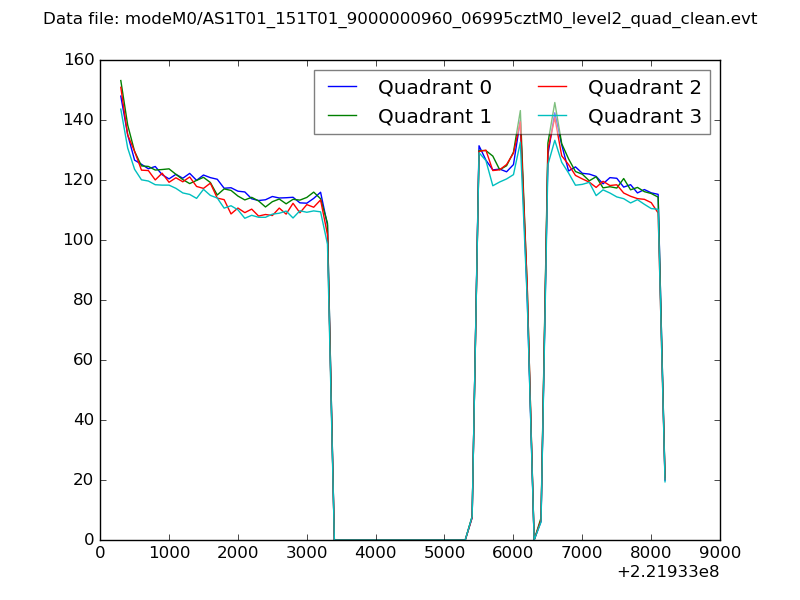 |
|
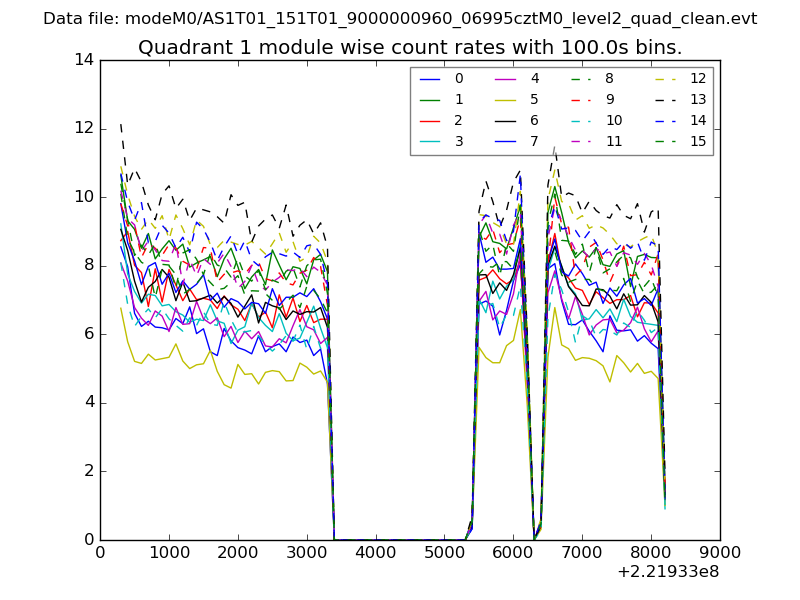
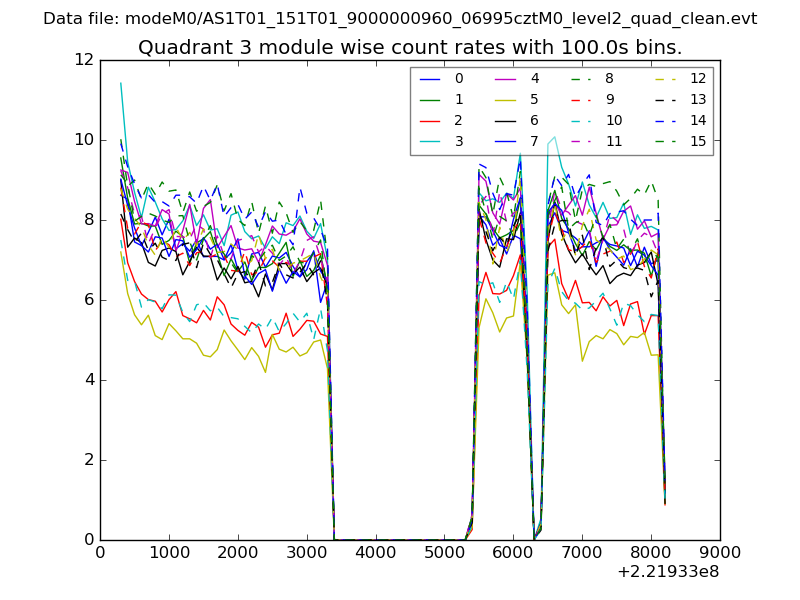
| Module-wise count rates for Quadrant A Data is divided into 100 sec bins |
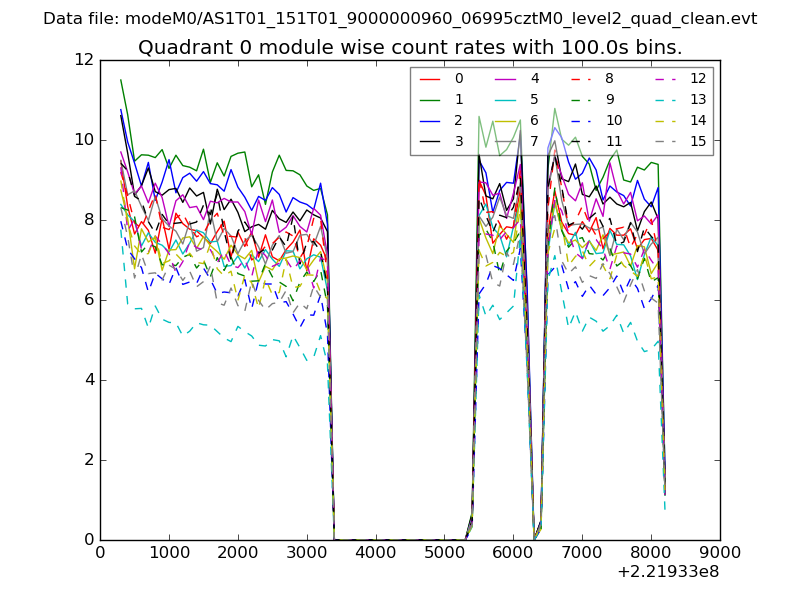 |
 |
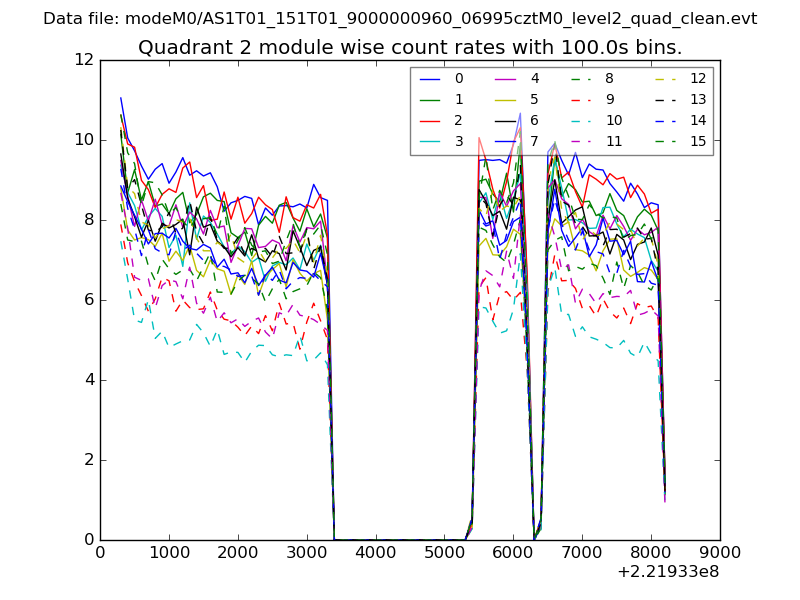
| Module-wise count rates for Quadrant B Data is divided into 100 sec bins |
 |
 |
| Module-wise count rates for Quadrant C Data is divided into 100 sec bins |
 |
 |
| Module-wise count rates for Quadrant D Data is divided into 100 sec bins |
 |
 |
| Parameter | Plot |
|---|---|
| CZT HV Monitor | 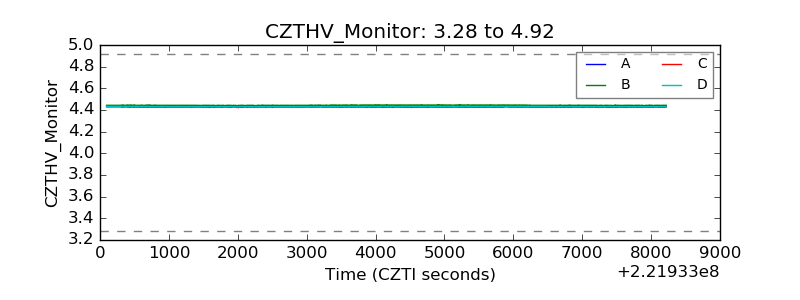 |
| D_VDD | 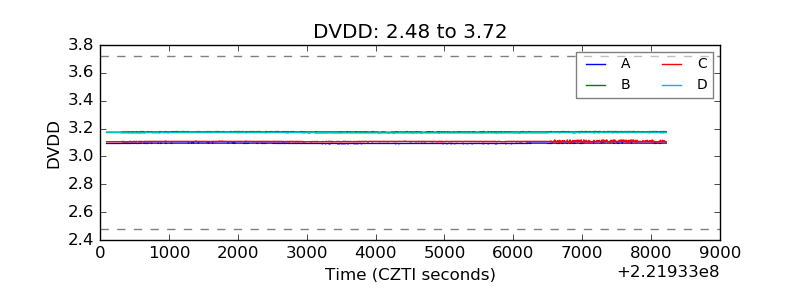 |
| Temperature 1 | 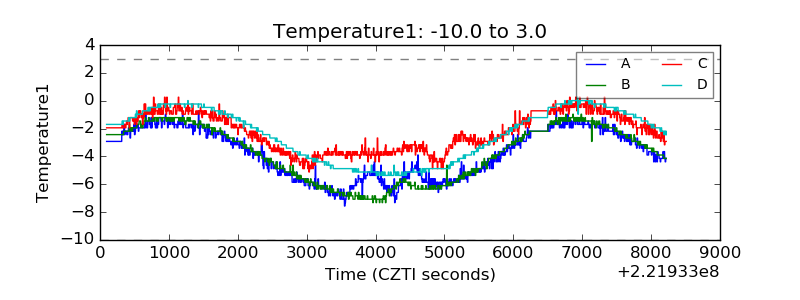 |
| Veto HV Monitor | 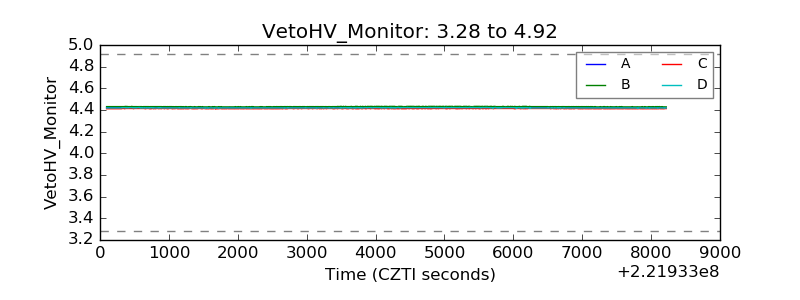 |
| Veto LLD | 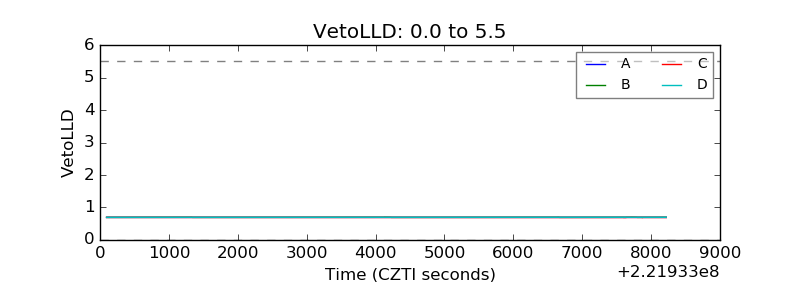 |
| Alpha Counter | 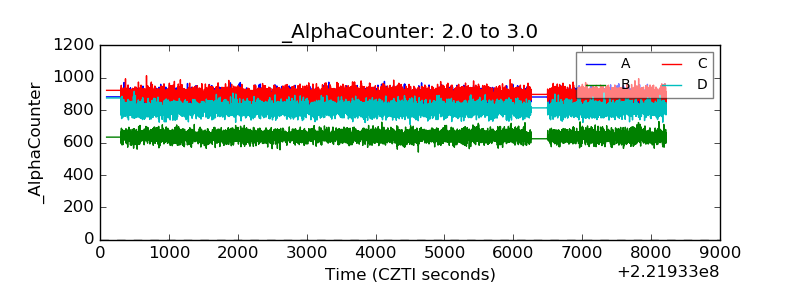 |
| _CPM_Rate | 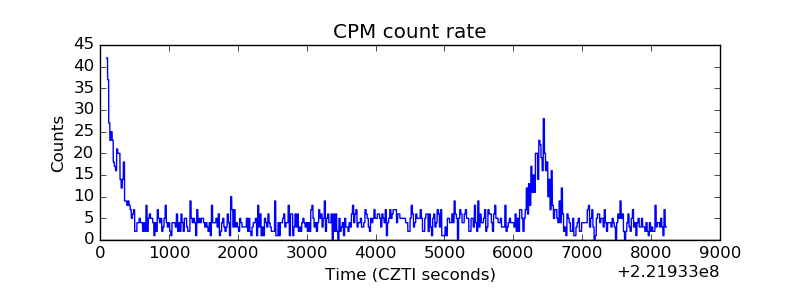 |
| CZT Counter | 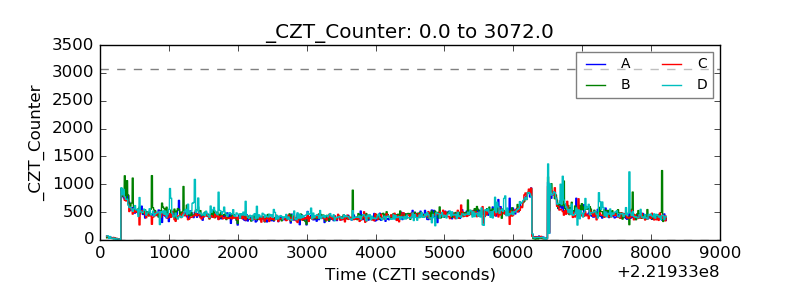 |
| +2.5 Volts monitor | 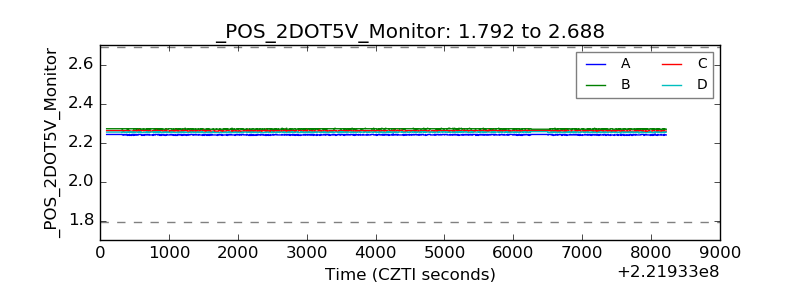 |
| +5 Volts monitor |  |
| _ROLL_ROT | 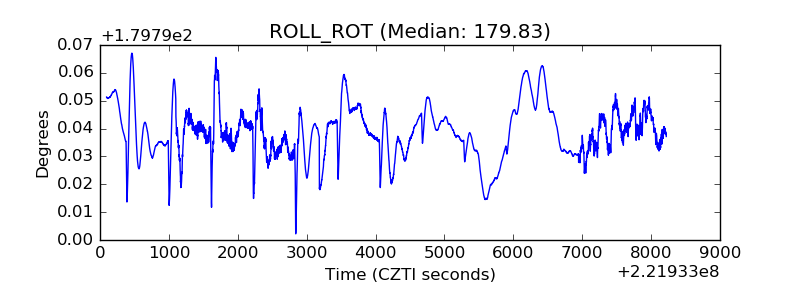 |
| _Roll_DEC | 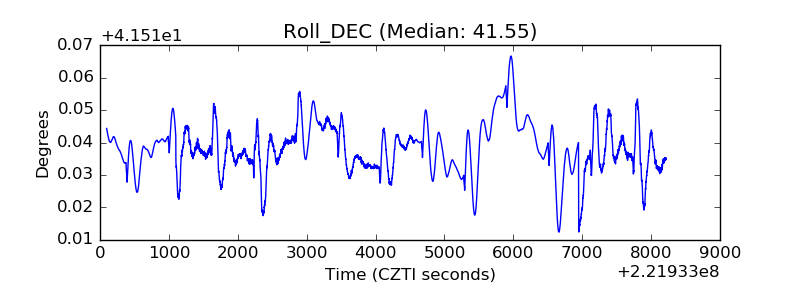 |
| _Roll_RA | 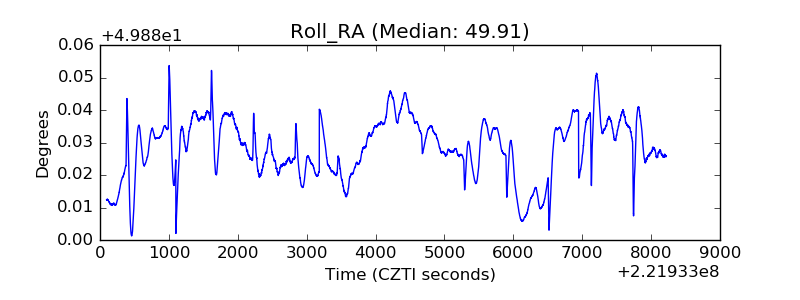 |
| Veto Counter | 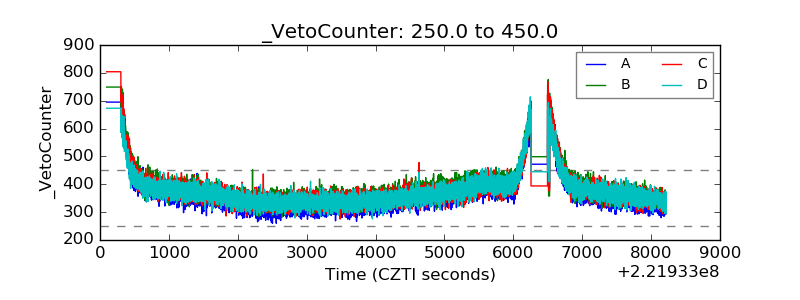 |