| Param | Original file | Final file |
|---|---|---|
| Filename | modeM0/AS1T01_151T01_9000000960_06996cztM0_level2.evt | modeM0/AS1T01_151T01_9000000960_06996cztM0_level2_quad_clean.evt |
| Size (bytes) | 523,990,080 | 111,191,040 |
| Size | 499.7 MB | 106.0 MB |
| Events in quadrant A | 3,712,665 | 712,251 |
| Events in quadrant B | 3,948,993 | 716,961 |
| Events in quadrant C | 3,627,803 | 704,025 |
| Events in quadrant D | 4,040,034 | 681,927 |
| Mode SS | |||
|---|---|---|---|
| Quadrant | BADHDUFLAG | Total packets | Discarded packets |
| A | 0 | 162 | 0 |
| B | 0 | 162 | 0 |
| C | 0 | 162 | 0 |
| D | 0 | 162 | 0 |
| Mode M9 | |||
|---|---|---|---|
| Quadrant | BADHDUFLAG | Total packets | Discarded packets |
| A | 0 | 6 | 0 |
| B | 0 | 6 | 0 |
| C | 0 | 6 | 0 |
| D | 0 | 6 | 0 |
| Mode M0 | |||
|---|---|---|---|
| Quadrant | BADHDUFLAG | Total packets | Discarded packets |
| A | 0 | 16664 | 3 |
| B | 0 | 17157 | 2 |
| C | 0 | 16480 | 2 |
| D | 0 | 17281 | 2 |
| Quadrant | Total seconds | Saturated seconds | Saturation percentage |
|---|---|---|---|
| A | 7949 | 77 | 0.968675% |
| B | 7949 | 101 | 1.270600% |
| C | 7949 | 32 | 0.402566% |
| D | 7949 | 73 | 0.918355% |
Noise dominated data is calculated using 1-second bins in cleaned event files. If a bin has >2000 counts, and if more than 50% of those come from <1% of pixels, then it is considered to be noise-dominated and hence unusable.
| Quadrant | # 1 sec bins | Bins with >0 counts | Bins with >2000 counts | High rate bins dominated by noise | Noise dominated (total time) | Noise dominated (detector-on time) | Marked lightcurve |
|---|---|---|---|---|---|---|---|
| A | 8504 | 7952 | 6 | 6 | 0.07% | 0.08% | 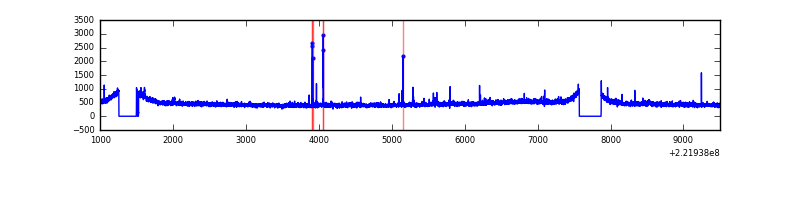 |
| B | 8504 | 7952 | 7 | 7 | 0.08% | 0.09% | 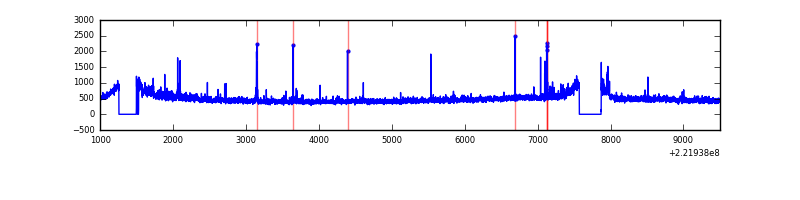 |
| C | 8504 | 7952 | 0 | 0 | 0.00% | 0.00% | 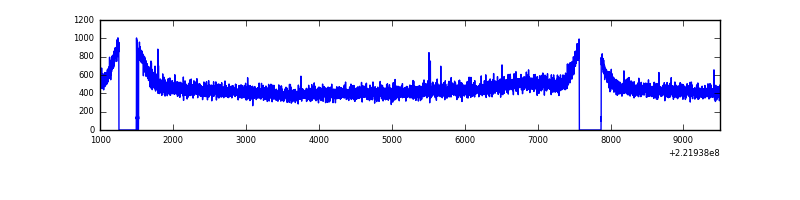 |
| D | 8504 | 7952 | 27 | 27 | 0.32% | 0.34% | 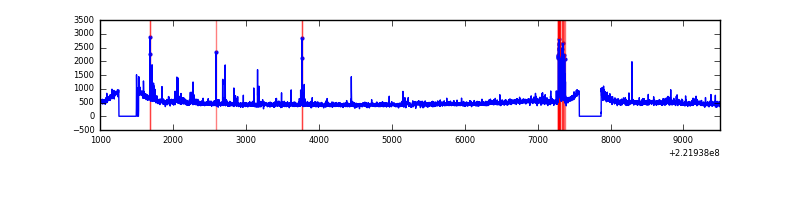 |
Top three noisy pixels from each quadrant. If the there are fewer than three noisy pixels in the level2.evt file, extra rows are filled as -1
| Pixel properties | Quadrant properties | ||||||
|---|---|---|---|---|---|---|---|
| Quadrant | DetID | PixID | Counts | Sigma | Mean | Median | Sigma |
| A | 13 | 248 | 24861 | 124.22 | 946 | 925 | 192.7 |
| A | 14 | 239 | 17344 | 85.21 | 946 | 925 | 192.7 |
| A | 15 | 234 | 14134 | 68.55 | 946 | 925 | 192.7 |
| B | 0 | 214 | 84290 | 453.85 | 949 | 926 | 183.7 |
| B | 0 | 228 | 54051 | 289.22 | 949 | 926 | 183.7 |
| B | 15 | 204 | 45226 | 241.18 | 949 | 926 | 183.7 |
| C | 8 | 128 | 13518 | 58.3 | 922 | 925 | 216.0 |
| C | 13 | 61 | 7143 | 28.79 | 922 | 925 | 216.0 |
| C | 8 | 112 | 7057 | 28.39 | 922 | 925 | 216.0 |
| D | 8 | 195 | 307247 | 1346.54 | 927 | 896 | 227.5 |
| D | 12 | 233 | 118996 | 519.1 | 927 | 896 | 227.5 |
| D | 14 | 34 | 24545 | 103.95 | 927 | 896 | 227.5 |
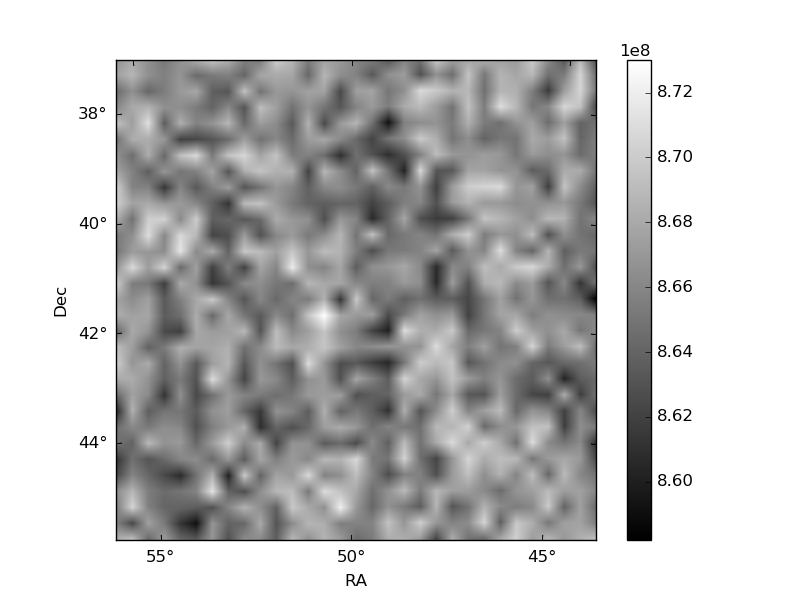
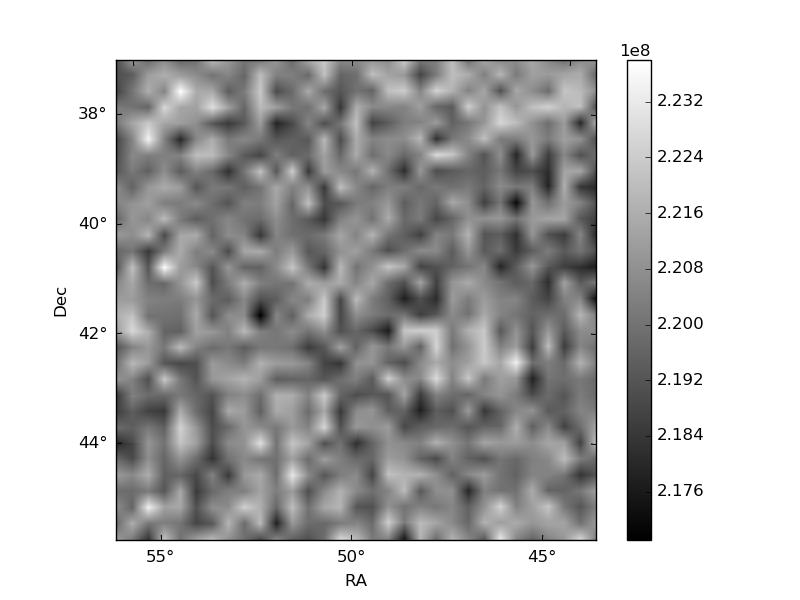
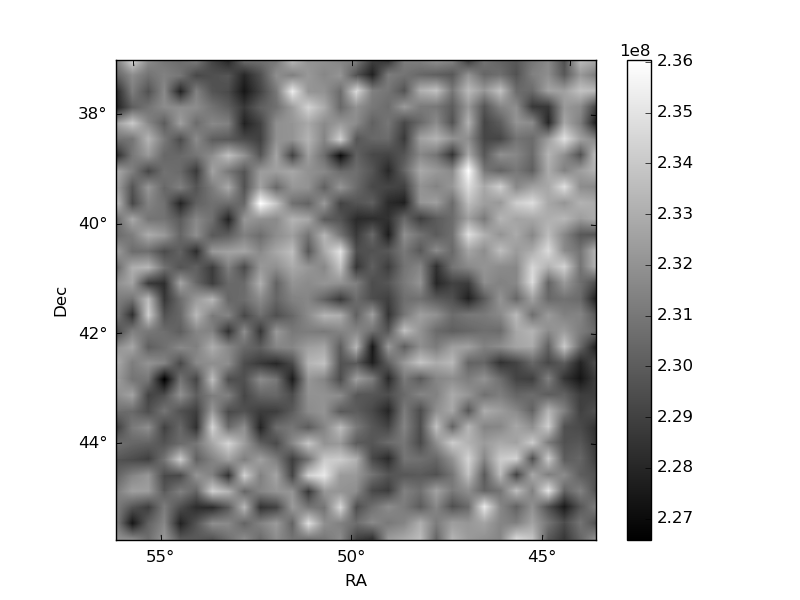
Histogram calculated using DETX and DETY for each event in the final _common_clean file
| Quadrant A | 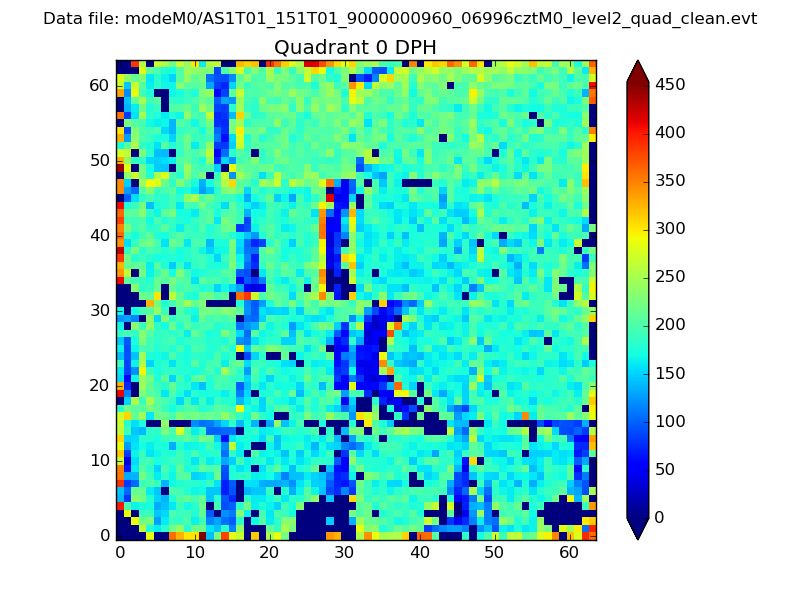 |
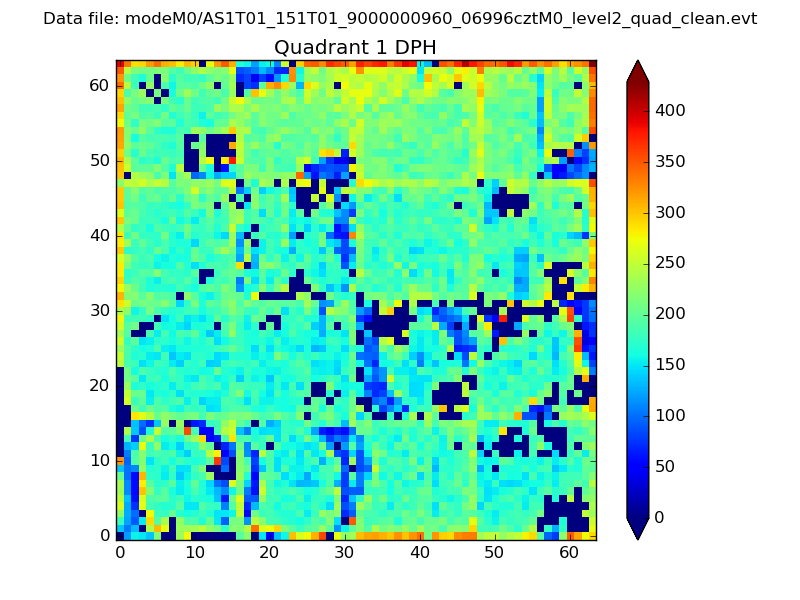 |
Quadrant B |
|---|---|---|---|
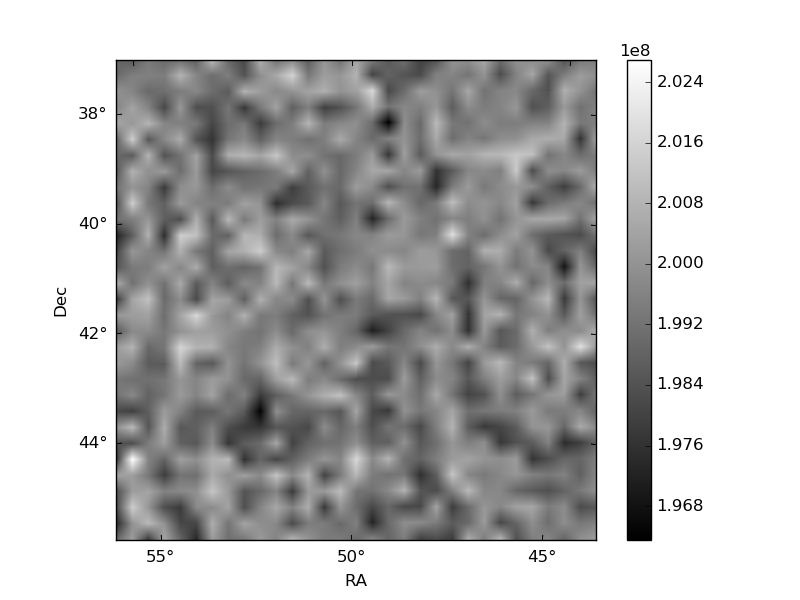
| Quadrant D | 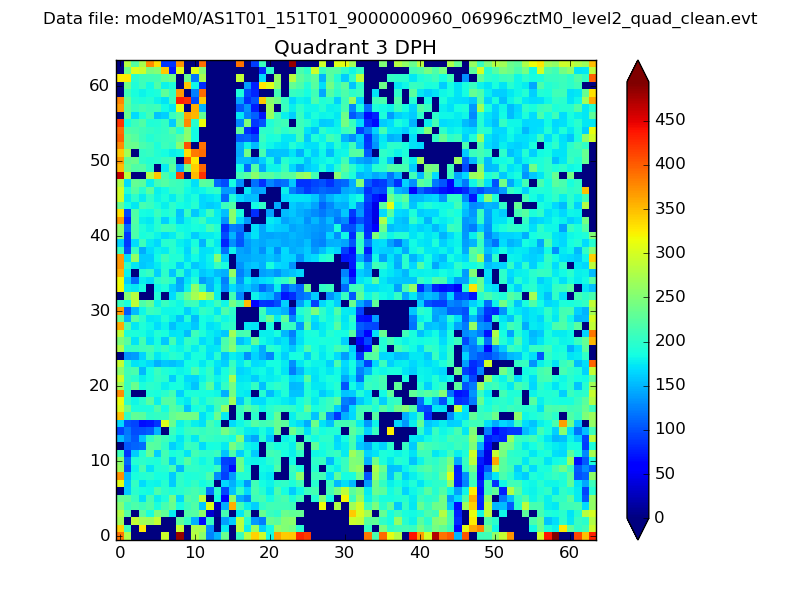 |
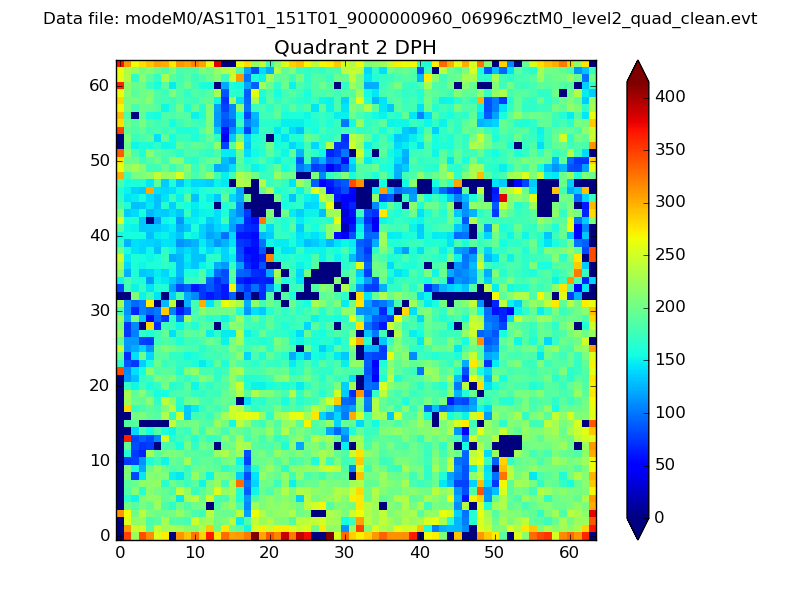 |
Quadrant C |
| Plot type | Count rate plots | Images |
|---|---|---|
| Comparison with Poisson distribution Blue bars denote a histogram of data divided into 1 sec bins. Red curve is a Poisson curve with rate = median count rate of data. |
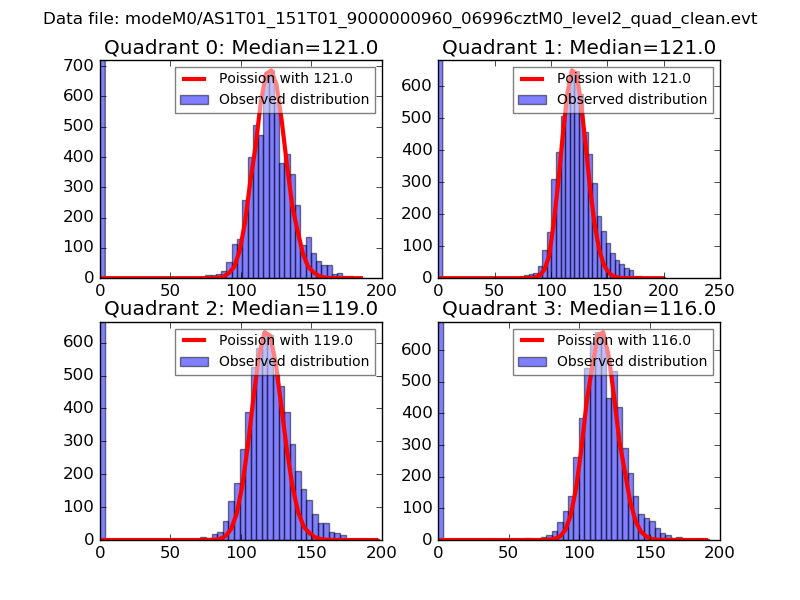 |
 |
| Quadrant-wise count rates Data is divided into 100 sec bins |
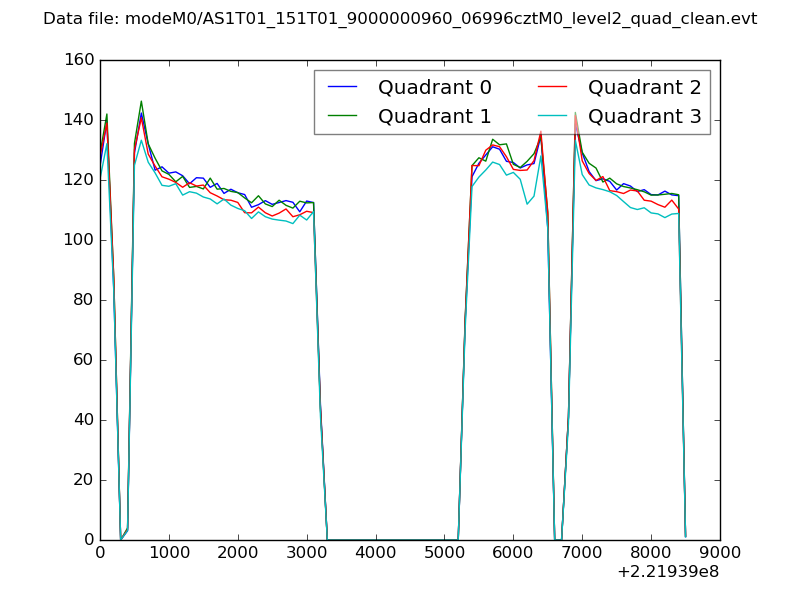 |
|
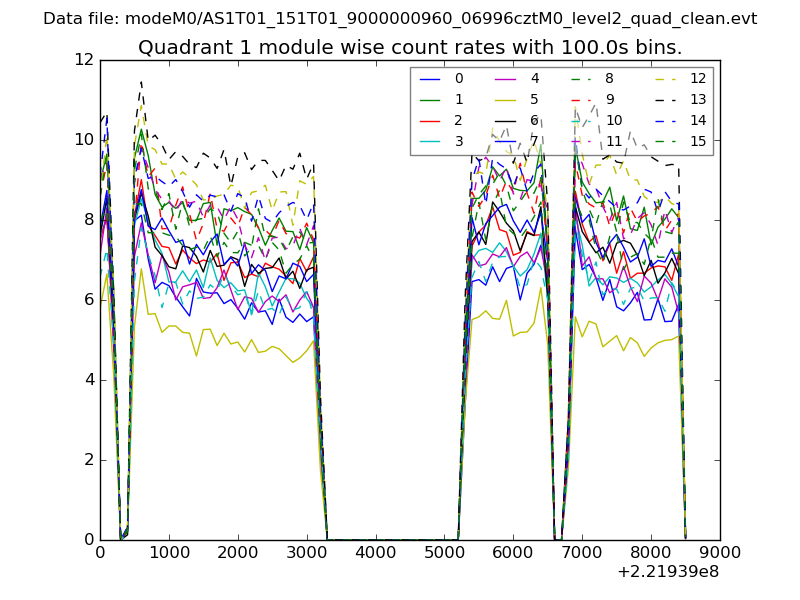
| Module-wise count rates for Quadrant A Data is divided into 100 sec bins |
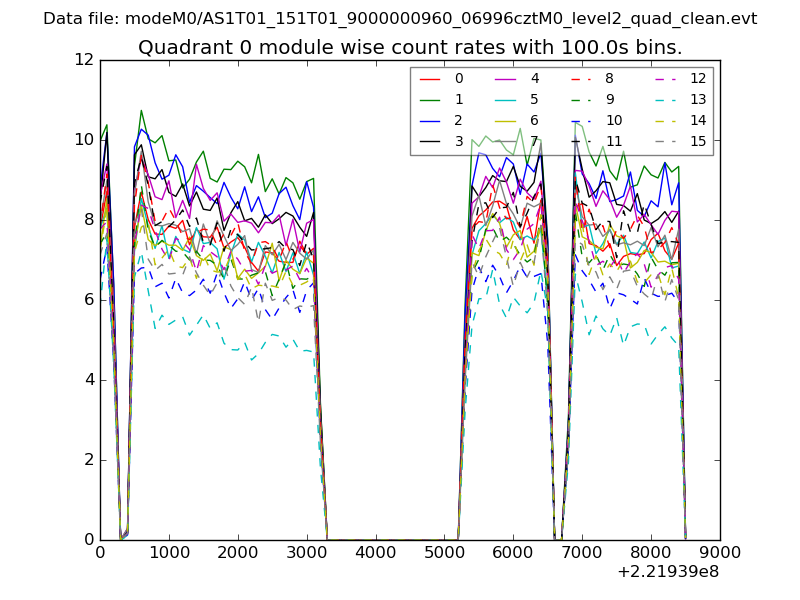 |
 |
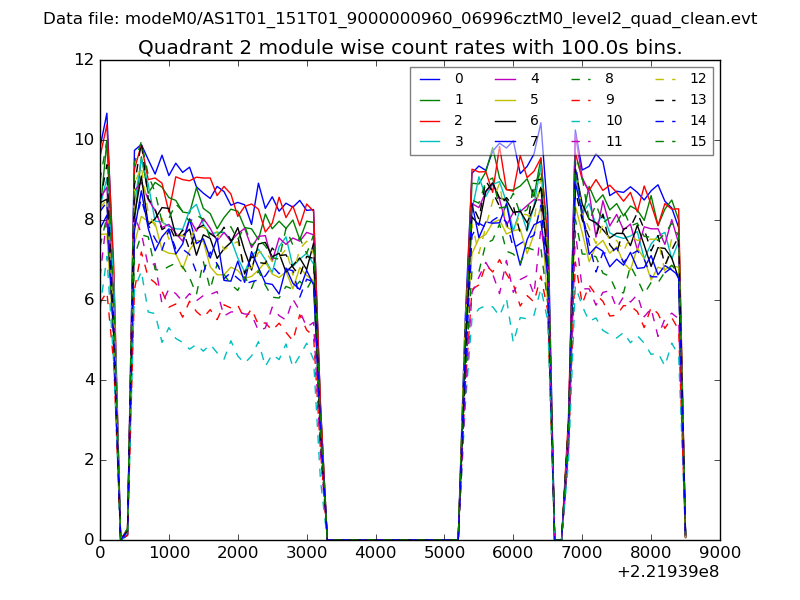
| Module-wise count rates for Quadrant B Data is divided into 100 sec bins |
 |
 |
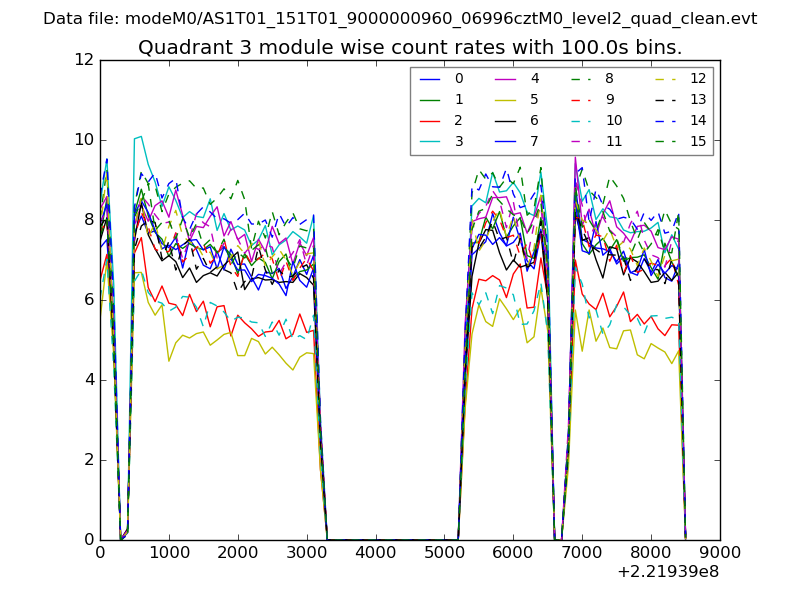
| Module-wise count rates for Quadrant C Data is divided into 100 sec bins |
 |
 |
| Module-wise count rates for Quadrant D Data is divided into 100 sec bins |
 |
 |
| Parameter | Plot |
|---|---|
| CZT HV Monitor | 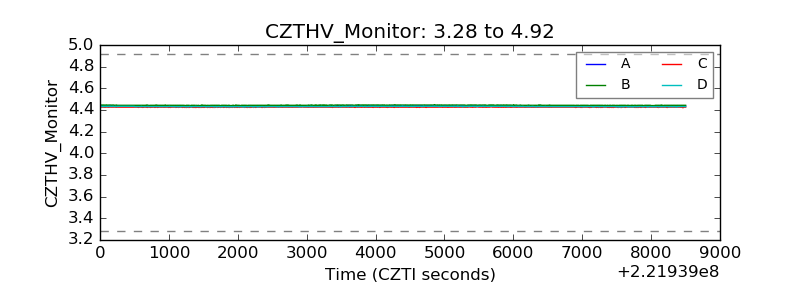 |
| D_VDD | 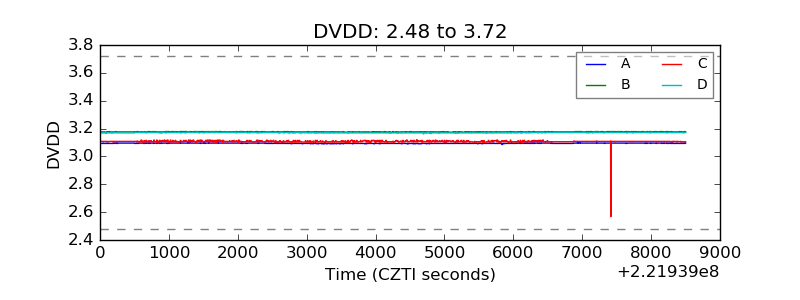 |
| Temperature 1 | 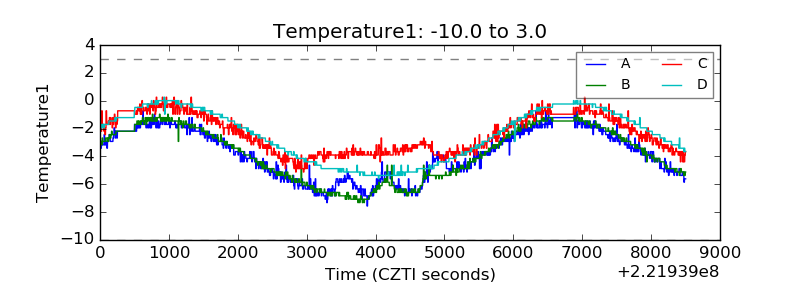 |
| Veto HV Monitor | 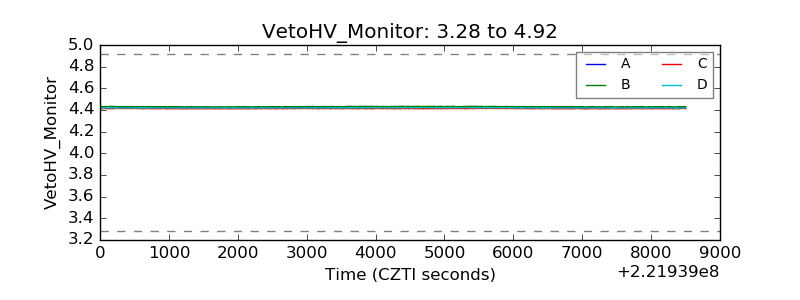 |
| Veto LLD | 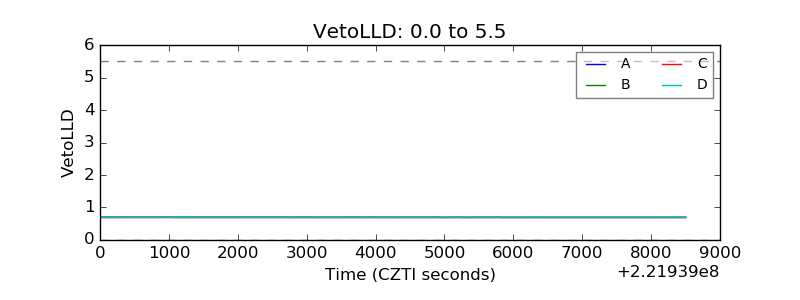 |
| Alpha Counter | 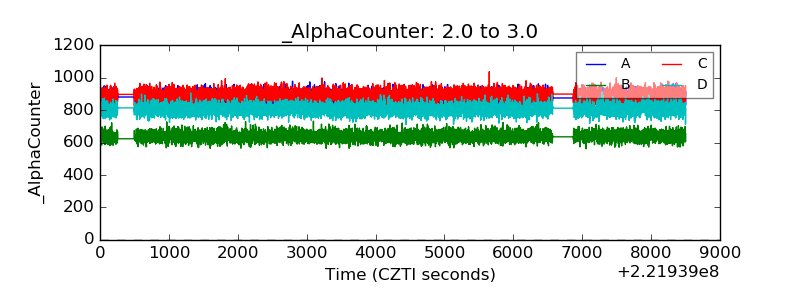 |
| _CPM_Rate | 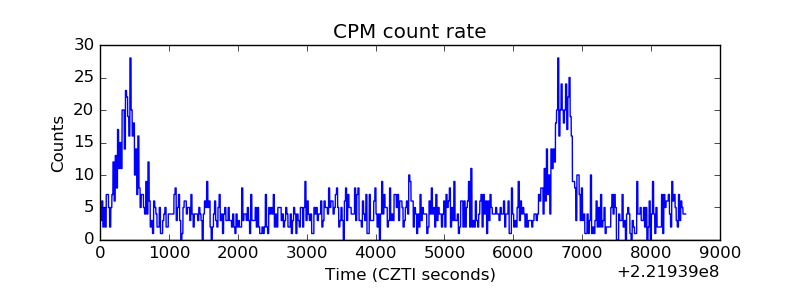 |
| CZT Counter | 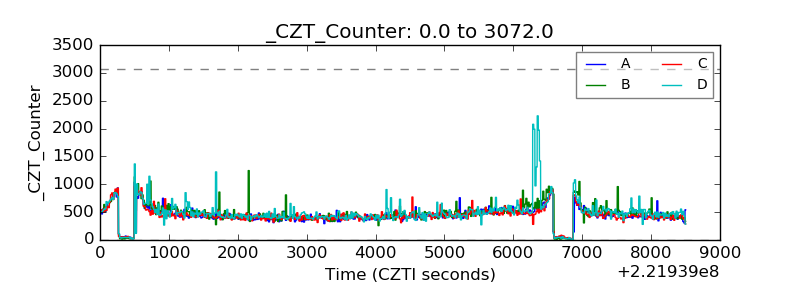 |
| +2.5 Volts monitor | 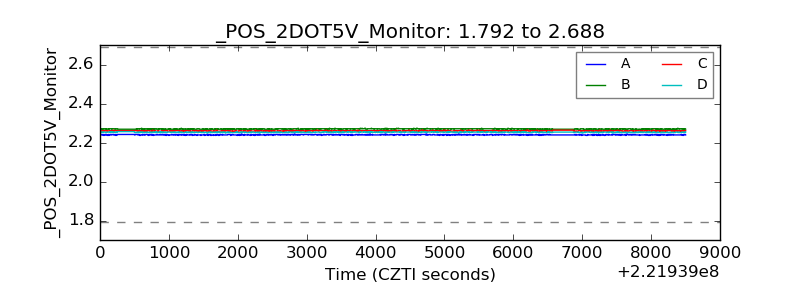 |
| +5 Volts monitor |  |
| _ROLL_ROT | 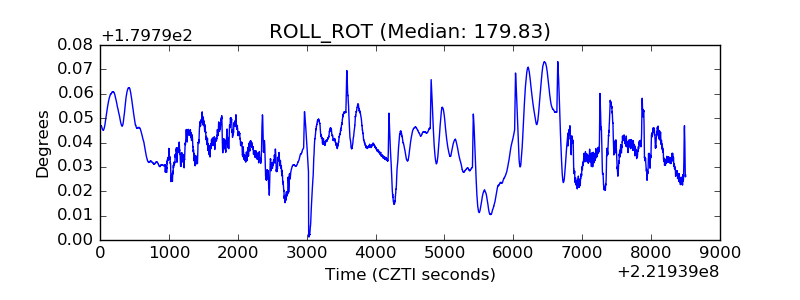 |
| _Roll_DEC | 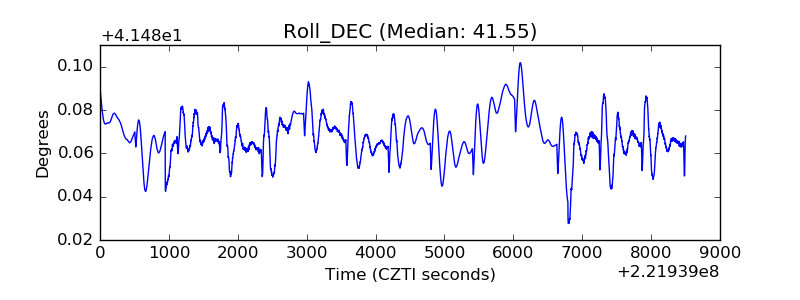 |
| _Roll_RA | 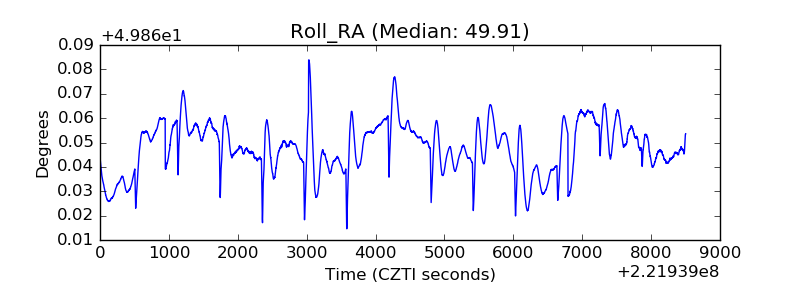 |
| Veto Counter | 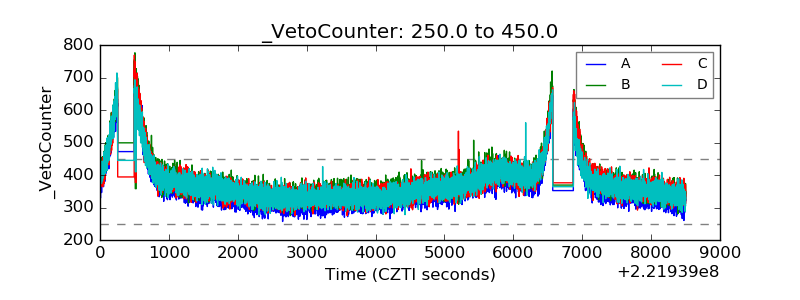 |