| Param | Original file | Final file |
|---|---|---|
| Filename | modeM0/AS1T01_151T01_9000000960_06999cztM0_level2.evt | modeM0/AS1T01_151T01_9000000960_06999cztM0_level2_quad_clean.evt |
| Size (bytes) | 506,900,160 | 104,120,640 |
| Size | 483.4 MB | 99.3 MB |
| Events in quadrant A | 3,561,369 | 655,807 |
| Events in quadrant B | 3,913,742 | 660,104 |
| Events in quadrant C | 3,470,893 | 649,330 |
| Events in quadrant D | 3,862,655 | 632,612 |
| Mode SS | |||
|---|---|---|---|
| Quadrant | BADHDUFLAG | Total packets | Discarded packets |
| A | 0 | 162 | 0 |
| B | 0 | 162 | 0 |
| C | 0 | 162 | 0 |
| D | 0 | 162 | 0 |
| Mode M9 | |||
|---|---|---|---|
| Quadrant | BADHDUFLAG | Total packets | Discarded packets |
| A | 0 | 5 | 0 |
| B | 0 | 5 | 0 |
| C | 0 | 5 | 0 |
| D | 0 | 6 | 0 |
| Mode M0 | |||
|---|---|---|---|
| Quadrant | BADHDUFLAG | Total packets | Discarded packets |
| A | 0 | 16355 | 3 |
| B | 0 | 17163 | 2 |
| C | 0 | 16185 | 2 |
| D | 0 | 16898 | 2 |
| Quadrant | Total seconds | Saturated seconds | Saturation percentage |
|---|---|---|---|
| A | 7990 | 28 | 0.350438% |
| B | 7990 | 47 | 0.588235% |
| C | 7990 | 10 | 0.125156% |
| D | 7990 | 38 | 0.475594% |
Noise dominated data is calculated using 1-second bins in cleaned event files. If a bin has >2000 counts, and if more than 50% of those come from <1% of pixels, then it is considered to be noise-dominated and hence unusable.
| Quadrant | # 1 sec bins | Bins with >0 counts | Bins with >2000 counts | High rate bins dominated by noise | Noise dominated (total time) | Noise dominated (detector-on time) | Marked lightcurve |
|---|---|---|---|---|---|---|---|
| A | 8475 | 7991 | 5 | 5 | 0.06% | 0.06% | 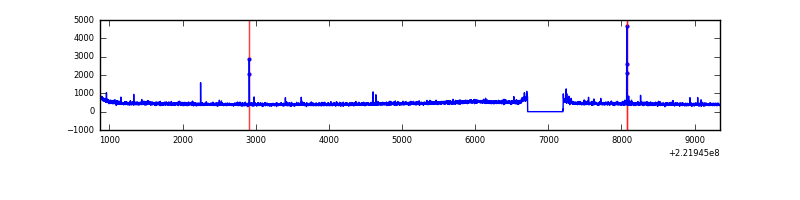 |
| B | 8475 | 7991 | 13 | 13 | 0.15% | 0.16% | 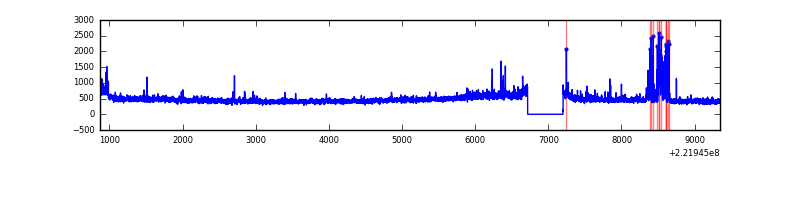 |
| C | 8475 | 7991 | 0 | 0 | 0.00% | 0.00% | 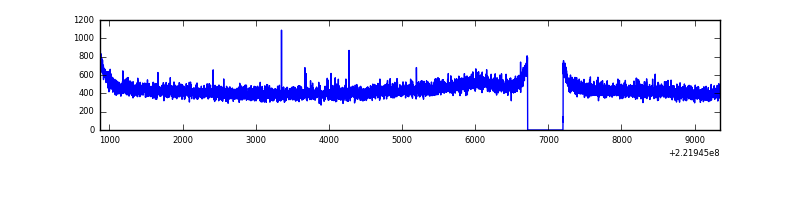 |
| D | 8475 | 7991 | 34 | 34 | 0.40% | 0.43% | 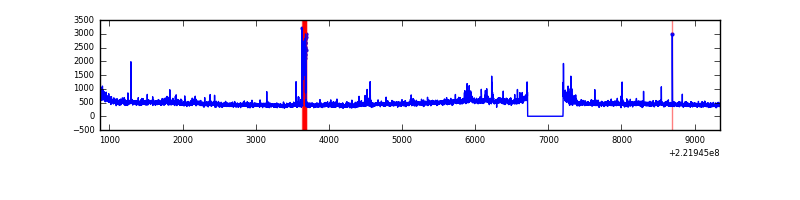 |
Top three noisy pixels from each quadrant. If the there are fewer than three noisy pixels in the level2.evt file, extra rows are filled as -1
| Pixel properties | Quadrant properties | ||||||
|---|---|---|---|---|---|---|---|
| Quadrant | DetID | PixID | Counts | Sigma | Mean | Median | Sigma |
| A | 15 | 234 | 24450 | 126.6 | 909 | 887 | 186.1 |
| A | 15 | 239 | 20523 | 105.5 | 909 | 887 | 186.1 |
| A | 0 | 226 | 8875 | 42.92 | 909 | 887 | 186.1 |
| B | 0 | 228 | 186476 | 1062.18 | 915 | 893 | 174.7 |
| B | 0 | 214 | 93137 | 527.96 | 915 | 893 | 174.7 |
| B | 15 | 204 | 29371 | 162.99 | 915 | 893 | 174.7 |
| C | 13 | 61 | 6861 | 28.94 | 887 | 891 | 206.3 |
| C | 1 | 16 | 4869 | 19.28 | 887 | 891 | 206.3 |
| C | 10 | 22 | 4631 | 18.13 | 887 | 891 | 206.3 |
| D | 8 | 195 | 248246 | 1137.08 | 889 | 859 | 217.6 |
| D | 14 | 34 | 118416 | 540.33 | 889 | 859 | 217.6 |
| D | 13 | 169 | 59467 | 269.38 | 889 | 859 | 217.6 |
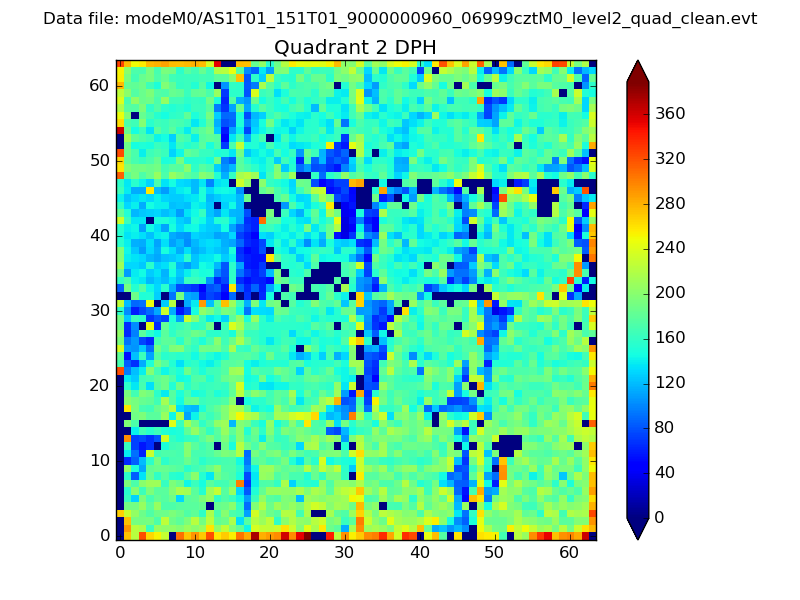
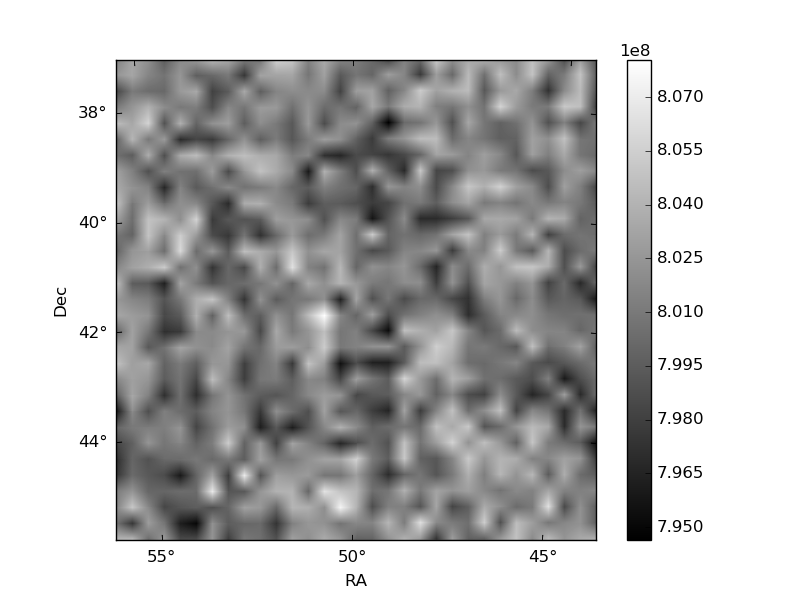
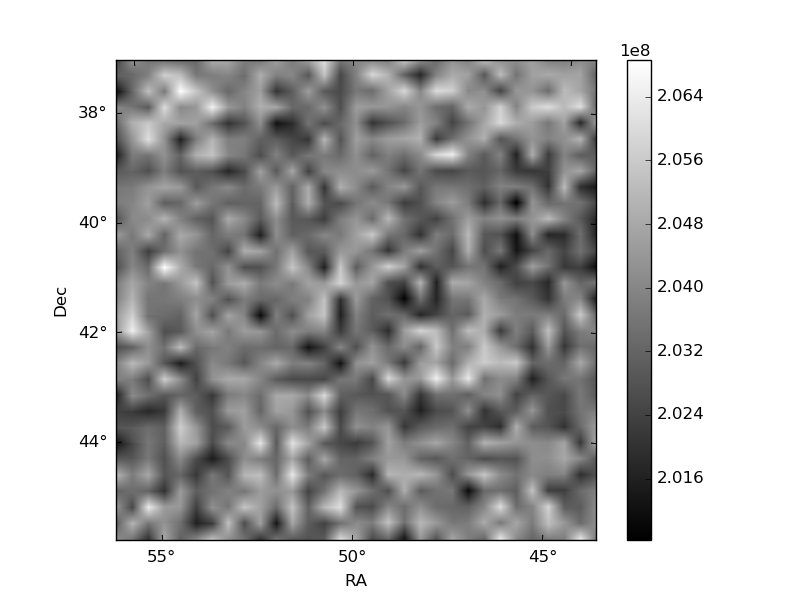
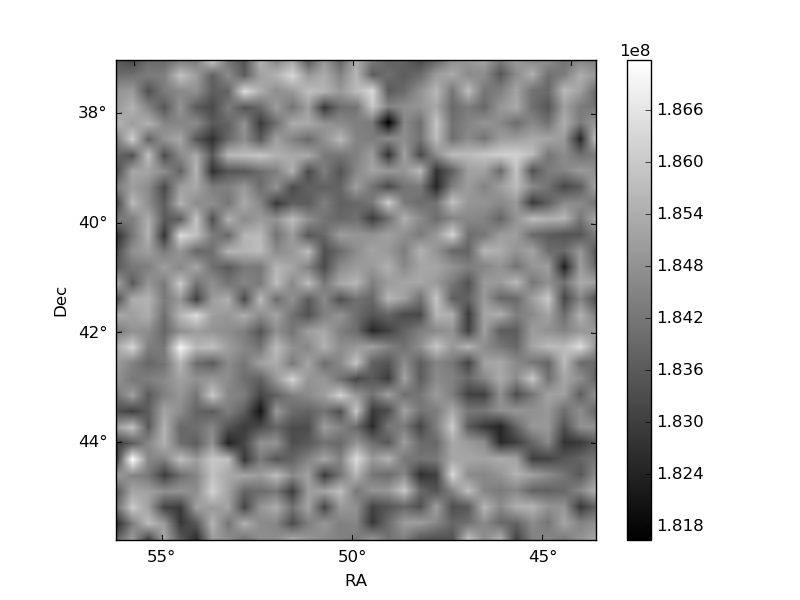
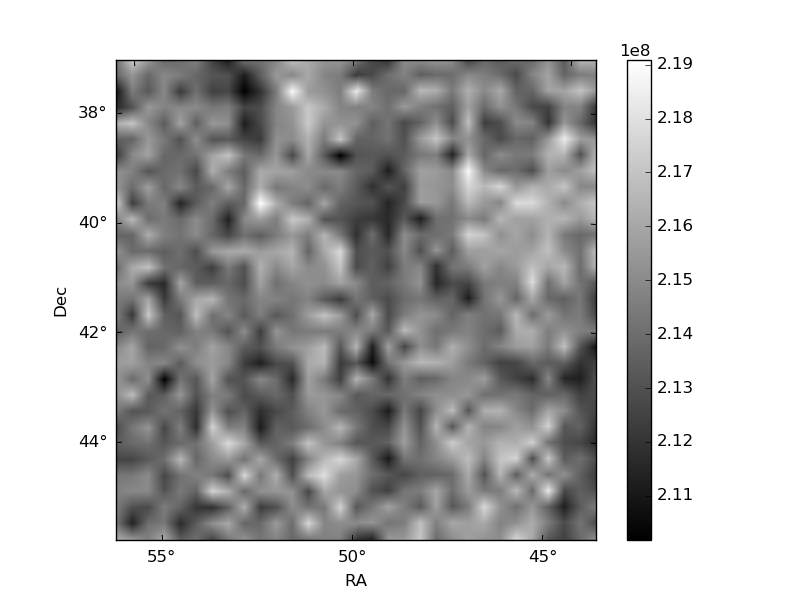
Histogram calculated using DETX and DETY for each event in the final _common_clean file
| Quadrant A | 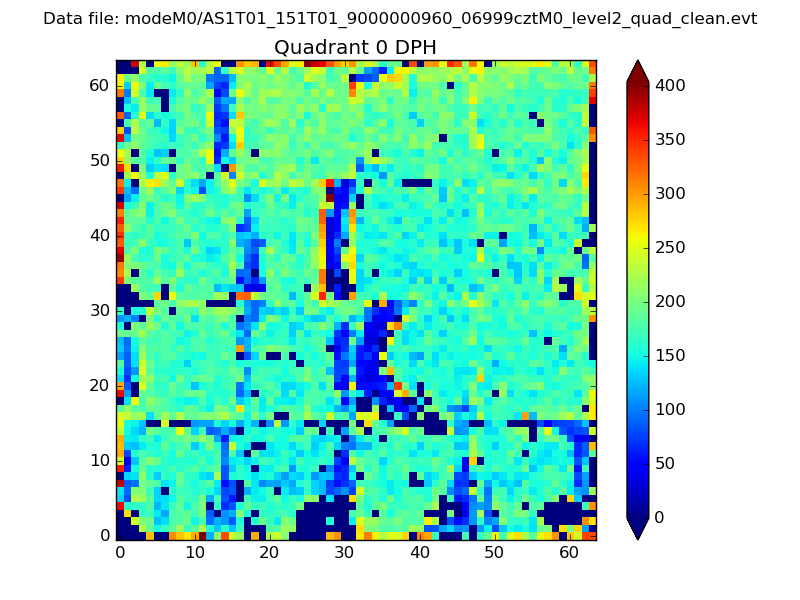 |
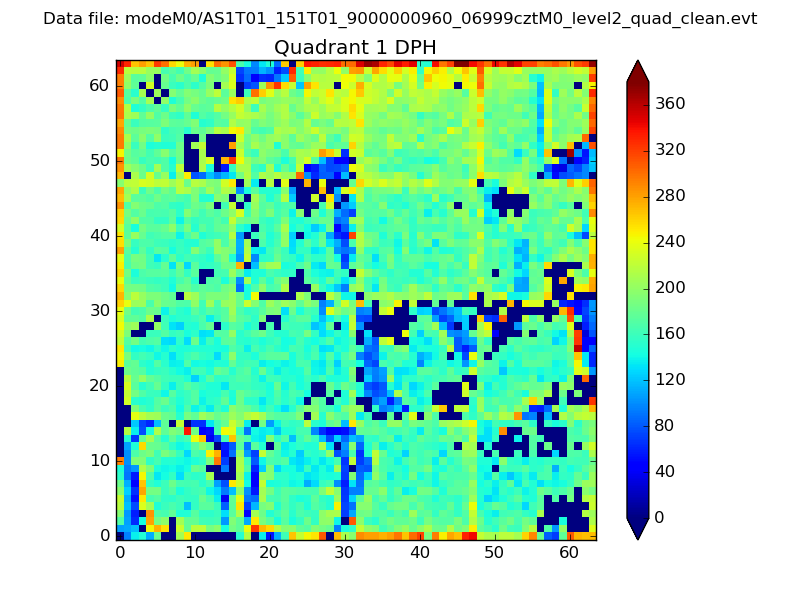 |
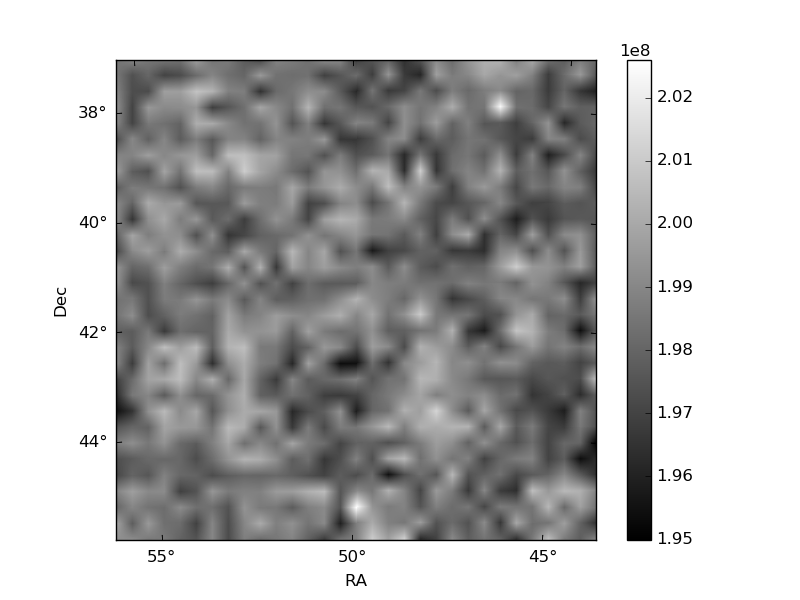
Quadrant B |
|---|---|---|---|
| Quadrant D | 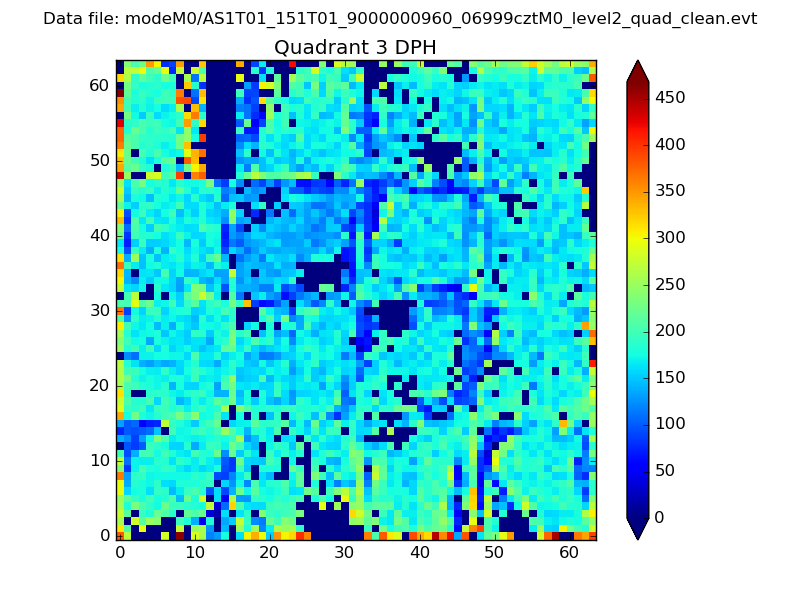 |
 |
Quadrant C |
| Plot type | Count rate plots | Images |
|---|---|---|
| Comparison with Poisson distribution Blue bars denote a histogram of data divided into 1 sec bins. Red curve is a Poisson curve with rate = median count rate of data. |
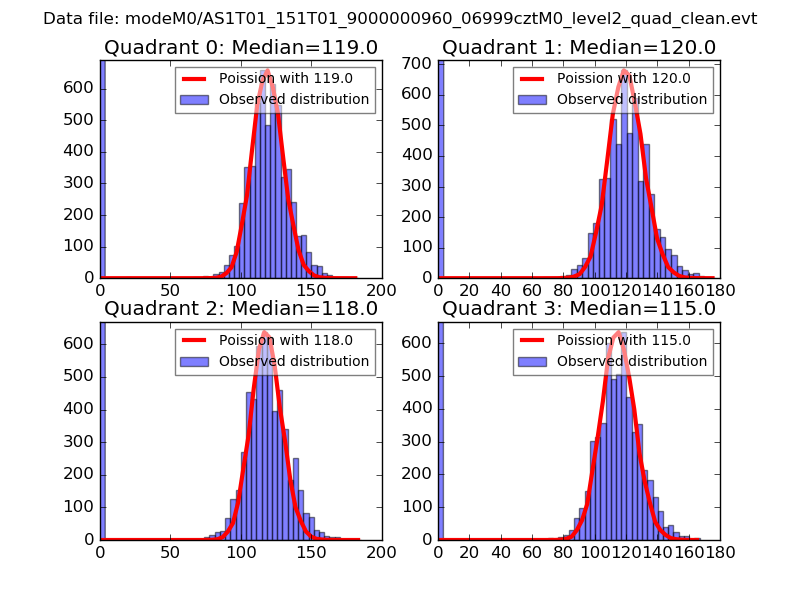 |
 |
| Quadrant-wise count rates Data is divided into 100 sec bins |
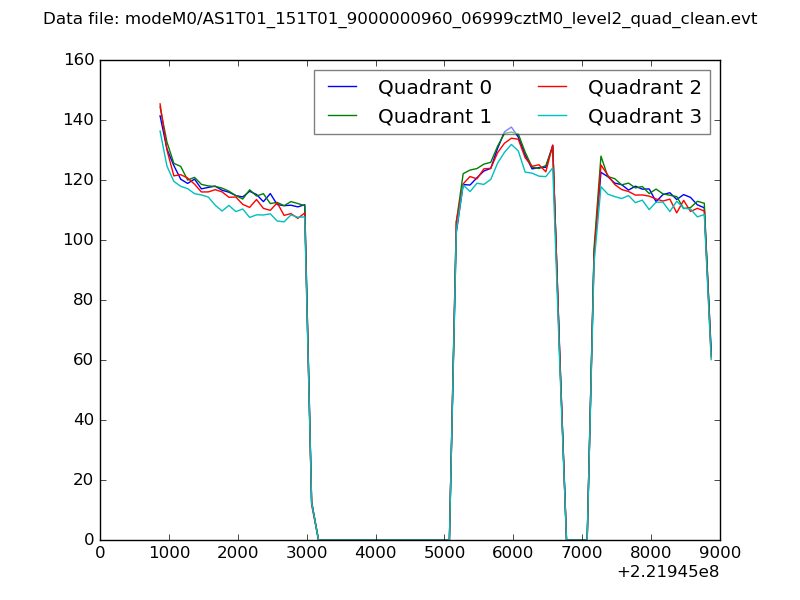 |
|
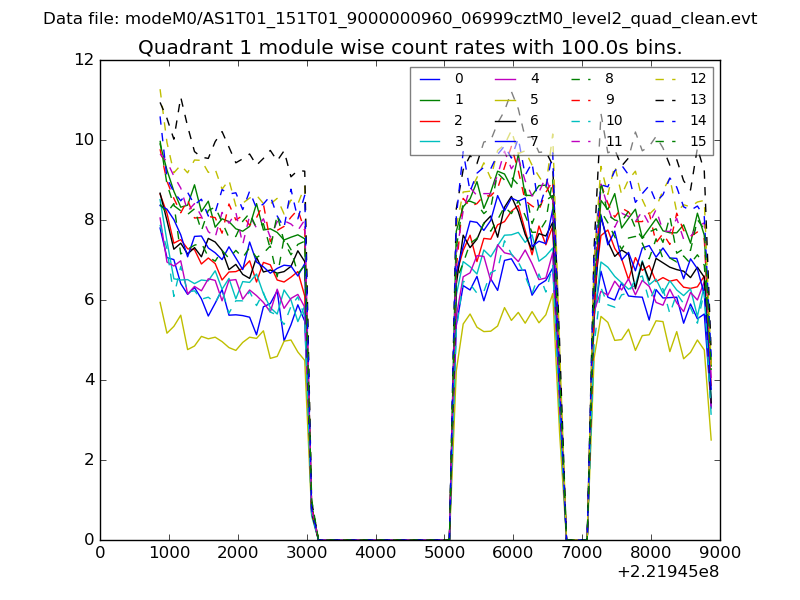
| Module-wise count rates for Quadrant A Data is divided into 100 sec bins |
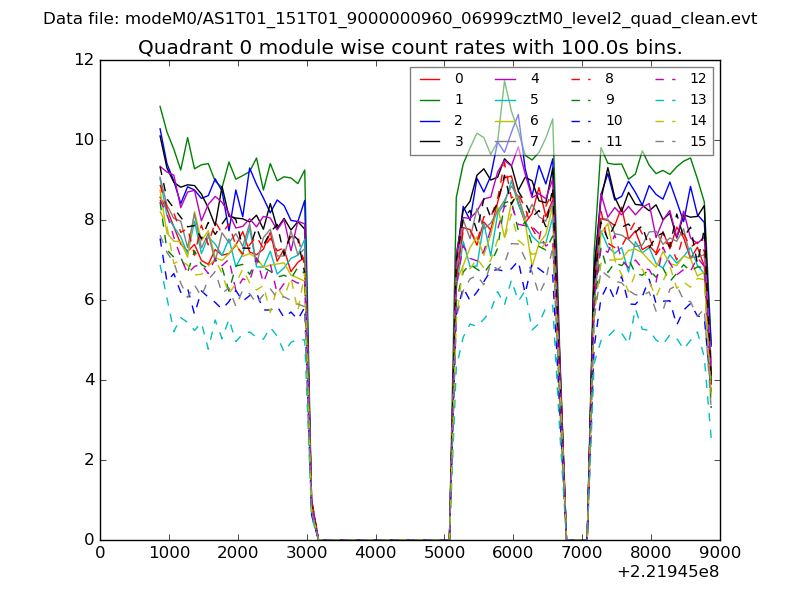 |
 |
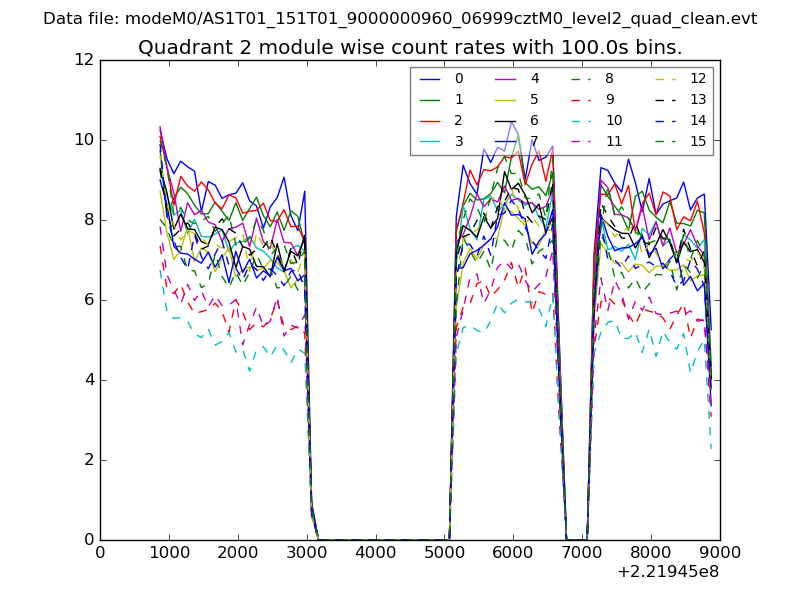
| Module-wise count rates for Quadrant B Data is divided into 100 sec bins |
 |
 |
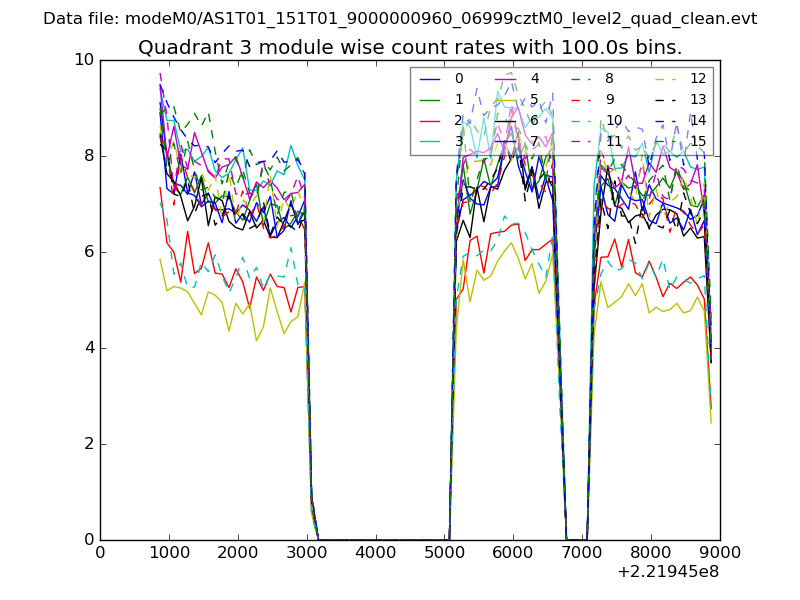
| Module-wise count rates for Quadrant C Data is divided into 100 sec bins |
 |
 |
| Module-wise count rates for Quadrant D Data is divided into 100 sec bins |
 |
 |
| Parameter | Plot |
|---|---|
| CZT HV Monitor | 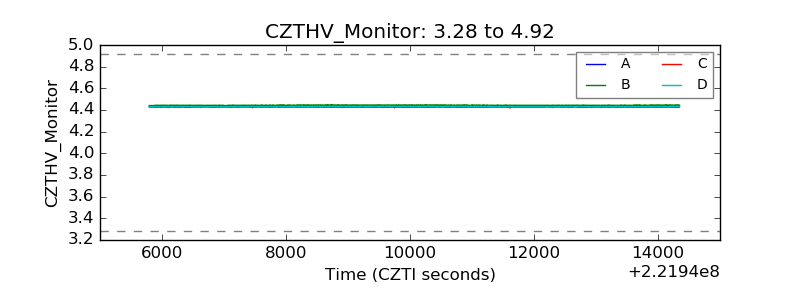 |
| D_VDD | 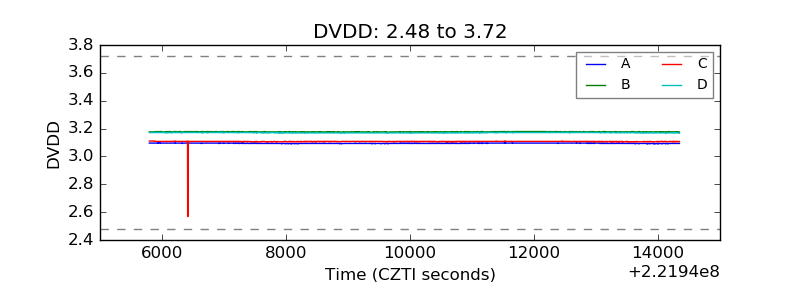 |
| Temperature 1 | 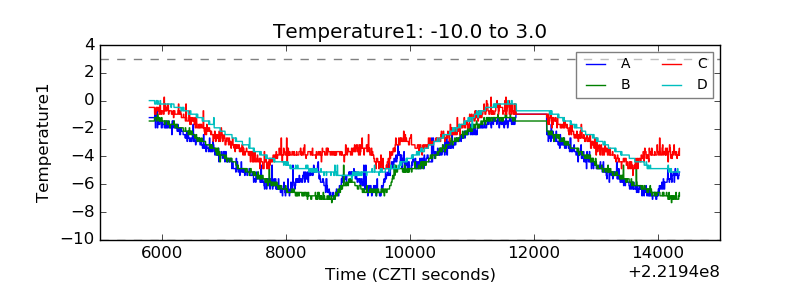 |
| Veto HV Monitor | 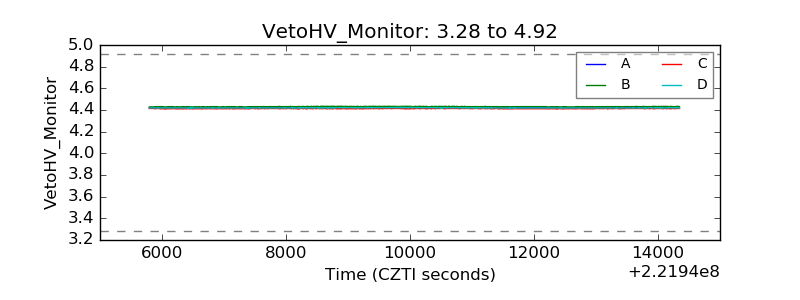 |
| Veto LLD | 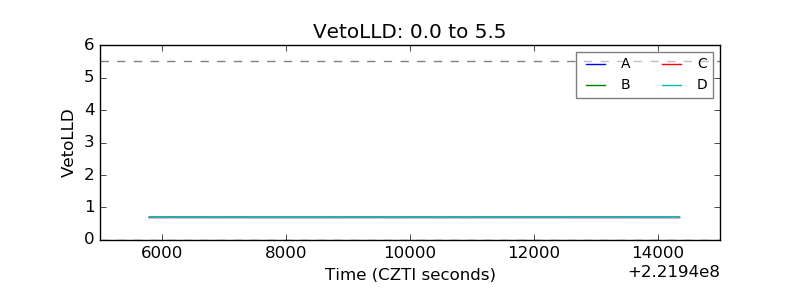 |
| Alpha Counter | 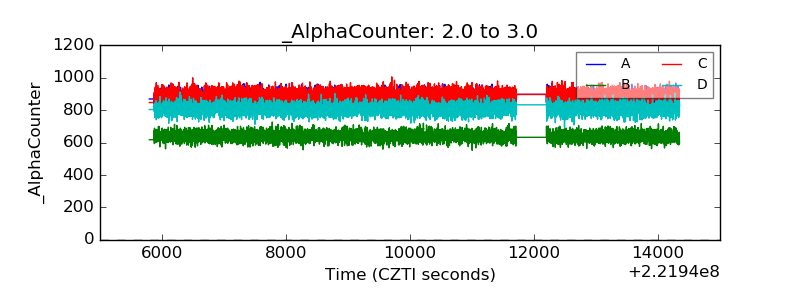 |
| _CPM_Rate | 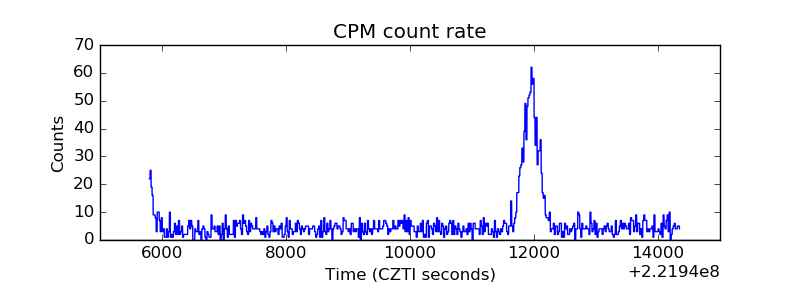 |
| CZT Counter | 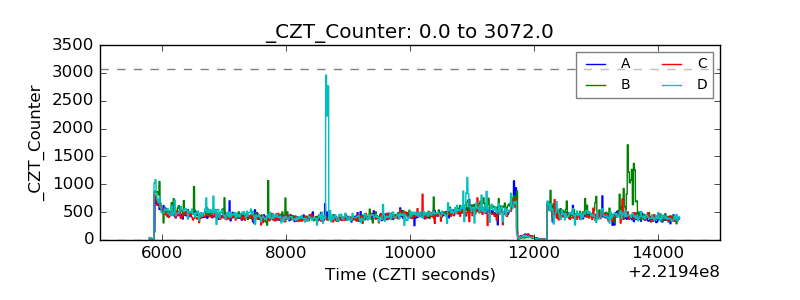 |
| +2.5 Volts monitor | 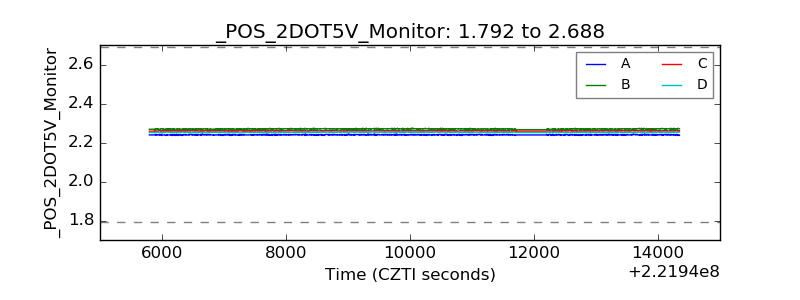 |
| +5 Volts monitor | 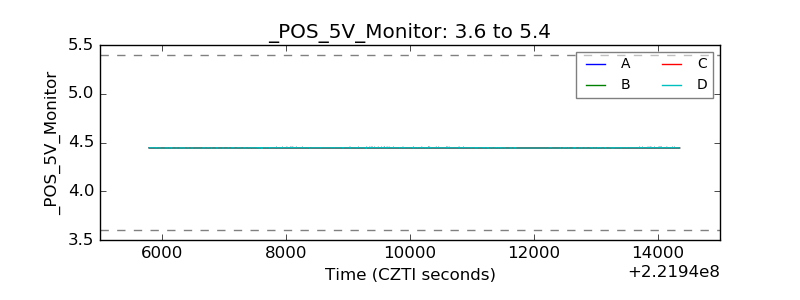 |
| _ROLL_ROT | 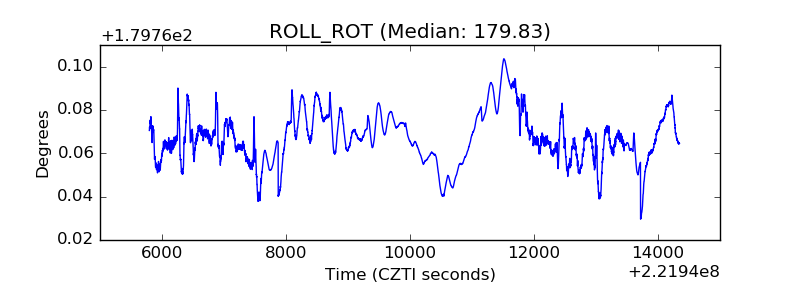 |
| _Roll_DEC | 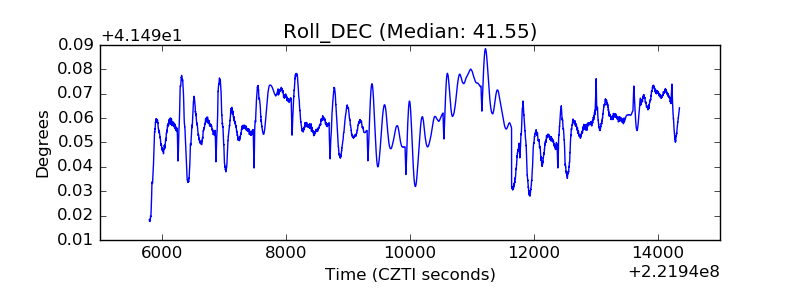 |
| _Roll_RA | 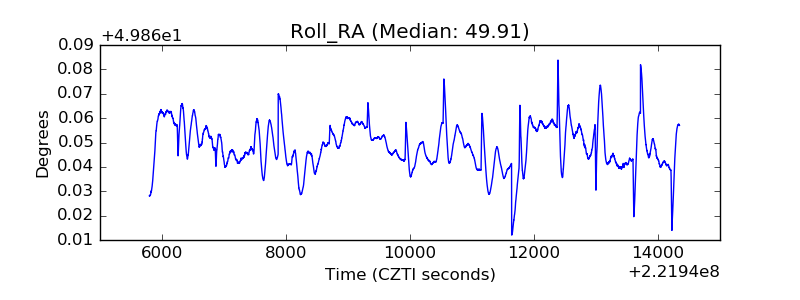 |
| Veto Counter | 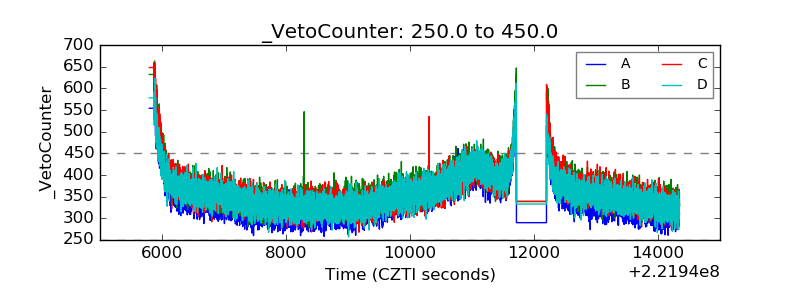 |