| Param | Original file | Final file |
|---|---|---|
| Filename | modeM0/AS1T01_151T01_9000000960_07000cztM0_level2.evt | modeM0/AS1T01_151T01_9000000960_07000cztM0_level2_quad_clean.evt |
| Size (bytes) | 1,046,494,080 | 185,711,040 |
| Size | 998.0 MB | 177.1 MB |
| Events in quadrant A | 7,403,560 | 1,135,082 |
| Events in quadrant B | 7,871,758 | 1,143,168 |
| Events in quadrant C | 7,277,651 | 1,120,924 |
| Events in quadrant D | 8,016,524 | 1,080,969 |
| Mode SS | |||
|---|---|---|---|
| Quadrant | BADHDUFLAG | Total packets | Discarded packets |
| A | 0 | 334 | 0 |
| B | 0 | 334 | 0 |
| C | 0 | 334 | 0 |
| D | 0 | 334 | 0 |
| Mode M9 | |||
|---|---|---|---|
| Quadrant | BADHDUFLAG | Total packets | Discarded packets |
| A | 0 | 25 | 0 |
| B | 0 | 25 | 0 |
| C | 0 | 25 | 0 |
| D | 0 | 25 | 0 |
| Mode M0 | |||
|---|---|---|---|
| Quadrant | BADHDUFLAG | Total packets | Discarded packets |
| A | 0 | 33711 | 4 |
| B | 0 | 34975 | 3 |
| C | 0 | 33539 | 3 |
| D | 0 | 35319 | 3 |
| Quadrant | Total seconds | Saturated seconds | Saturation percentage |
|---|---|---|---|
| A | 16605 | 75 | 0.451671% |
| B | 16605 | 94 | 0.566095% |
| C | 16605 | 40 | 0.240891% |
| D | 16605 | 145 | 0.873231% |
Noise dominated data is calculated using 1-second bins in cleaned event files. If a bin has >2000 counts, and if more than 50% of those come from <1% of pixels, then it is considered to be noise-dominated and hence unusable.
| Quadrant | # 1 sec bins | Bins with >0 counts | Bins with >2000 counts | High rate bins dominated by noise | Noise dominated (total time) | Noise dominated (detector-on time) | Marked lightcurve |
|---|---|---|---|---|---|---|---|
| A | 18960 | 16608 | 2 | 2 | 0.01% | 0.01% | 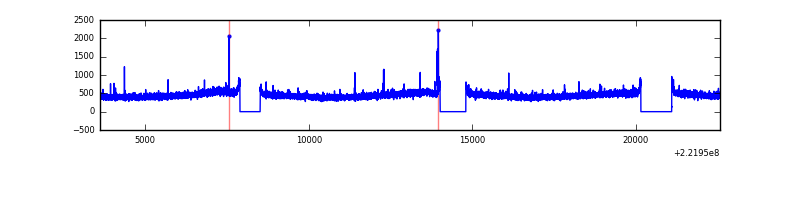 |
| B | 18960 | 16608 | 5 | 5 | 0.03% | 0.03% |  |
| C | 18960 | 16608 | 0 | 0 | 0.00% | 0.00% | 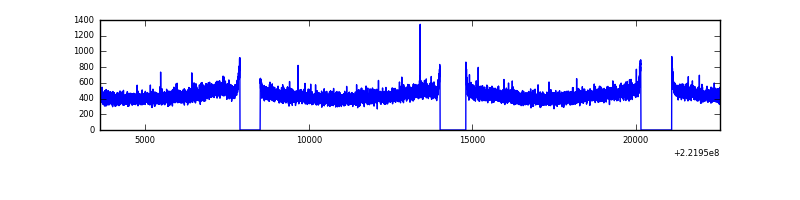 |
| D | 18960 | 16608 | 94 | 94 | 0.50% | 0.57% | 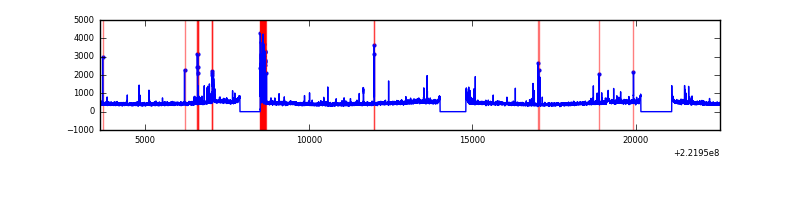 |
Top three noisy pixels from each quadrant. If the there are fewer than three noisy pixels in the level2.evt file, extra rows are filled as -1
| Pixel properties | Quadrant properties | ||||||
|---|---|---|---|---|---|---|---|
| Quadrant | DetID | PixID | Counts | Sigma | Mean | Median | Sigma |
| A | 15 | 234 | 36164 | 88.08 | 1912 | 1867 | 389.4 |
| A | 0 | 226 | 18016 | 41.47 | 1912 | 1867 | 389.4 |
| A | 12 | 194 | 17297 | 39.63 | 1912 | 1867 | 389.4 |
| B | 0 | 214 | 187957 | 507.9 | 1927 | 1878 | 366.4 |
| B | 4 | 173 | 50173 | 131.82 | 1927 | 1878 | 366.4 |
| B | 0 | 228 | 47111 | 123.46 | 1927 | 1878 | 366.4 |
| C | 13 | 61 | 14747 | 29.94 | 1862 | 1872 | 430.0 |
| C | 1 | 16 | 8805 | 16.12 | 1862 | 1872 | 430.0 |
| C | 10 | 22 | 5352 | 8.09 | 1862 | 1872 | 430.0 |
| D | 8 | 195 | 490865 | 1081.82 | 1853 | 1796 | 452.1 |
| D | 13 | 105 | 238536 | 523.67 | 1853 | 1796 | 452.1 |
| D | 2 | 14 | 110524 | 240.51 | 1853 | 1796 | 452.1 |
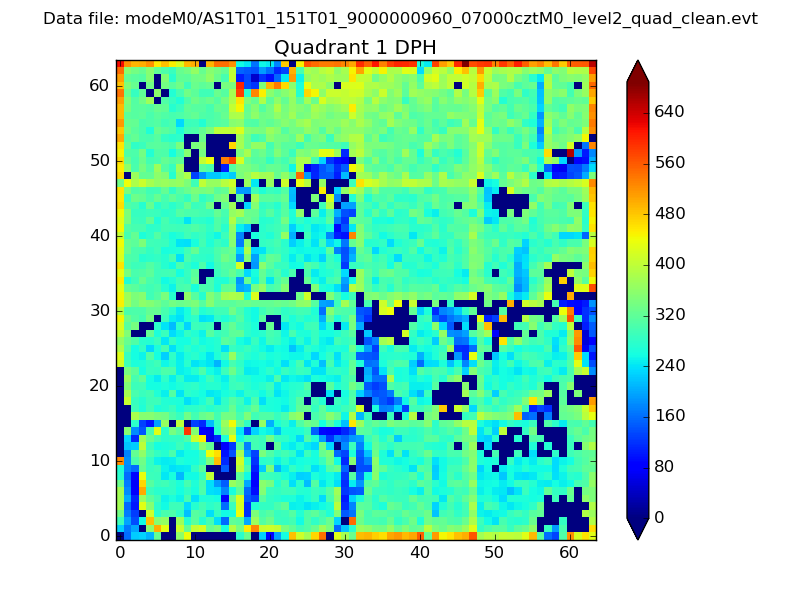
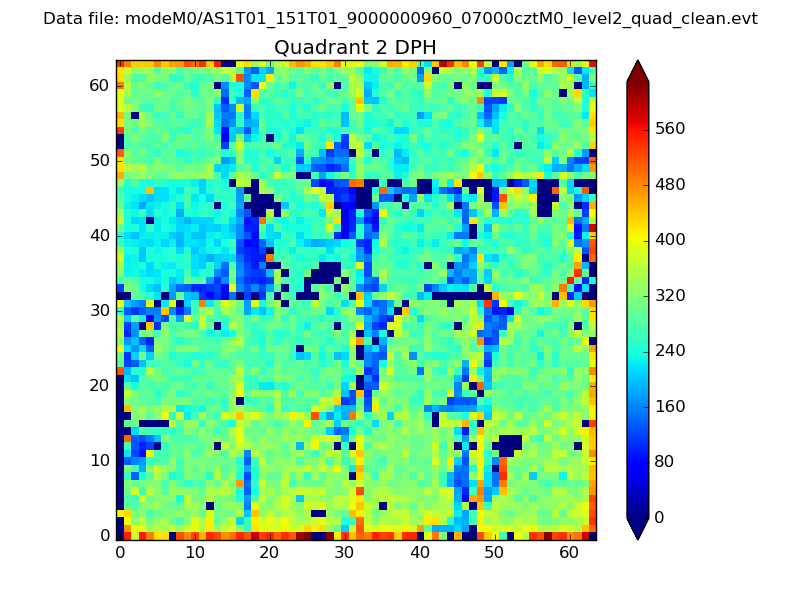
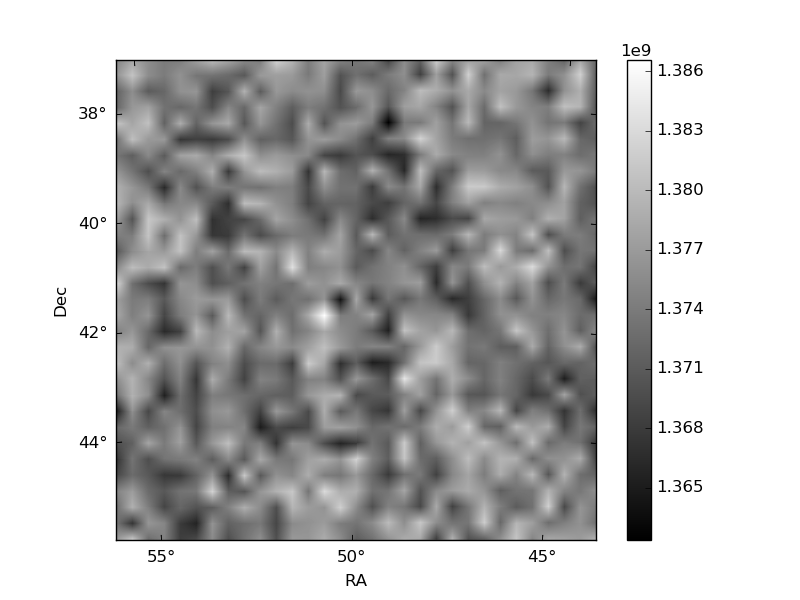
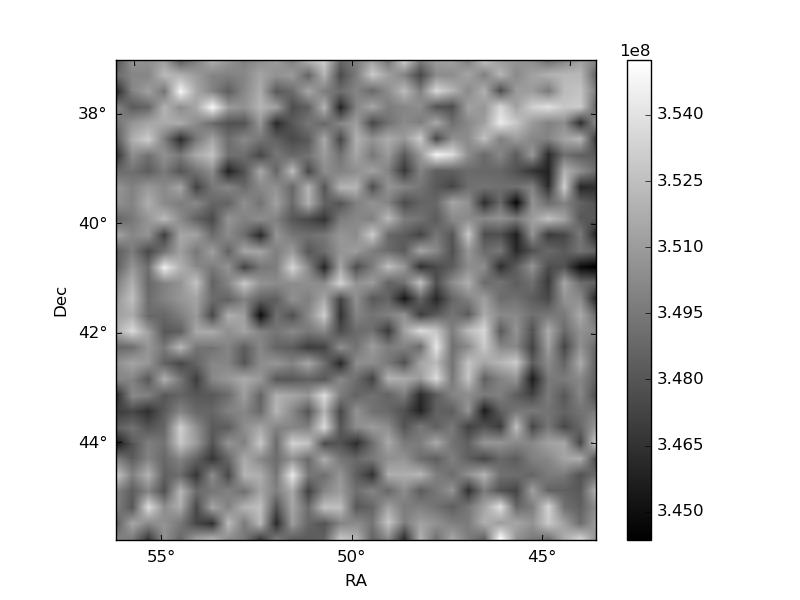
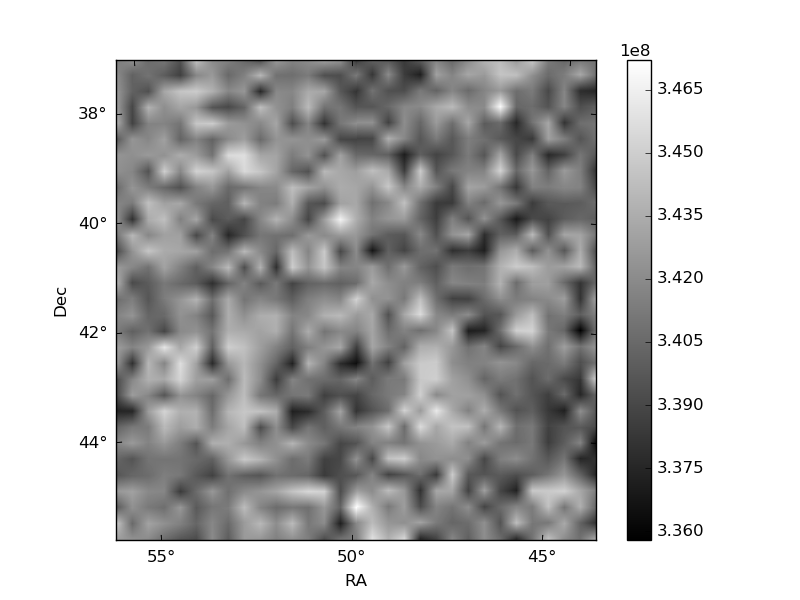
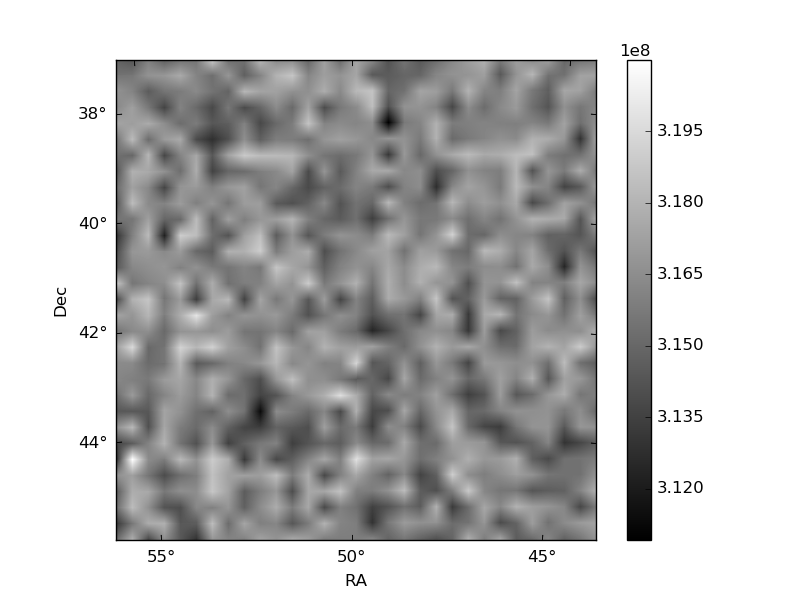
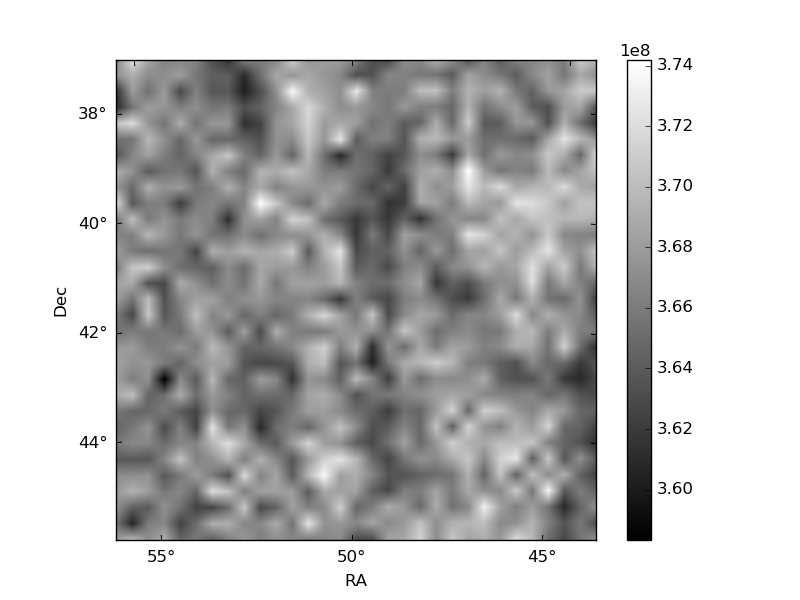
Histogram calculated using DETX and DETY for each event in the final _common_clean file
| Quadrant A | 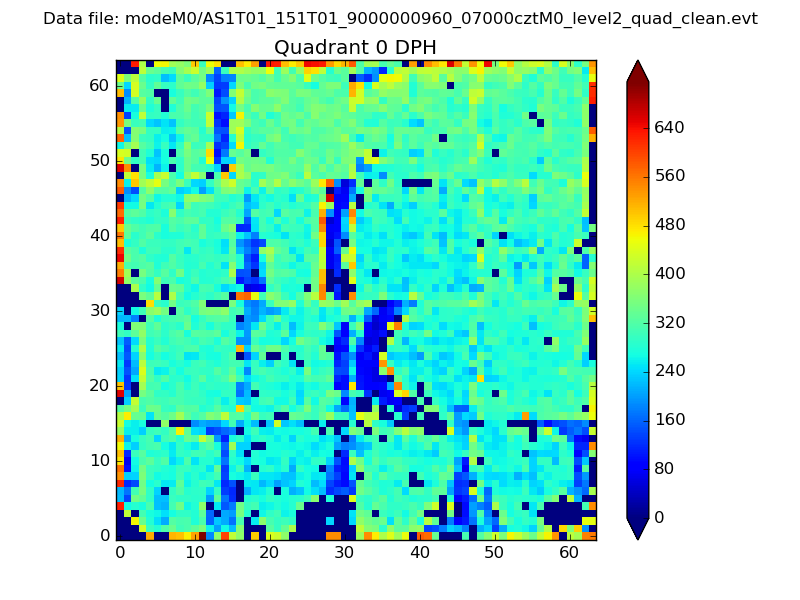 |
 |
Quadrant B |
|---|---|---|---|
| Quadrant D | 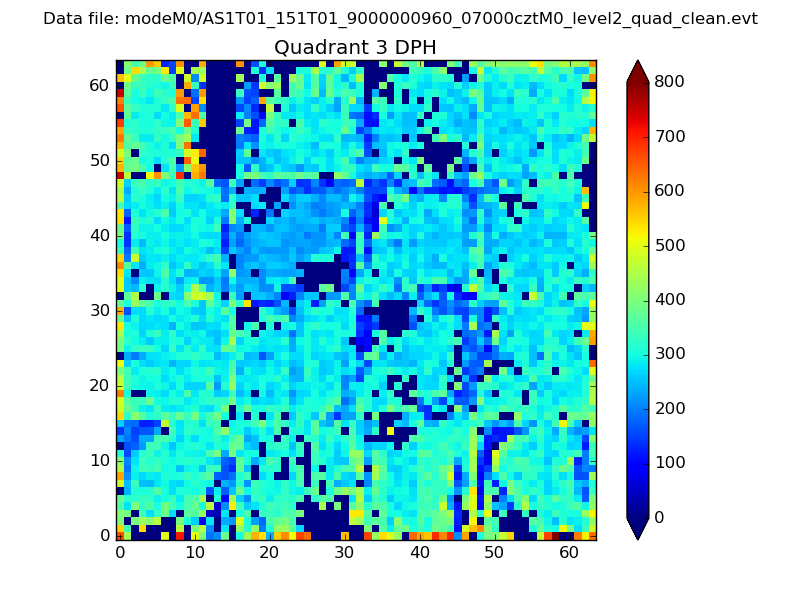 |
 |
Quadrant C |
| Plot type | Count rate plots | Images |
|---|---|---|
| Comparison with Poisson distribution Blue bars denote a histogram of data divided into 1 sec bins. Red curve is a Poisson curve with rate = median count rate of data. |
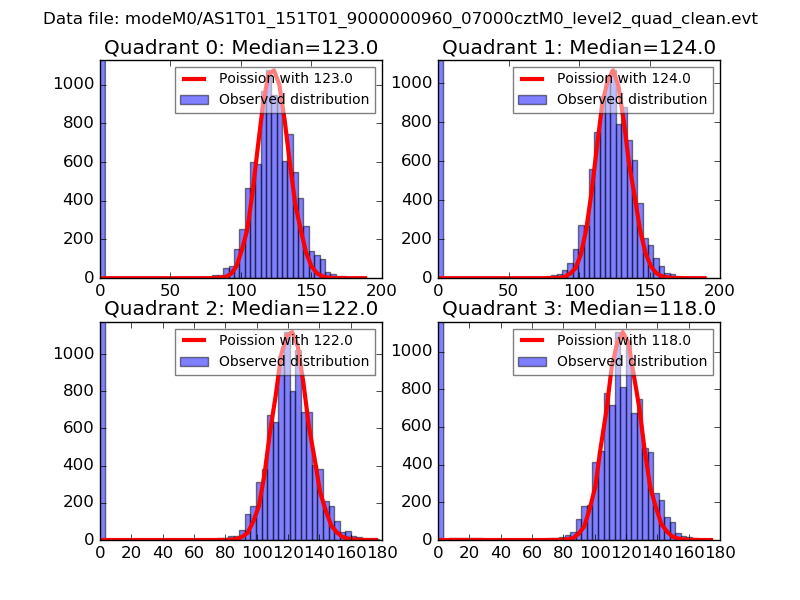 |
 |
| Quadrant-wise count rates Data is divided into 100 sec bins |
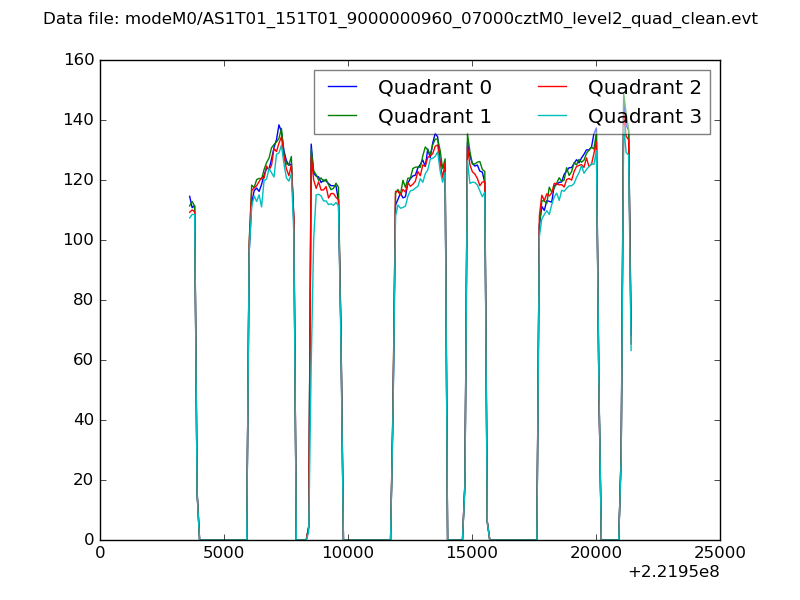 |
|
| Module-wise count rates for Quadrant A Data is divided into 100 sec bins |
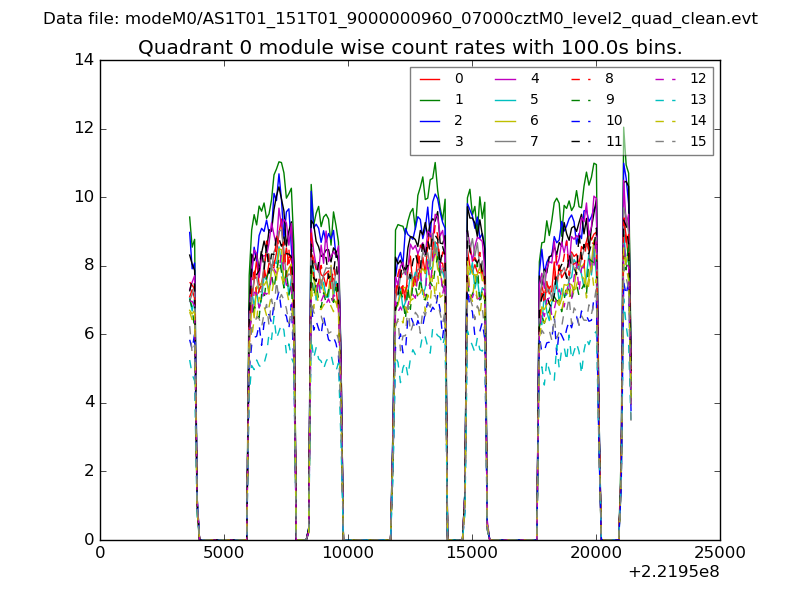 |
 |
| Module-wise count rates for Quadrant B Data is divided into 100 sec bins |
 |
 |
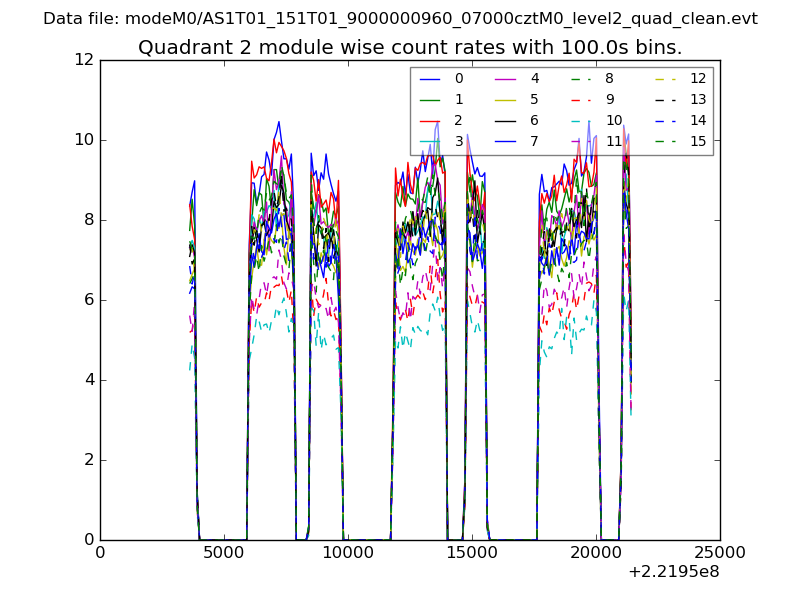
| Module-wise count rates for Quadrant C Data is divided into 100 sec bins |
 |
 |
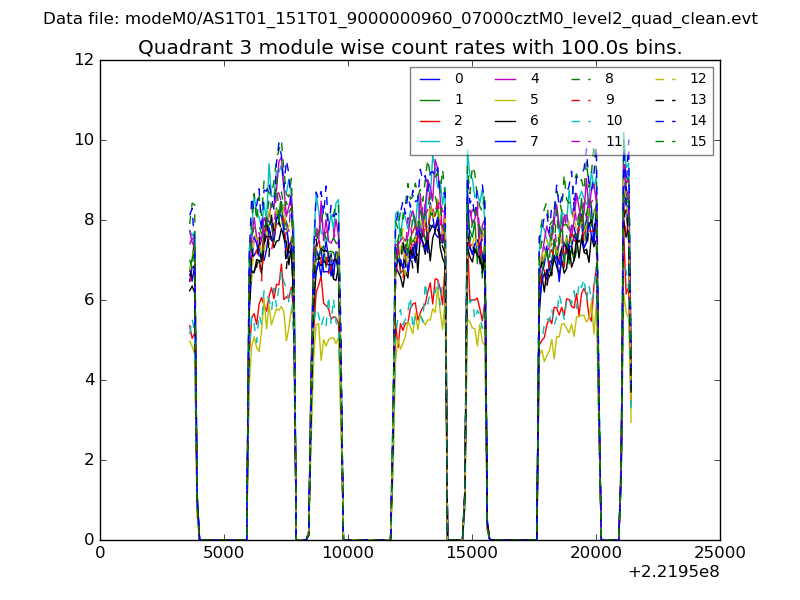
| Module-wise count rates for Quadrant D Data is divided into 100 sec bins |
 |
 |
| Parameter | Plot |
|---|---|
| CZT HV Monitor | 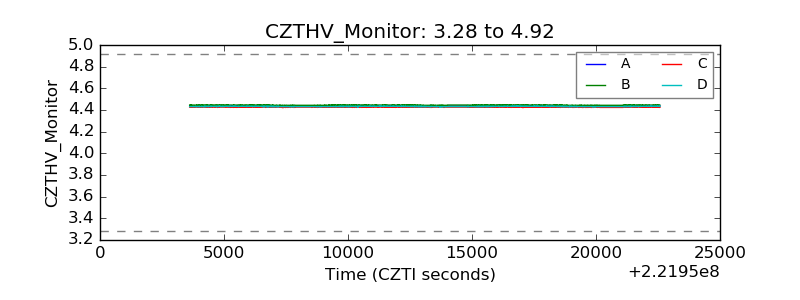 |
| D_VDD | 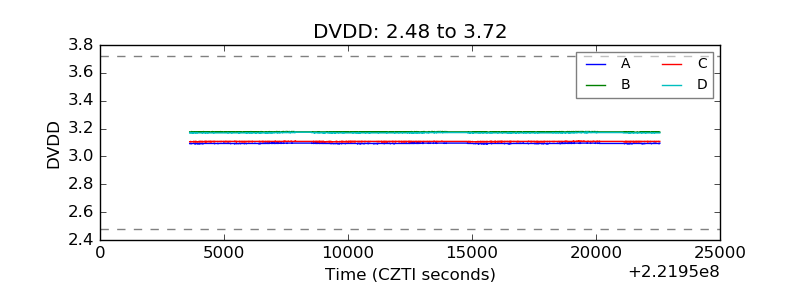 |
| Temperature 1 | 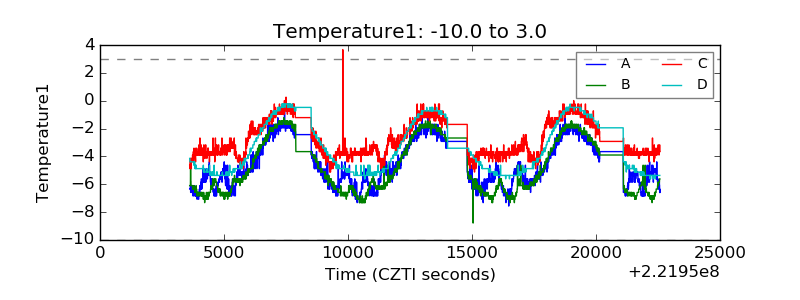 |
| Veto HV Monitor | 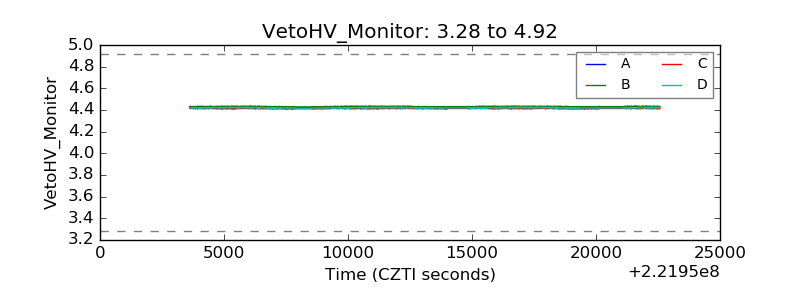 |
| Veto LLD | 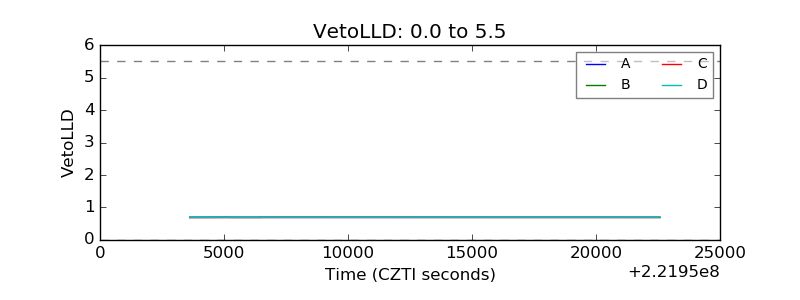 |
| Alpha Counter | 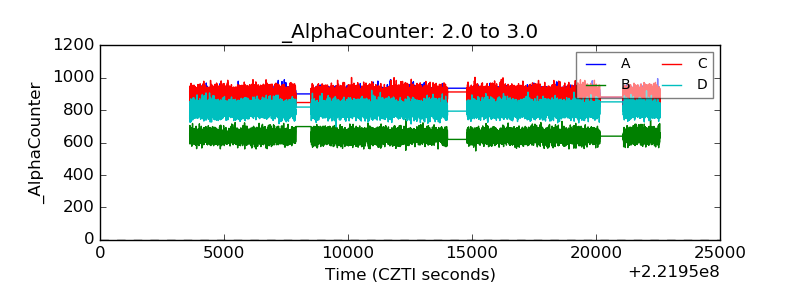 |
| _CPM_Rate | 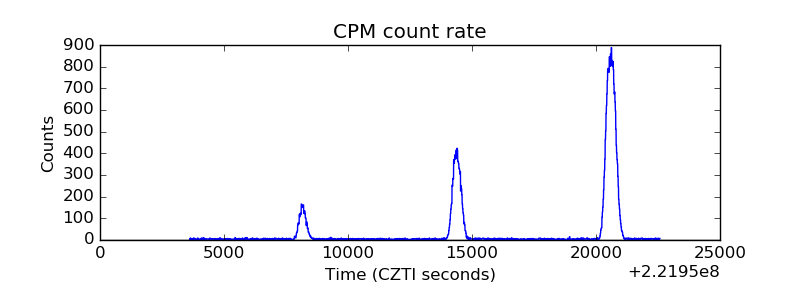 |
| CZT Counter | 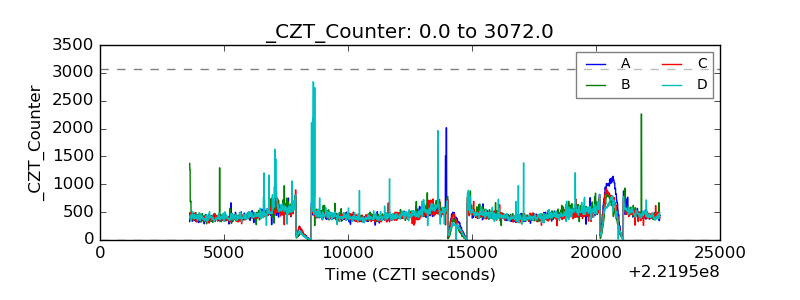 |
| +2.5 Volts monitor | 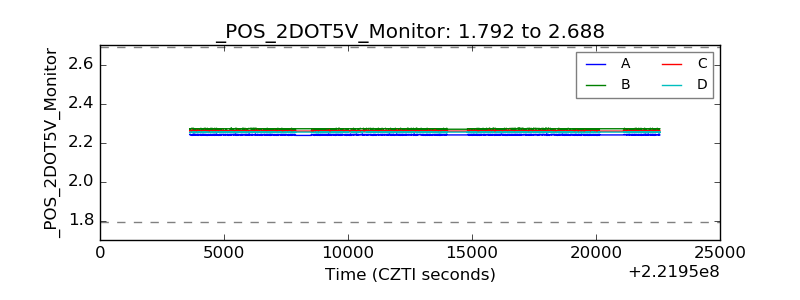 |
| +5 Volts monitor |  |
| _ROLL_ROT | 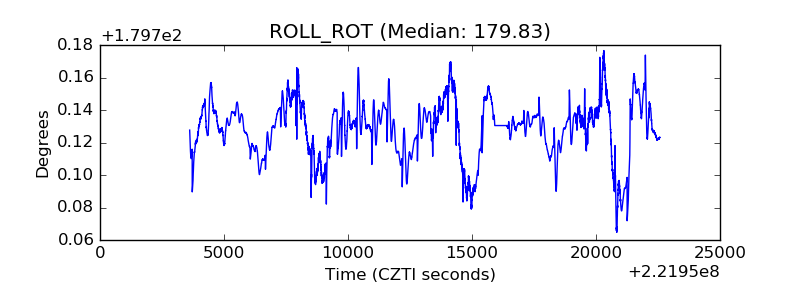 |
| _Roll_DEC | 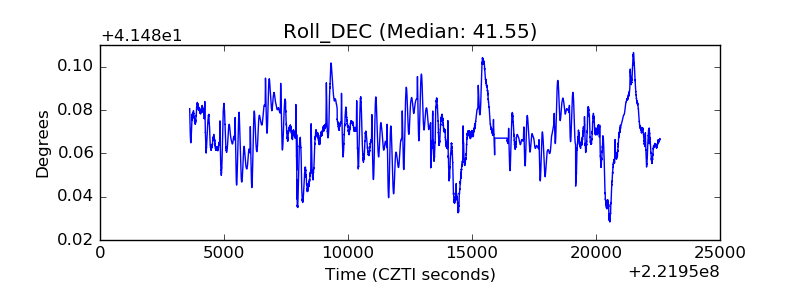 |
| _Roll_RA | 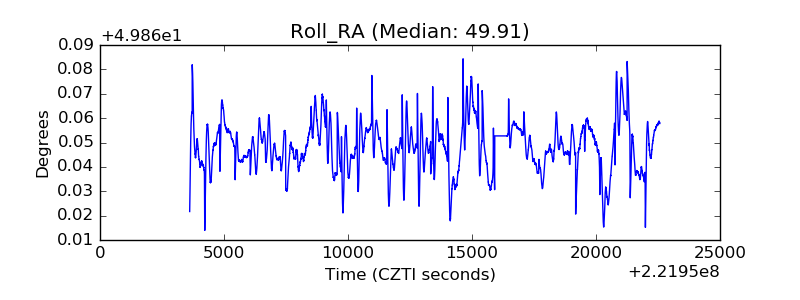 |
| Veto Counter | 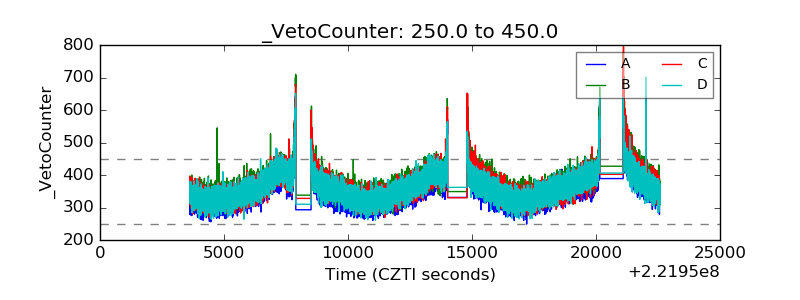 |