| Param | Original file | Final file |
|---|---|---|
| Filename | modeM0/AS1T01_151T01_9000000960_07004cztM0_level2.evt | modeM0/AS1T01_151T01_9000000960_07004cztM0_level2_quad_clean.evt |
| Size (bytes) | 438,102,720 | 74,747,520 |
| Size | 417.8 MB | 71.3 MB |
| Events in quadrant A | 3,182,329 | 462,243 |
| Events in quadrant B | 3,255,125 | 467,773 |
| Events in quadrant C | 3,053,700 | 452,991 |
| Events in quadrant D | 3,344,478 | 436,663 |
| Mode SS | |||
|---|---|---|---|
| Quadrant | BADHDUFLAG | Total packets | Discarded packets |
| A | 0 | 128 | 0 |
| B | 0 | 128 | 0 |
| C | 0 | 128 | 0 |
| D | 0 | 128 | 0 |
| Mode M9 | |||
|---|---|---|---|
| Quadrant | BADHDUFLAG | Total packets | Discarded packets |
| A | 0 | 21 | 0 |
| B | 0 | 21 | 0 |
| C | 0 | 21 | 0 |
| D | 0 | 22 | 0 |
| Mode M0 | |||
|---|---|---|---|
| Quadrant | BADHDUFLAG | Total packets | Discarded packets |
| A | 0 | 13377 | 3 |
| B | 0 | 13541 | 2 |
| C | 0 | 13171 | 2 |
| D | 0 | 13896 | 2 |
| Quadrant | Total seconds | Saturated seconds | Saturation percentage |
|---|---|---|---|
| A | 6362 | 72 | 1.131720% |
| B | 6362 | 78 | 1.226030% |
| C | 6362 | 51 | 0.801635% |
| D | 6362 | 86 | 1.351776% |
Noise dominated data is calculated using 1-second bins in cleaned event files. If a bin has >2000 counts, and if more than 50% of those come from <1% of pixels, then it is considered to be noise-dominated and hence unusable.
| Quadrant | # 1 sec bins | Bins with >0 counts | Bins with >2000 counts | High rate bins dominated by noise | Noise dominated (total time) | Noise dominated (detector-on time) | Marked lightcurve |
|---|---|---|---|---|---|---|---|
| A | 7632 | 6363 | 2 | 2 | 0.03% | 0.03% | 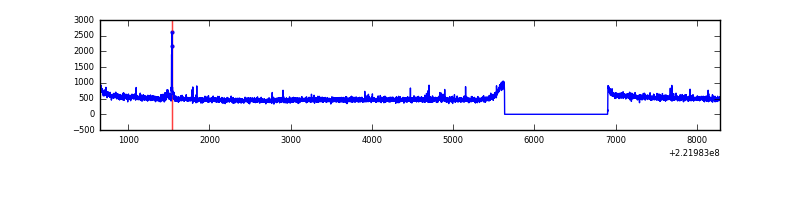 |
| B | 7632 | 6363 | 0 | 0 | 0.00% | 0.00% | 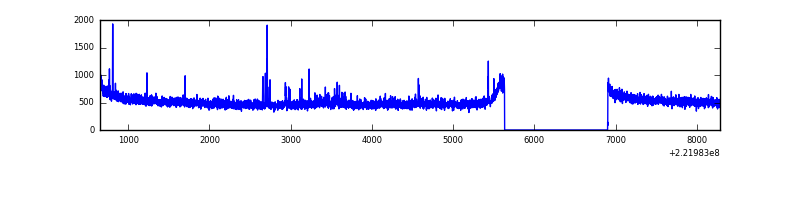 |
| C | 7632 | 6363 | 0 | 0 | 0.00% | 0.00% | 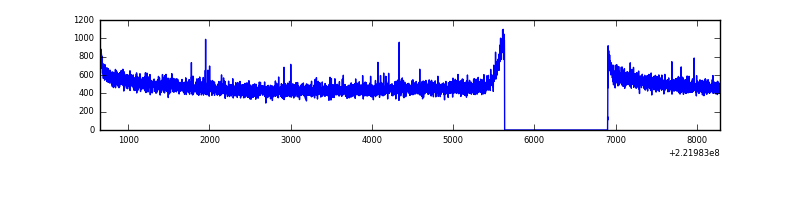 |
| D | 7632 | 6363 | 45 | 45 | 0.59% | 0.71% | 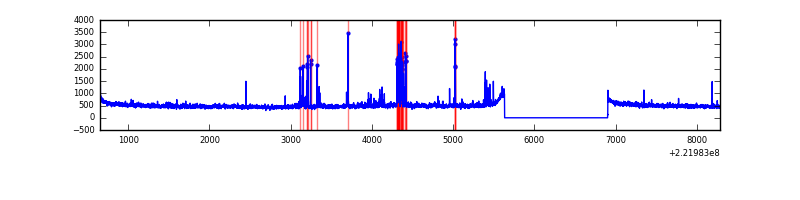 |
Top three noisy pixels from each quadrant. If the there are fewer than three noisy pixels in the level2.evt file, extra rows are filled as -1
| Pixel properties | Quadrant properties | ||||||
|---|---|---|---|---|---|---|---|
| Quadrant | DetID | PixID | Counts | Sigma | Mean | Median | Sigma |
| A | 15 | 234 | 25758 | 152.44 | 817 | 802 | 163.7 |
| A | 13 | 14 | 10297 | 58.0 | 817 | 802 | 163.7 |
| A | 0 | 226 | 8054 | 44.3 | 817 | 802 | 163.7 |
| B | 0 | 214 | 24606 | 153.98 | 821 | 804 | 154.6 |
| B | 4 | 239 | 22687 | 141.57 | 821 | 804 | 154.6 |
| B | 12 | 111 | 15521 | 95.21 | 821 | 804 | 154.6 |
| C | 13 | 61 | 6205 | 30.22 | 780 | 785 | 179.3 |
| C | 1 | 16 | 5827 | 28.11 | 780 | 785 | 179.3 |
| C | 14 | 128 | 2305 | 8.48 | 780 | 785 | 179.3 |
| D | 14 | 34 | 159115 | 830.14 | 784 | 760 | 190.8 |
| D | 8 | 195 | 158641 | 827.66 | 784 | 760 | 190.8 |
| D | 2 | 14 | 30791 | 157.43 | 784 | 760 | 190.8 |
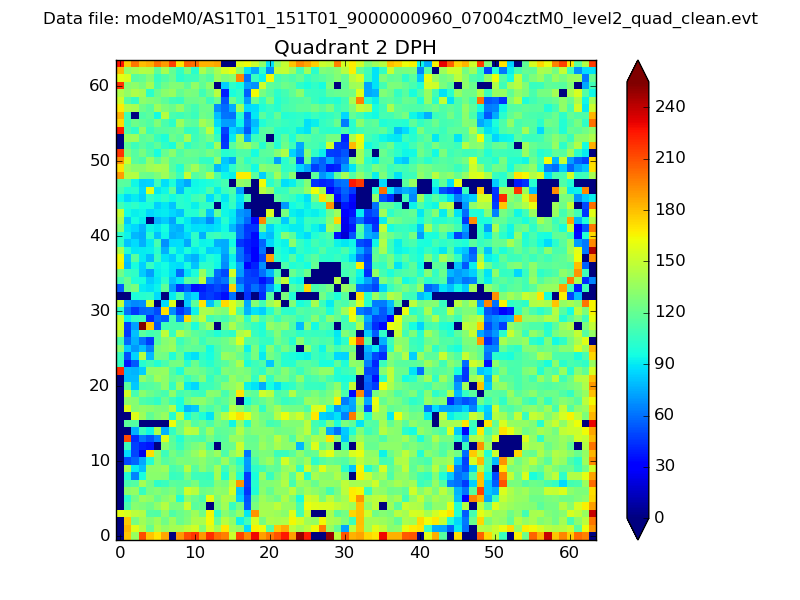
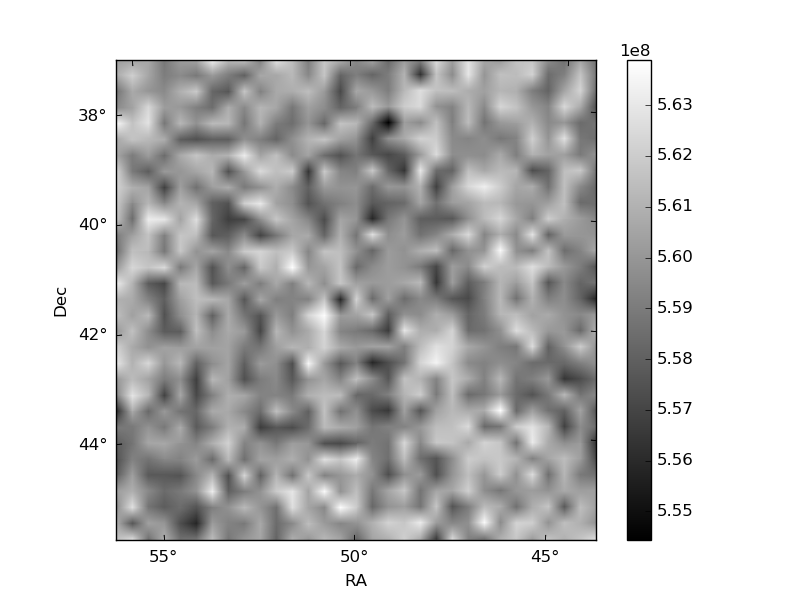
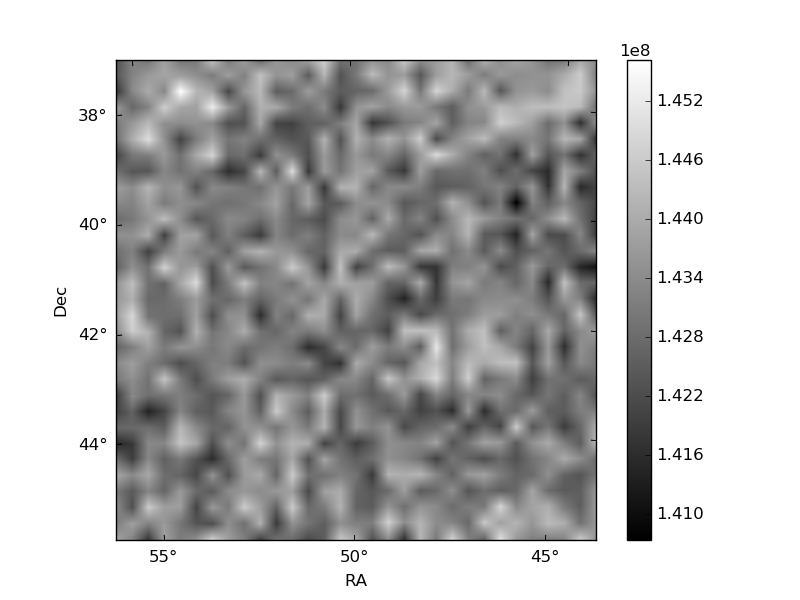
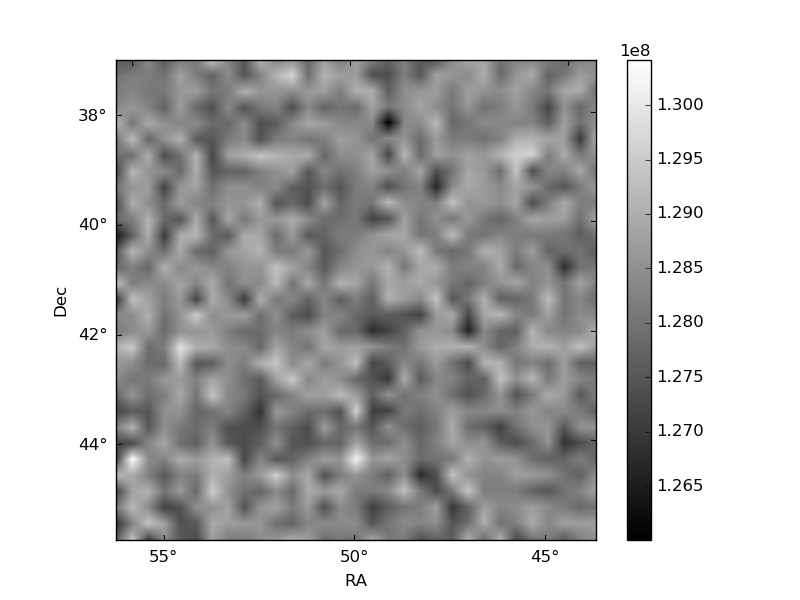
Histogram calculated using DETX and DETY for each event in the final _common_clean file
| Quadrant A | 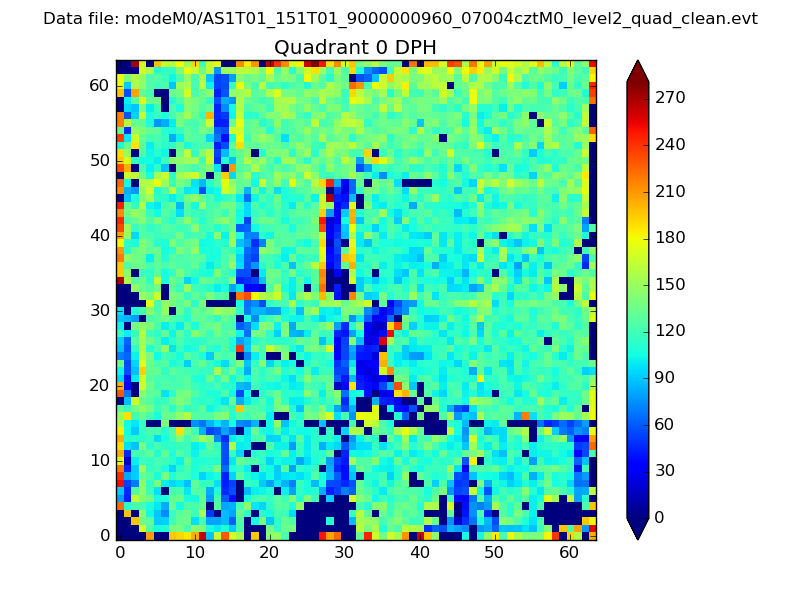 |
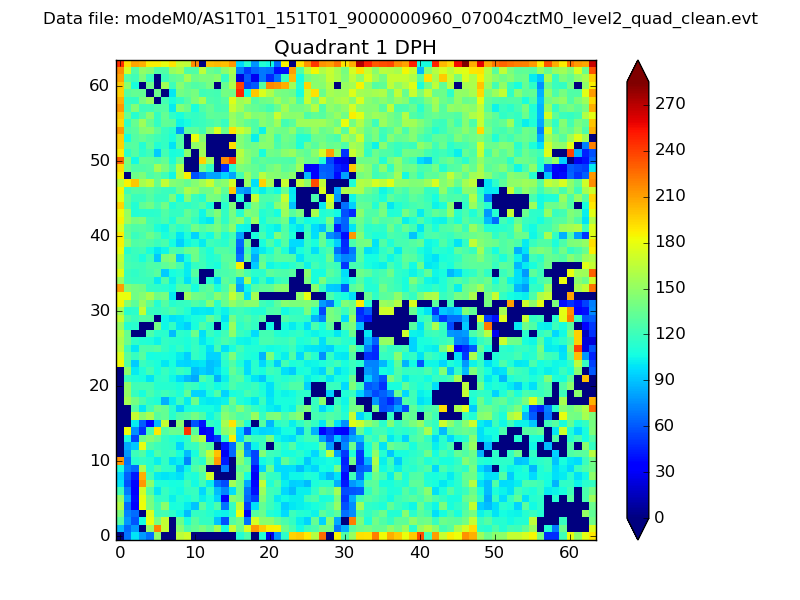 |
Quadrant B |
|---|---|---|---|
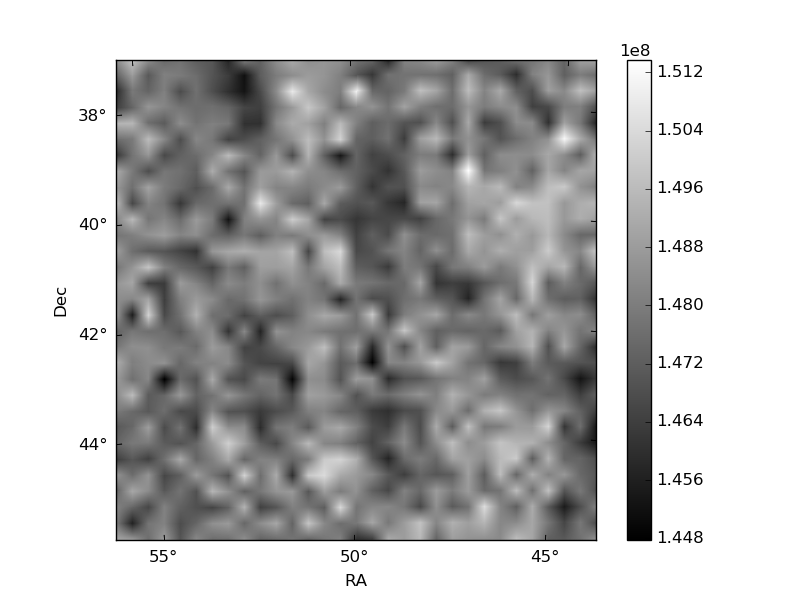
| Quadrant D | 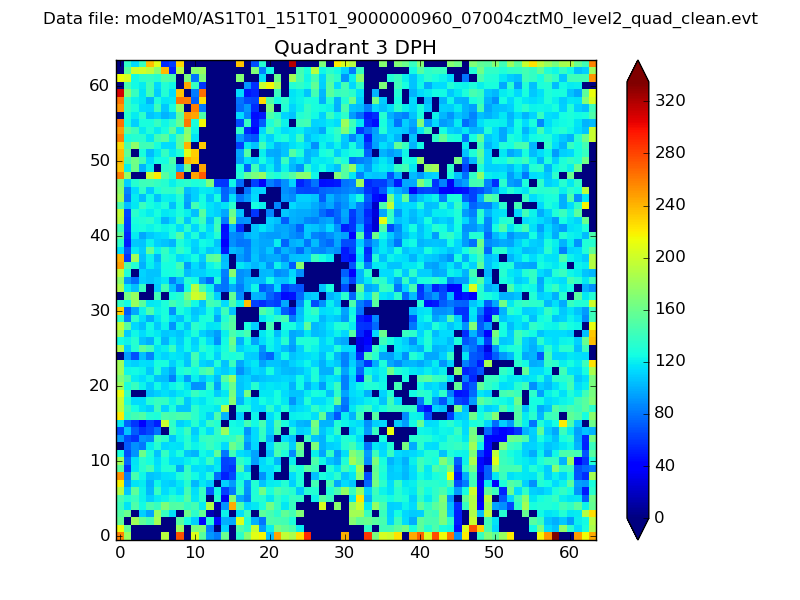 |
 |
Quadrant C |
| Plot type | Count rate plots | Images |
|---|---|---|
| Comparison with Poisson distribution Blue bars denote a histogram of data divided into 1 sec bins. Red curve is a Poisson curve with rate = median count rate of data. |
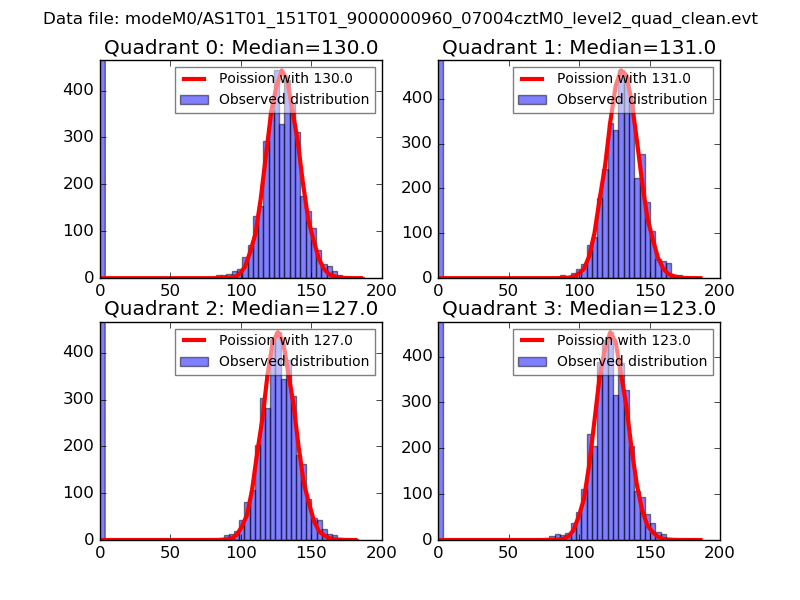 |
 |
| Quadrant-wise count rates Data is divided into 100 sec bins |
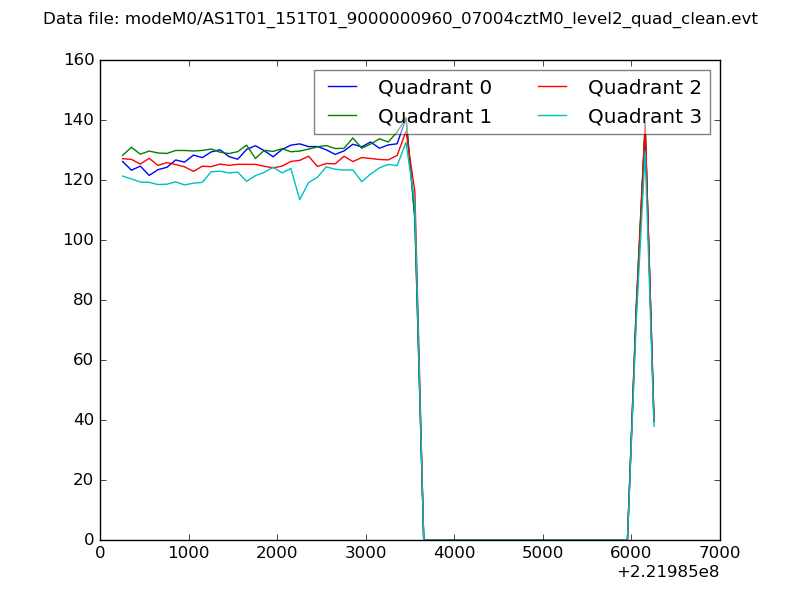 |
|
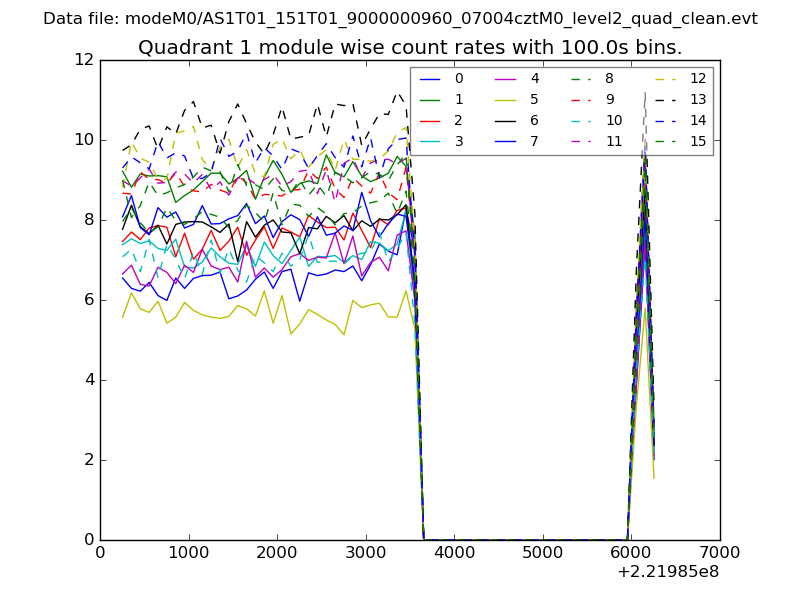
| Module-wise count rates for Quadrant A Data is divided into 100 sec bins |
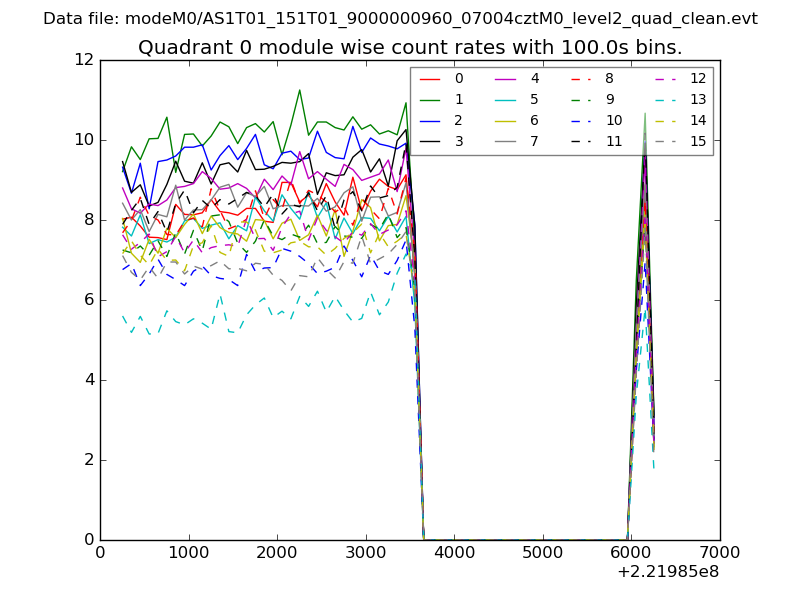 |
 |
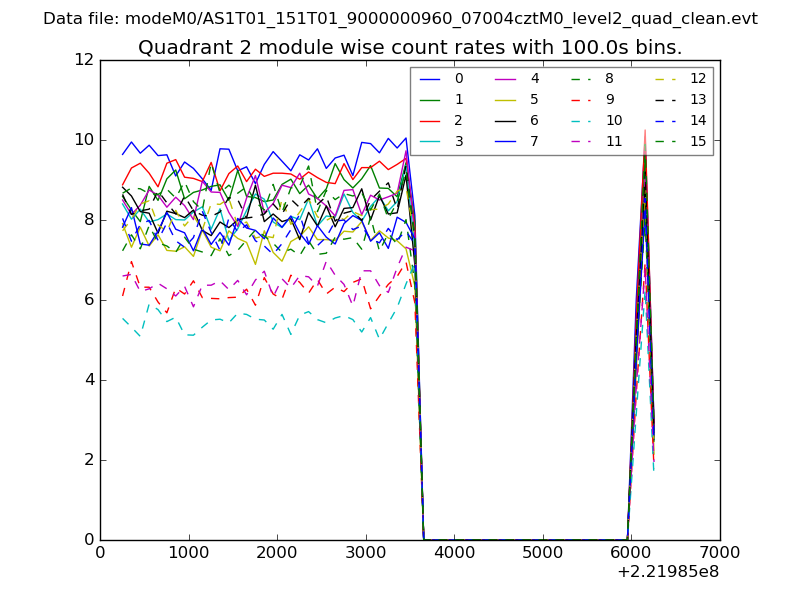
| Module-wise count rates for Quadrant B Data is divided into 100 sec bins |
 |
 |
| Module-wise count rates for Quadrant C Data is divided into 100 sec bins |
 |
 |
| Module-wise count rates for Quadrant D Data is divided into 100 sec bins |
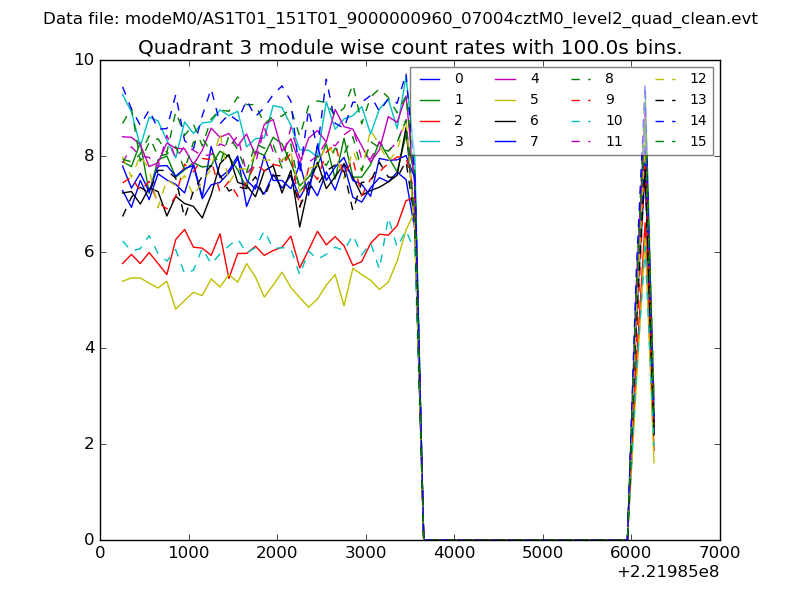 |
 |
| Parameter | Plot |
|---|---|
| CZT HV Monitor | 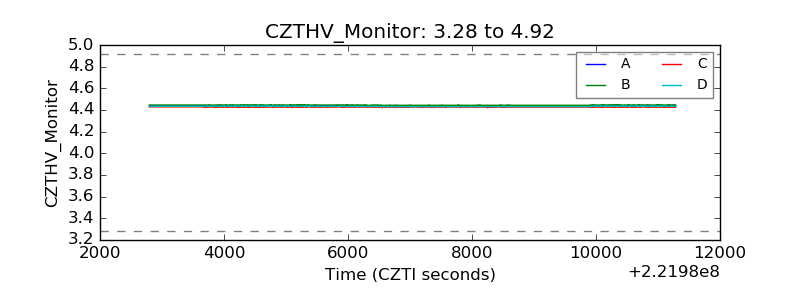 |
| D_VDD | 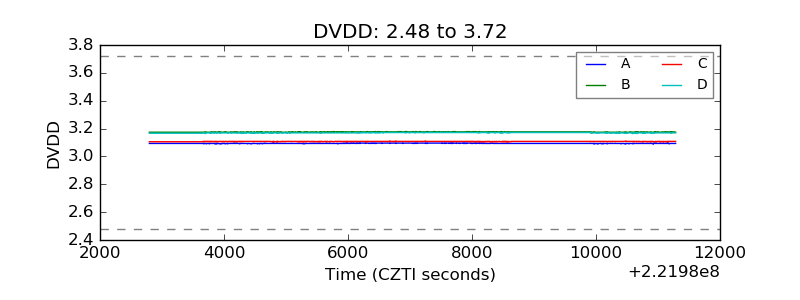 |
| Temperature 1 | 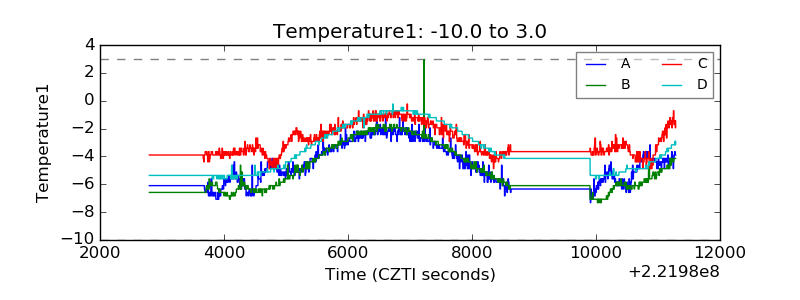 |
| Veto HV Monitor | 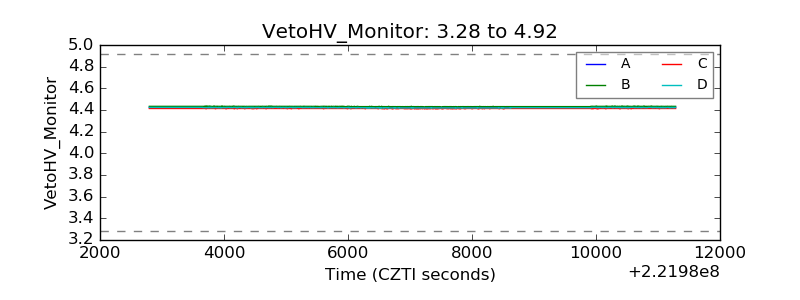 |
| Veto LLD | 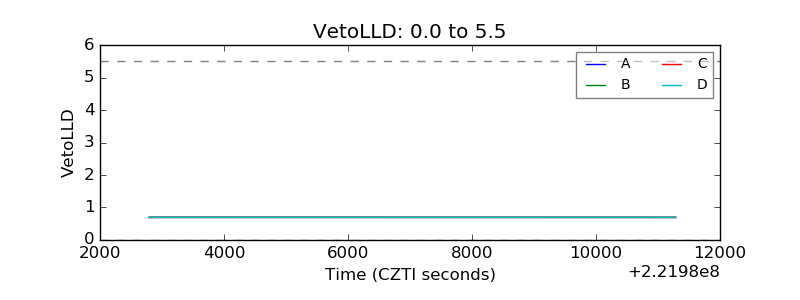 |
| Alpha Counter | 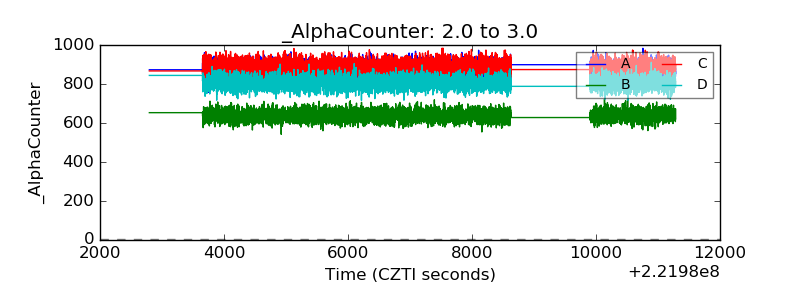 |
| _CPM_Rate | 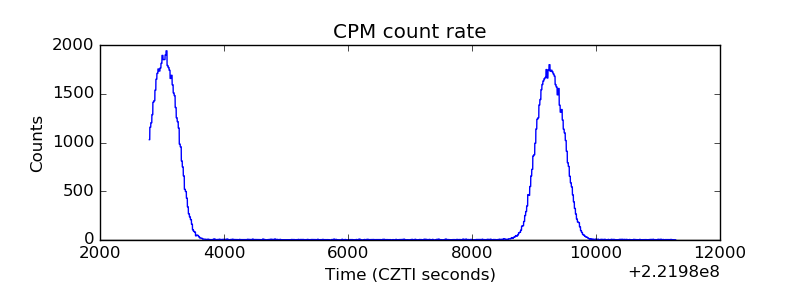 |
| CZT Counter | 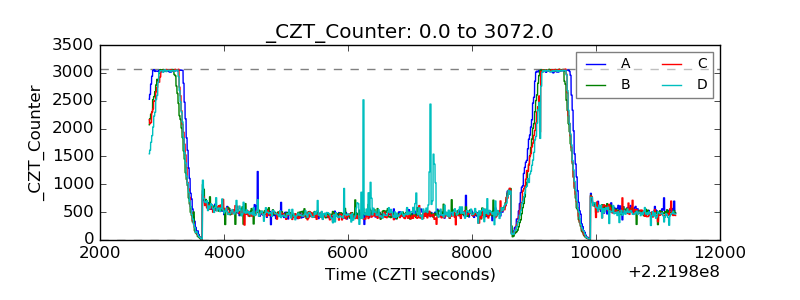 |
| +2.5 Volts monitor | 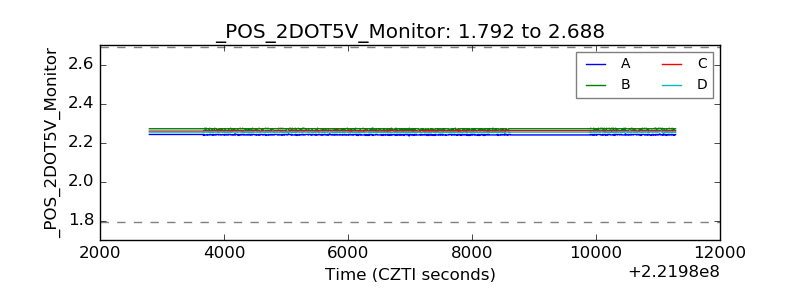 |
| +5 Volts monitor |  |
| _ROLL_ROT | 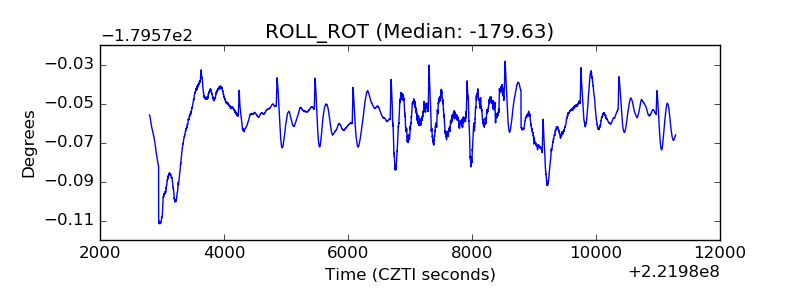 |
| _Roll_DEC | 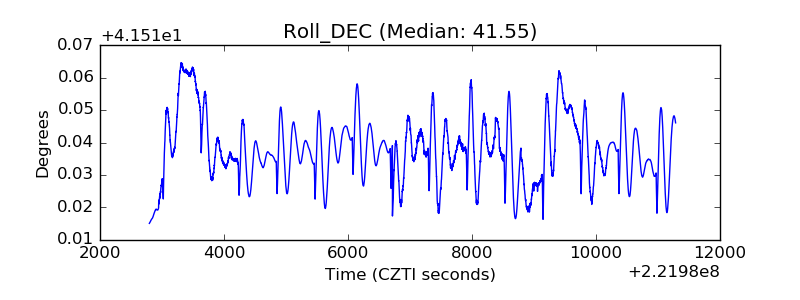 |
| _Roll_RA | 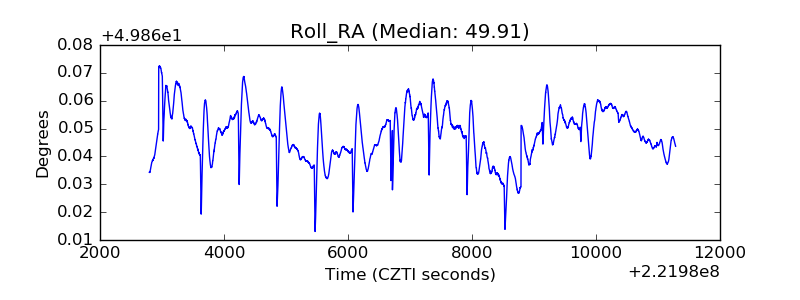 |
| Veto Counter | 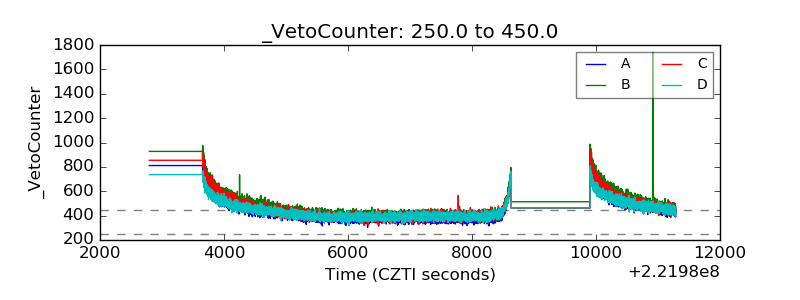 |