| Param | Original file | Final file |
|---|---|---|
| Filename | modeM0/AS1T01_151T01_9000000960_07005cztM0_level2.evt | modeM0/AS1T01_151T01_9000000960_07005cztM0_level2_quad_clean.evt |
| Size (bytes) | 443,799,360 | 89,369,280 |
| Size | 423.2 MB | 85.2 MB |
| Events in quadrant A | 3,191,455 | 576,879 |
| Events in quadrant B | 3,332,225 | 581,393 |
| Events in quadrant C | 3,058,676 | 562,437 |
| Events in quadrant D | 3,429,309 | 545,305 |
| Mode SS | |||
|---|---|---|---|
| Quadrant | BADHDUFLAG | Total packets | Discarded packets |
| A | 0 | 128 | 0 |
| B | 0 | 128 | 0 |
| C | 0 | 128 | 0 |
| D | 0 | 128 | 0 |
| Mode M9 | |||
|---|---|---|---|
| Quadrant | BADHDUFLAG | Total packets | Discarded packets |
| A | 0 | 13 | 0 |
| B | 0 | 13 | 0 |
| C | 0 | 13 | 0 |
| D | 0 | 14 | 0 |
| Mode M0 | |||
|---|---|---|---|
| Quadrant | BADHDUFLAG | Total packets | Discarded packets |
| A | 0 | 13234 | 3 |
| B | 0 | 13675 | 2 |
| C | 0 | 13075 | 2 |
| D | 0 | 14046 | 2 |
| Quadrant | Total seconds | Saturated seconds | Saturation percentage |
|---|---|---|---|
| A | 6311 | 70 | 1.109174% |
| B | 6311 | 97 | 1.536999% |
| C | 6311 | 41 | 0.649659% |
| D | 6311 | 70 | 1.109174% |
Noise dominated data is calculated using 1-second bins in cleaned event files. If a bin has >2000 counts, and if more than 50% of those come from <1% of pixels, then it is considered to be noise-dominated and hence unusable.
| Quadrant | # 1 sec bins | Bins with >0 counts | Bins with >2000 counts | High rate bins dominated by noise | Noise dominated (total time) | Noise dominated (detector-on time) | Marked lightcurve |
|---|---|---|---|---|---|---|---|
| A | 7626 | 6312 | 0 | 0 | 0.00% | 0.00% | 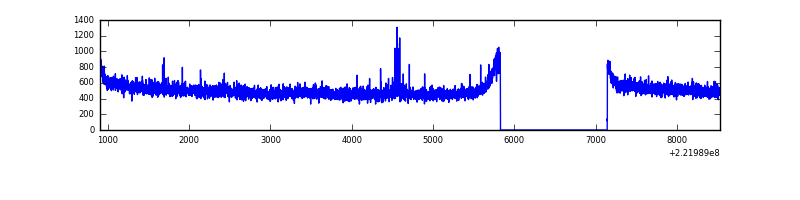 |
| B | 7626 | 6312 | 10 | 10 | 0.13% | 0.16% | 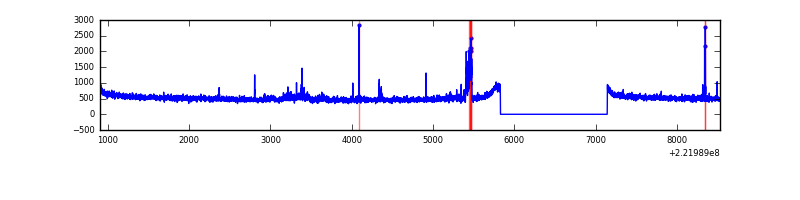 |
| C | 7626 | 6312 | 0 | 0 | 0.00% | 0.00% | 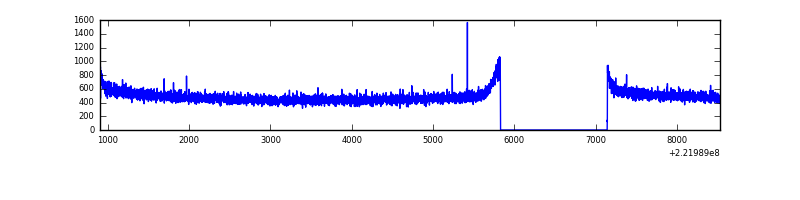 |
| D | 7626 | 6312 | 33 | 33 | 0.43% | 0.52% | 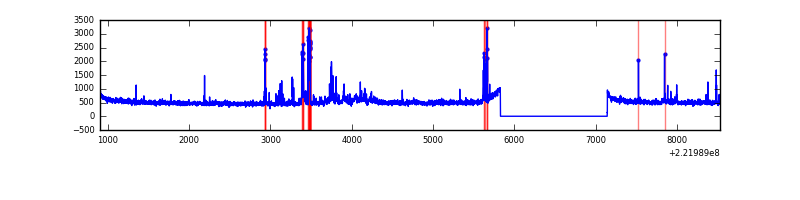 |
Top three noisy pixels from each quadrant. If the there are fewer than three noisy pixels in the level2.evt file, extra rows are filled as -1
| Pixel properties | Quadrant properties | ||||||
|---|---|---|---|---|---|---|---|
| Quadrant | DetID | PixID | Counts | Sigma | Mean | Median | Sigma |
| A | 14 | 239 | 17311 | 99.78 | 819 | 800 | 165.5 |
| A | 13 | 248 | 9836 | 54.61 | 819 | 800 | 165.5 |
| A | 13 | 14 | 8757 | 48.08 | 819 | 800 | 165.5 |
| B | 4 | 239 | 67241 | 431.0 | 819 | 801 | 154.2 |
| B | 0 | 214 | 45587 | 290.53 | 819 | 801 | 154.2 |
| B | 3 | 220 | 15907 | 97.99 | 819 | 801 | 154.2 |
| C | 1 | 16 | 8284 | 41.94 | 779 | 783 | 178.8 |
| C | 13 | 61 | 6118 | 29.83 | 779 | 783 | 178.8 |
| C | 8 | 128 | 5993 | 29.13 | 779 | 783 | 178.8 |
| D | 8 | 195 | 173713 | 905.92 | 786 | 761 | 190.9 |
| D | 1 | 18 | 123612 | 643.49 | 786 | 761 | 190.9 |
| D | 13 | 105 | 62788 | 324.9 | 786 | 761 | 190.9 |
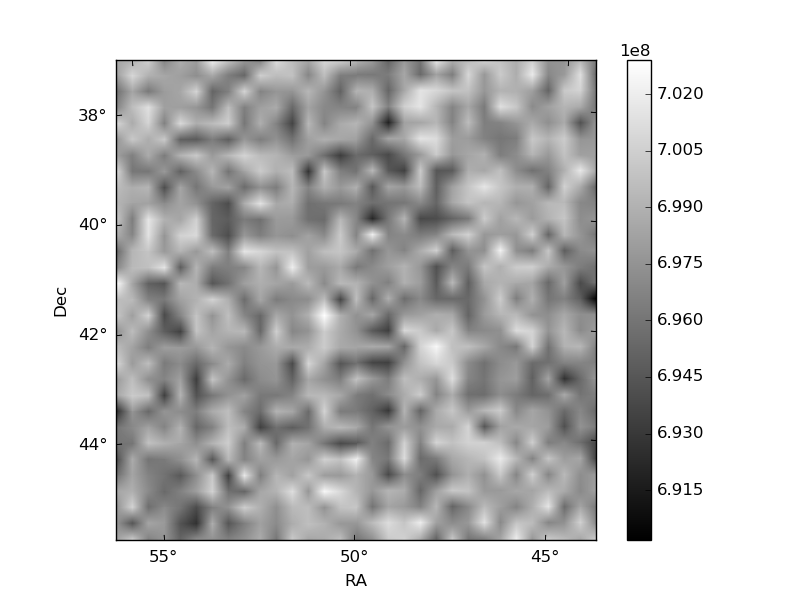
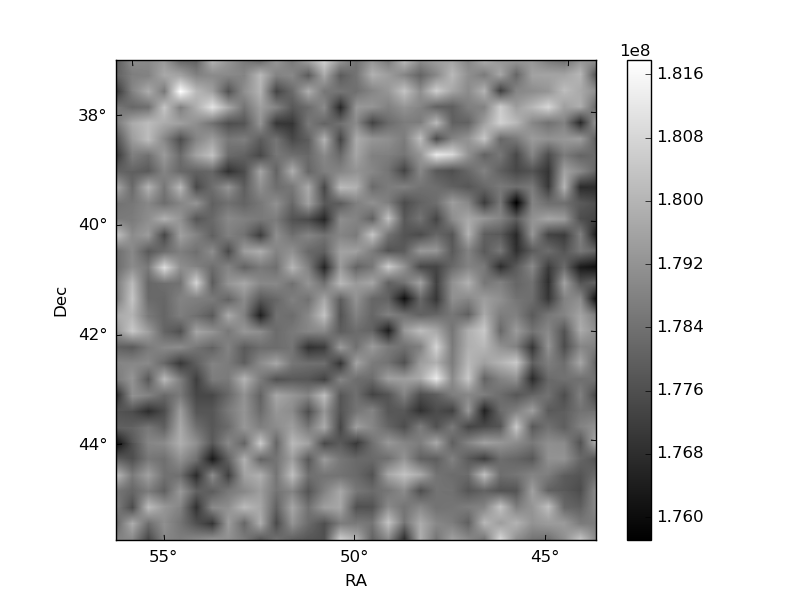
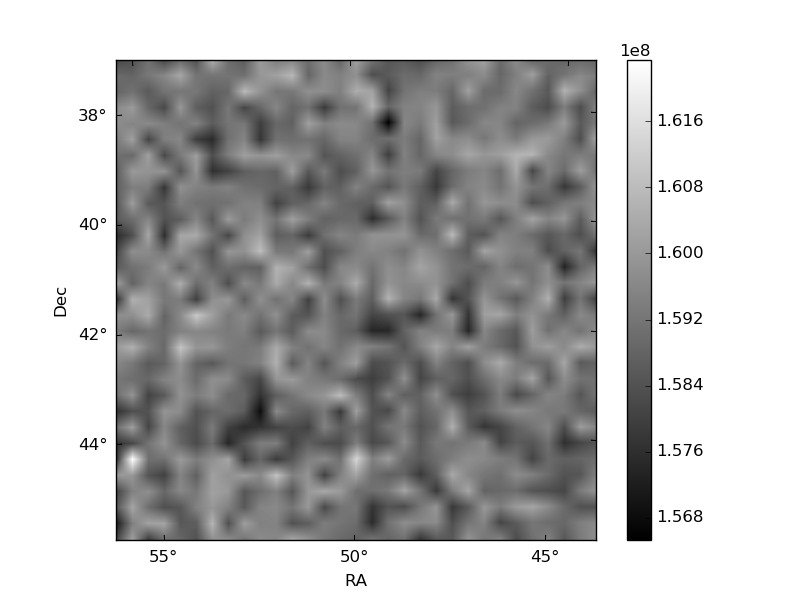
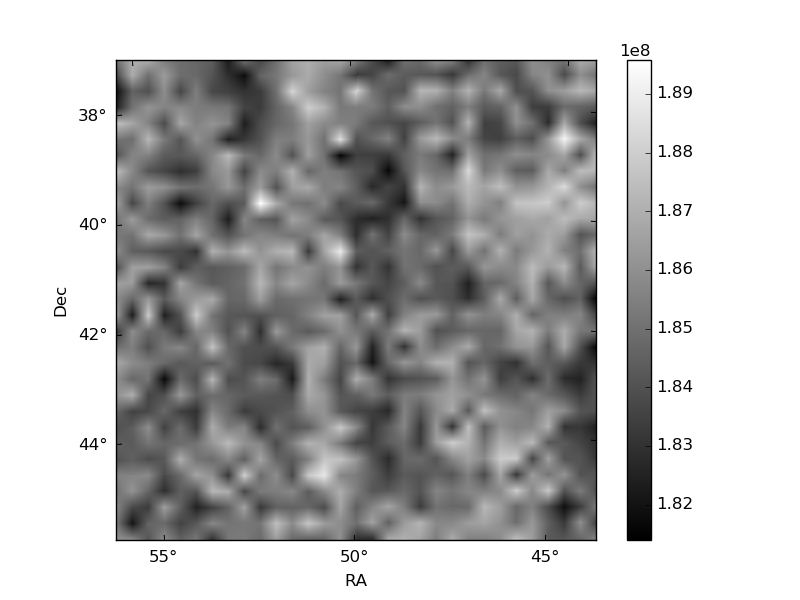
Histogram calculated using DETX and DETY for each event in the final _common_clean file
| Quadrant A | 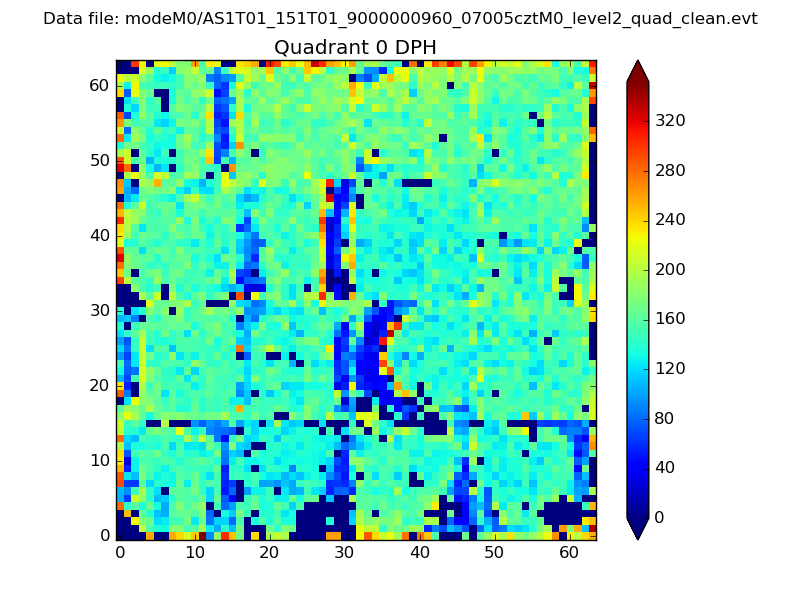 |
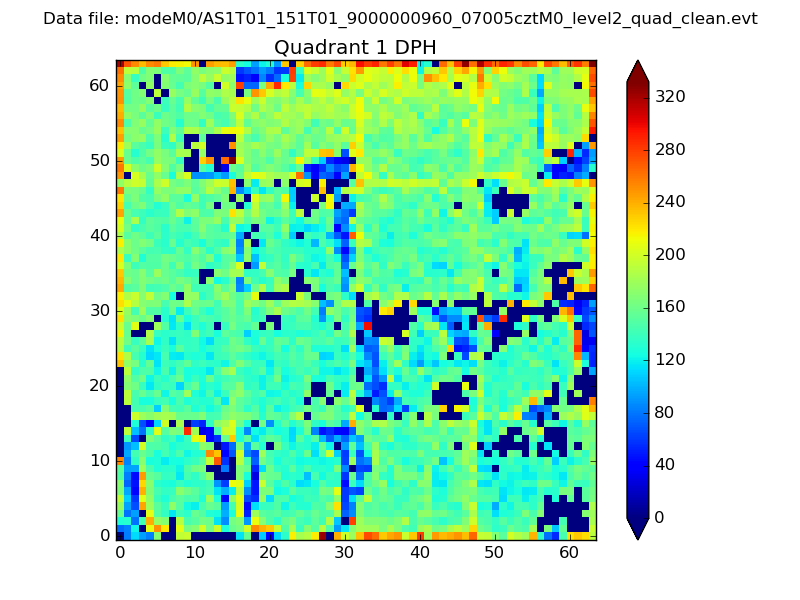 |
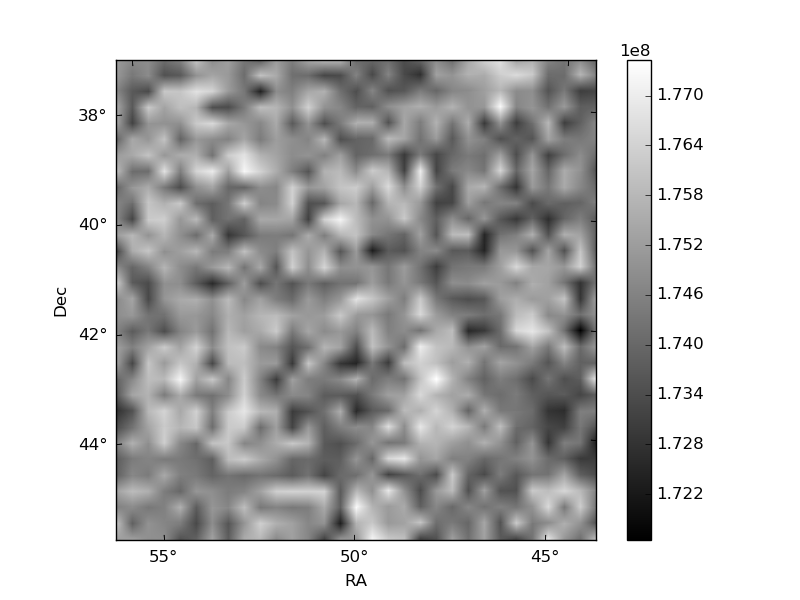
Quadrant B |
|---|---|---|---|
| Quadrant D | 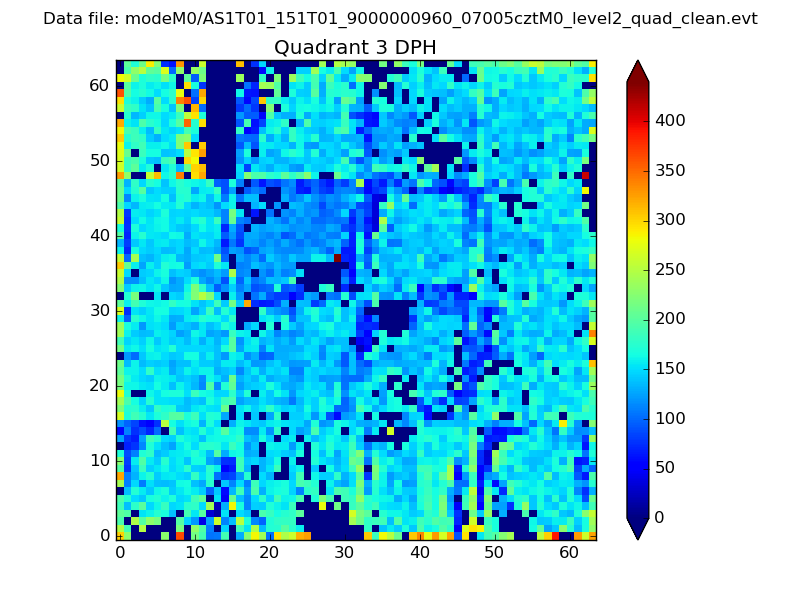 |
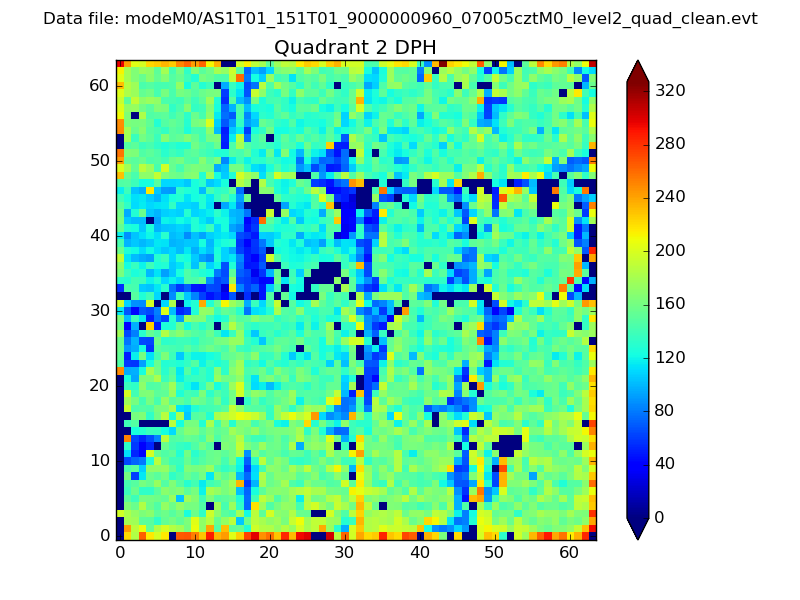 |
Quadrant C |
| Plot type | Count rate plots | Images |
|---|---|---|
| Comparison with Poisson distribution Blue bars denote a histogram of data divided into 1 sec bins. Red curve is a Poisson curve with rate = median count rate of data. |
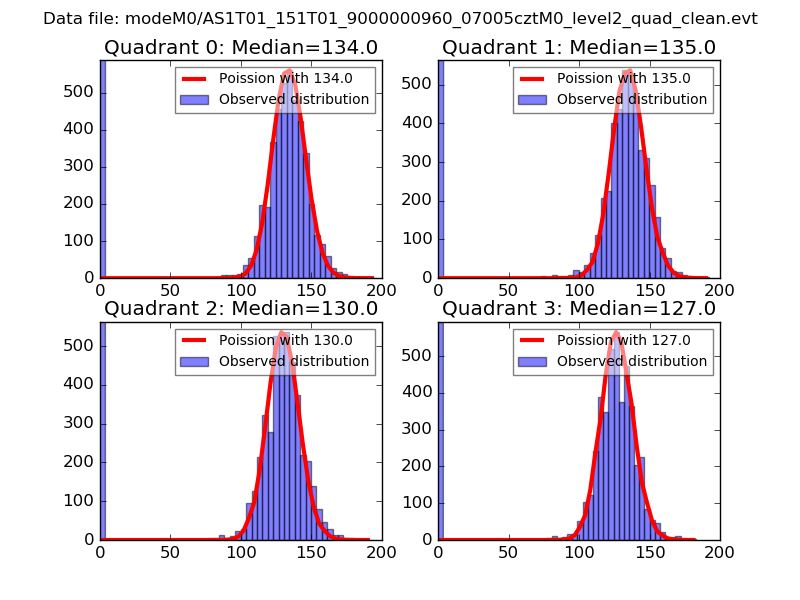 |
 |
| Quadrant-wise count rates Data is divided into 100 sec bins |
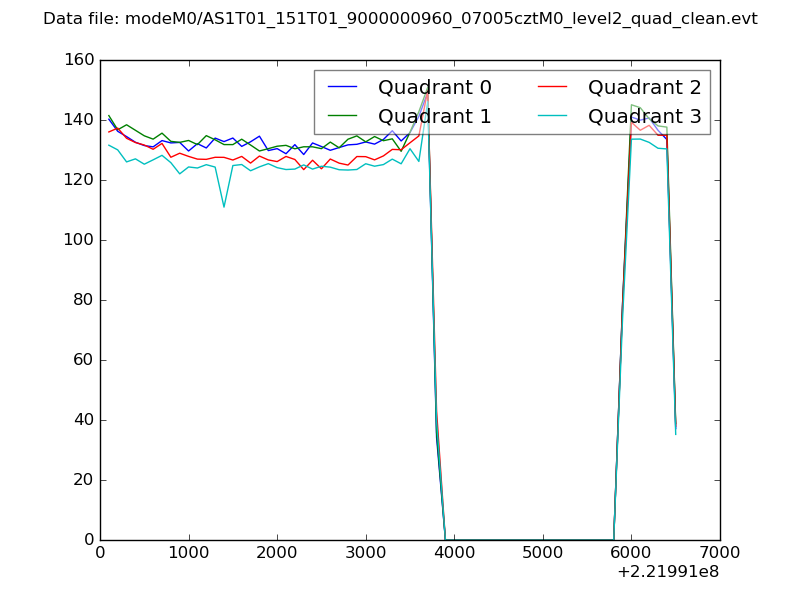 |
|
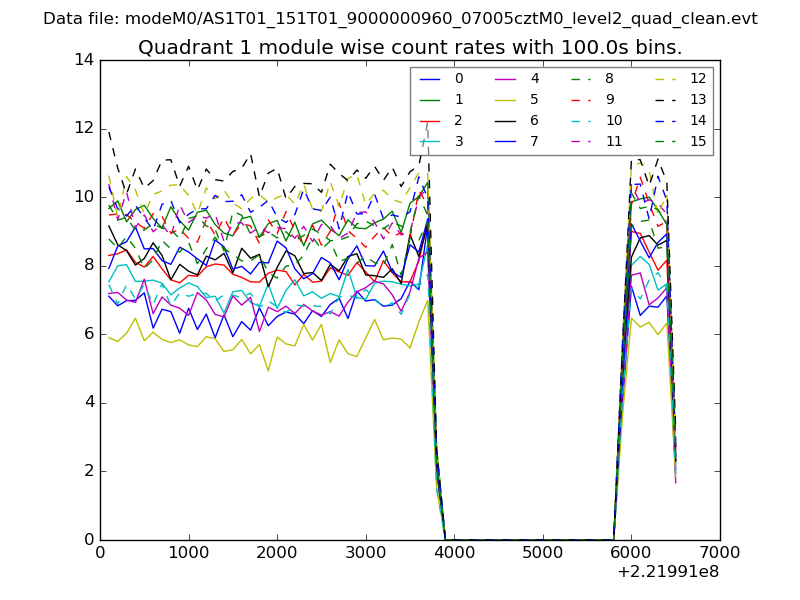
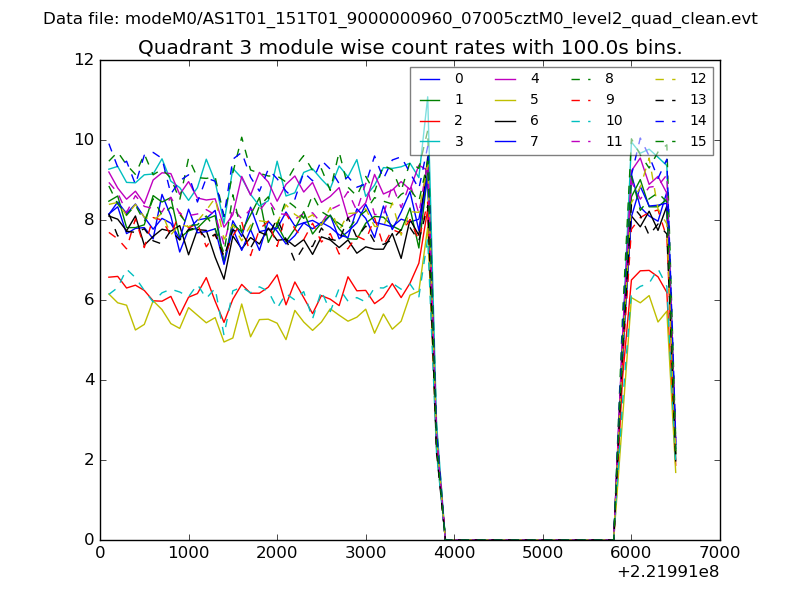
| Module-wise count rates for Quadrant A Data is divided into 100 sec bins |
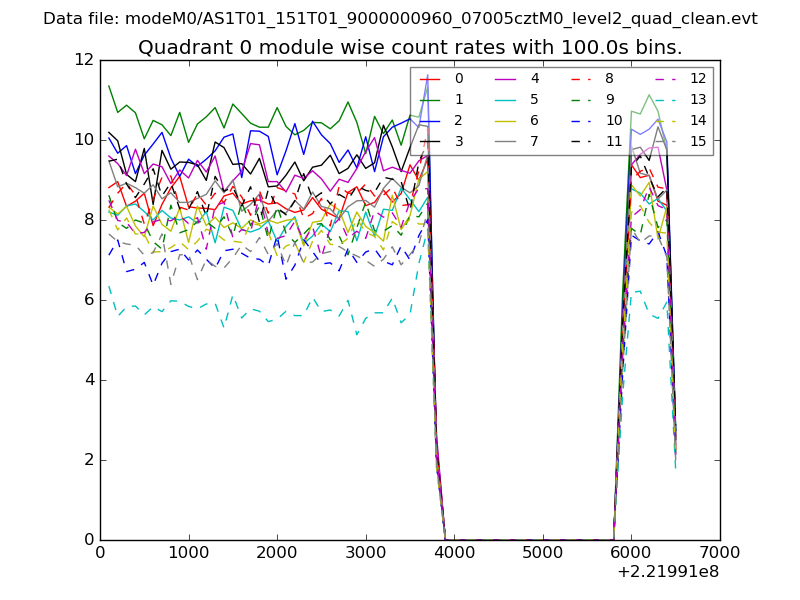 |
 |
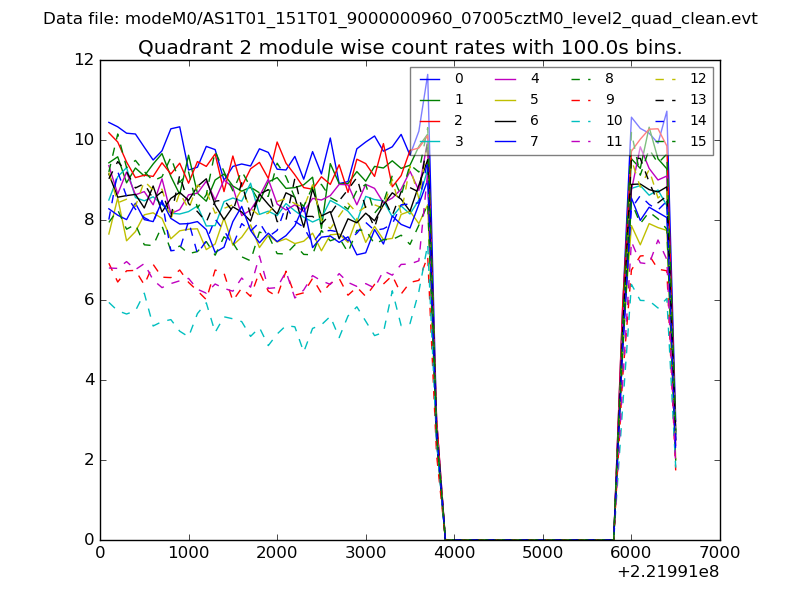
| Module-wise count rates for Quadrant B Data is divided into 100 sec bins |
 |
 |
| Module-wise count rates for Quadrant C Data is divided into 100 sec bins |
 |
 |
| Module-wise count rates for Quadrant D Data is divided into 100 sec bins |
 |
 |
| Parameter | Plot |
|---|---|
| CZT HV Monitor | 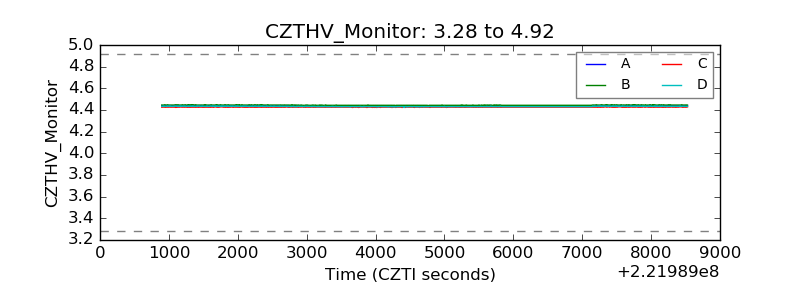 |
| D_VDD | 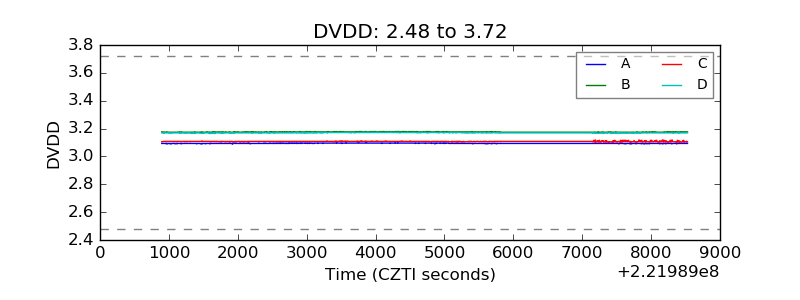 |
| Temperature 1 | 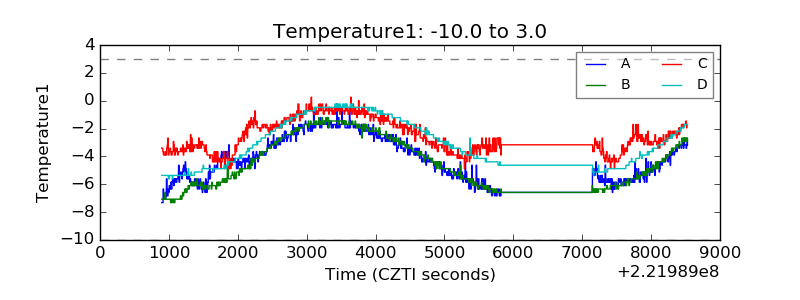 |
| Veto HV Monitor | 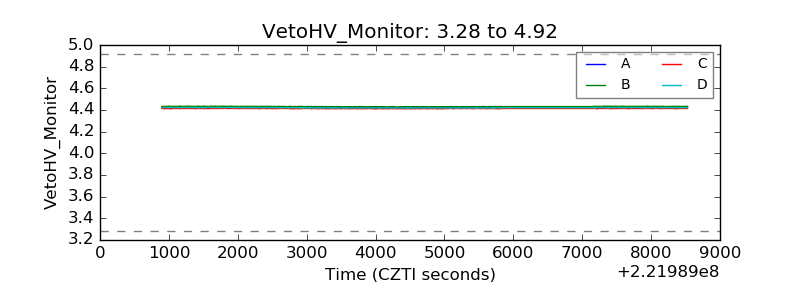 |
| Veto LLD | 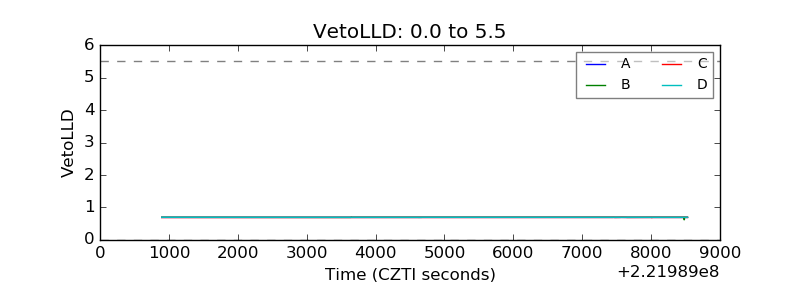 |
| Alpha Counter | 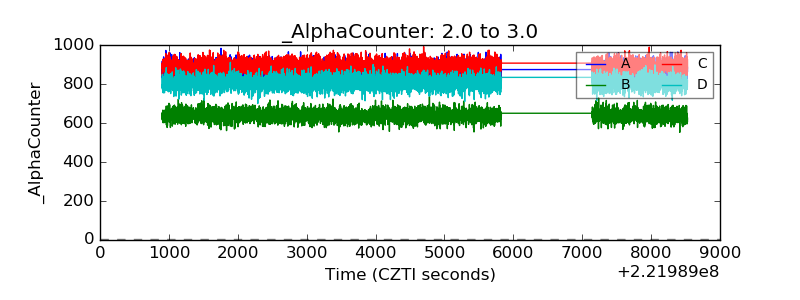 |
| _CPM_Rate | 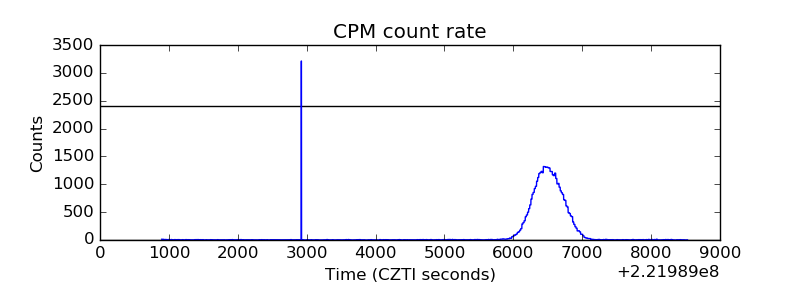 |
| CZT Counter | 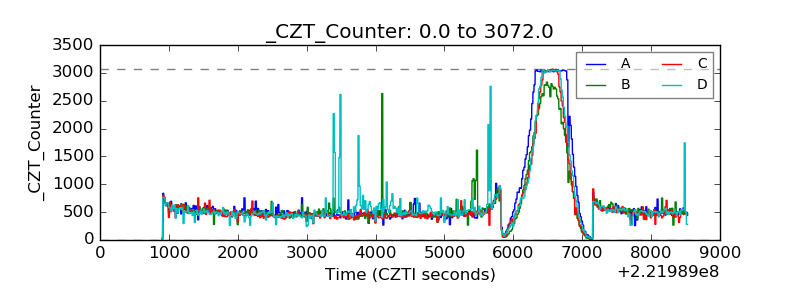 |
| +2.5 Volts monitor |  |
| +5 Volts monitor |  |
| _ROLL_ROT | 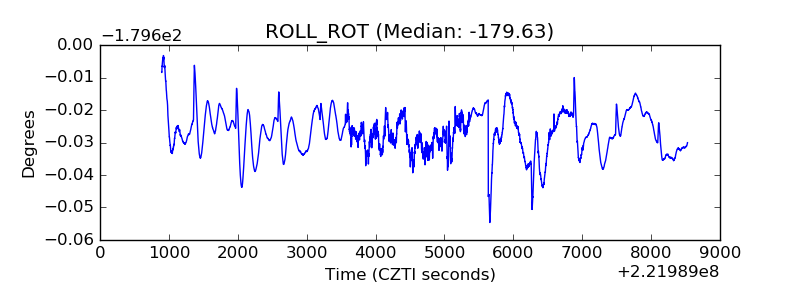 |
| _Roll_DEC | 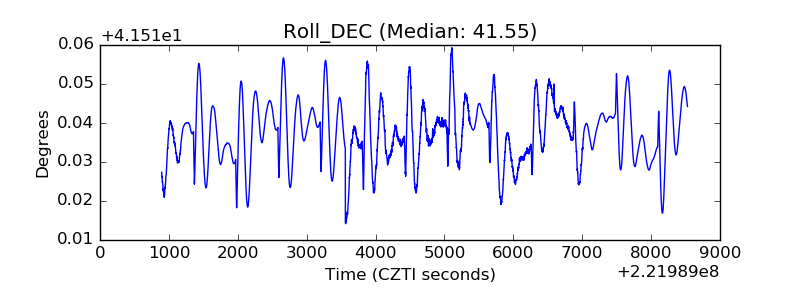 |
| _Roll_RA | 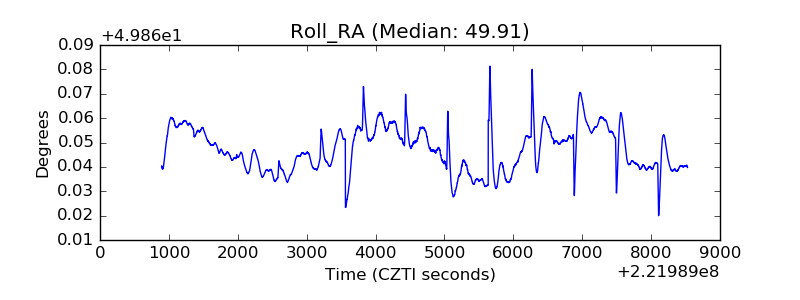 |
| Veto Counter | 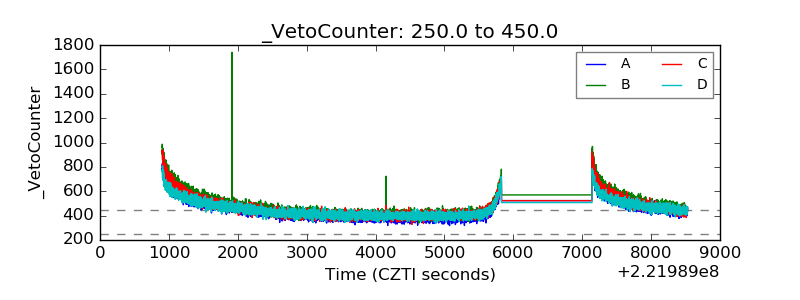 |