| Param | Original file | Final file |
|---|---|---|
| Filename | modeM0/AS1T01_151T01_9000000960_07006cztM0_level2.evt | modeM0/AS1T01_151T01_9000000960_07006cztM0_level2_quad_clean.evt |
| Size (bytes) | 376,721,280 | 80,703,360 |
| Size | 359.3 MB | 77.0 MB |
| Events in quadrant A | 2,670,156 | 529,025 |
| Events in quadrant B | 2,810,205 | 529,377 |
| Events in quadrant C | 2,590,425 | 509,087 |
| Events in quadrant D | 2,970,386 | 498,241 |
| Mode SS | |||
|---|---|---|---|
| Quadrant | BADHDUFLAG | Total packets | Discarded packets |
| A | 0 | 112 | 2 |
| B | 0 | 113 | 5 |
| C | 0 | 112 | 4 |
| D | 0 | 112 | 2 |
| Mode M9 | |||
|---|---|---|---|
| Quadrant | BADHDUFLAG | Total packets | Discarded packets |
| A | 0 | 12 | 0 |
| B | 0 | 12 | 0 |
| C | 0 | 12 | 0 |
| D | 0 | 12 | 0 |
| Mode M0 | |||
|---|---|---|---|
| Quadrant | BADHDUFLAG | Total packets | Discarded packets |
| A | 0 | 11511 | 252 |
| B | 0 | 11836 | 261 |
| C | 0 | 11429 | 247 |
| D | 0 | 12407 | 361 |
| Quadrant | Total seconds | Saturated seconds | Saturation percentage |
|---|---|---|---|
| A | 5406 | 124 | 2.293748% |
| B | 5407 | 132 | 2.441280% |
| C | 5405 | 80 | 1.480111% |
| D | 5404 | 100 | 1.850481% |
Noise dominated data is calculated using 1-second bins in cleaned event files. If a bin has >2000 counts, and if more than 50% of those come from <1% of pixels, then it is considered to be noise-dominated and hence unusable.
| Quadrant | # 1 sec bins | Bins with >0 counts | Bins with >2000 counts | High rate bins dominated by noise | Noise dominated (total time) | Noise dominated (detector-on time) | Marked lightcurve |
|---|---|---|---|---|---|---|---|
| A | 7368 | 5418 | 0 | 0 | 0.00% | 0.00% | 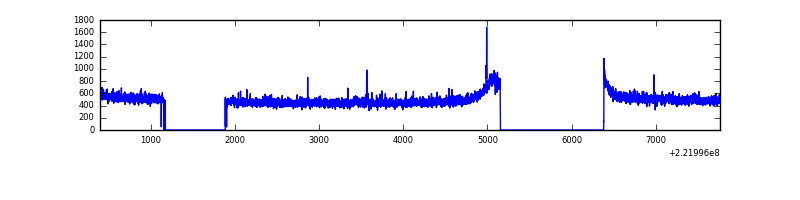 |
| B | 7368 | 5420 | 2 | 2 | 0.03% | 0.04% | 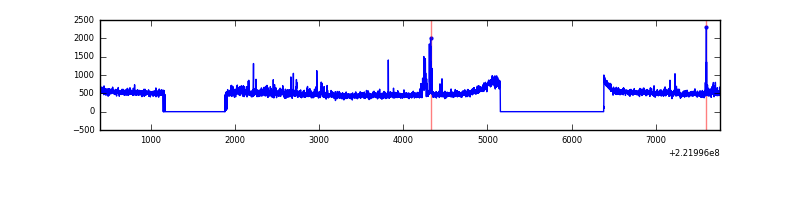 |
| C | 7368 | 5415 | 0 | 0 | 0.00% | 0.00% | 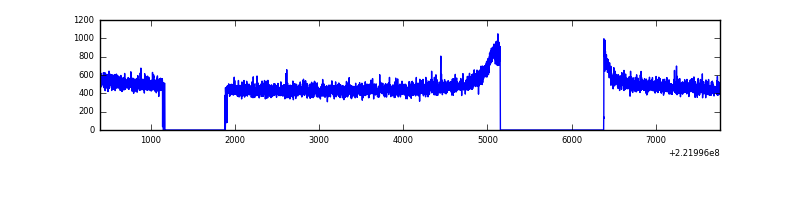 |
| D | 7368 | 5410 | 16 | 16 | 0.22% | 0.30% | 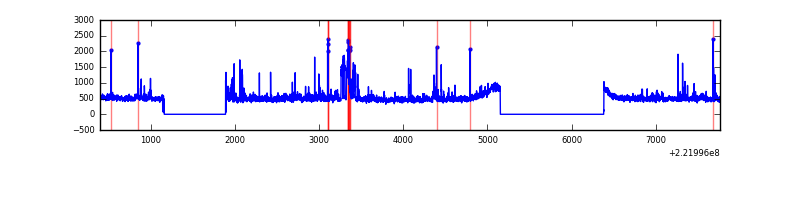 |
Top three noisy pixels from each quadrant. If the there are fewer than three noisy pixels in the level2.evt file, extra rows are filled as -1
| Pixel properties | Quadrant properties | ||||||
|---|---|---|---|---|---|---|---|
| Quadrant | DetID | PixID | Counts | Sigma | Mean | Median | Sigma |
| A | 4 | 2 | 6735 | 43.83 | 687 | 670 | 138.4 |
| A | 0 | 226 | 6588 | 42.77 | 687 | 670 | 138.4 |
| A | 13 | 14 | 6555 | 42.53 | 687 | 670 | 138.4 |
| B | 0 | 214 | 91261 | 695.49 | 685 | 669 | 130.3 |
| B | 4 | 239 | 46049 | 348.39 | 685 | 669 | 130.3 |
| B | 12 | 111 | 12560 | 91.29 | 685 | 669 | 130.3 |
| C | 8 | 128 | 9675 | 59.64 | 656 | 661 | 151.1 |
| C | 1 | 16 | 8622 | 52.68 | 656 | 661 | 151.1 |
| C | 13 | 61 | 5158 | 29.76 | 656 | 661 | 151.1 |
| D | 8 | 195 | 160825 | 981.2 | 664 | 643 | 163.3 |
| D | 13 | 105 | 119545 | 728.34 | 664 | 643 | 163.3 |
| D | 12 | 233 | 61901 | 375.24 | 664 | 643 | 163.3 |
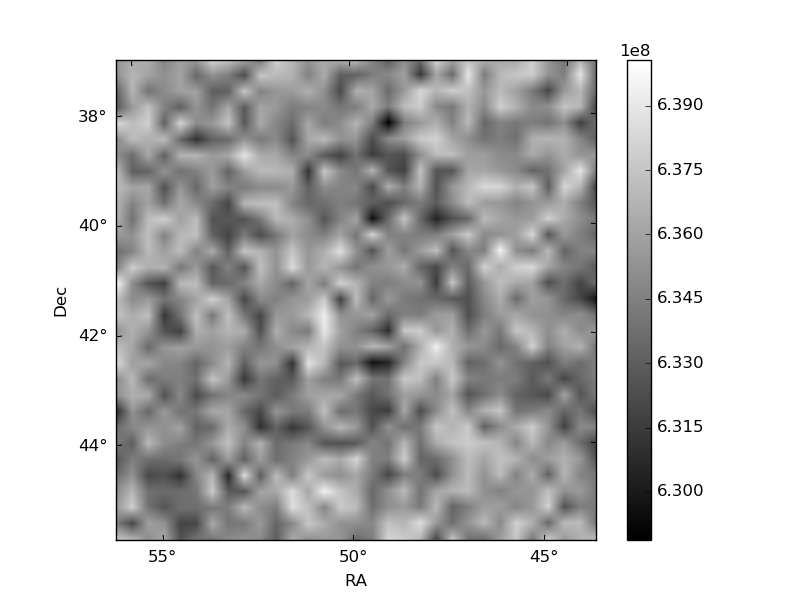
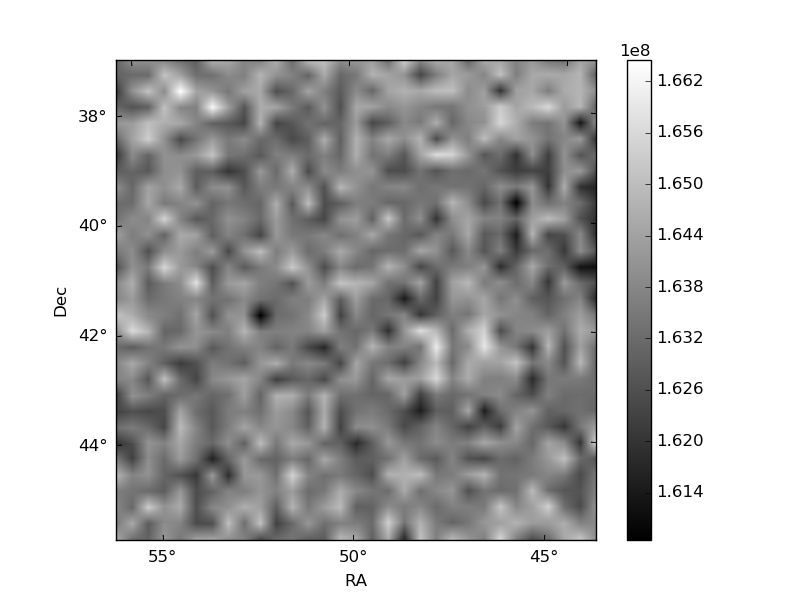
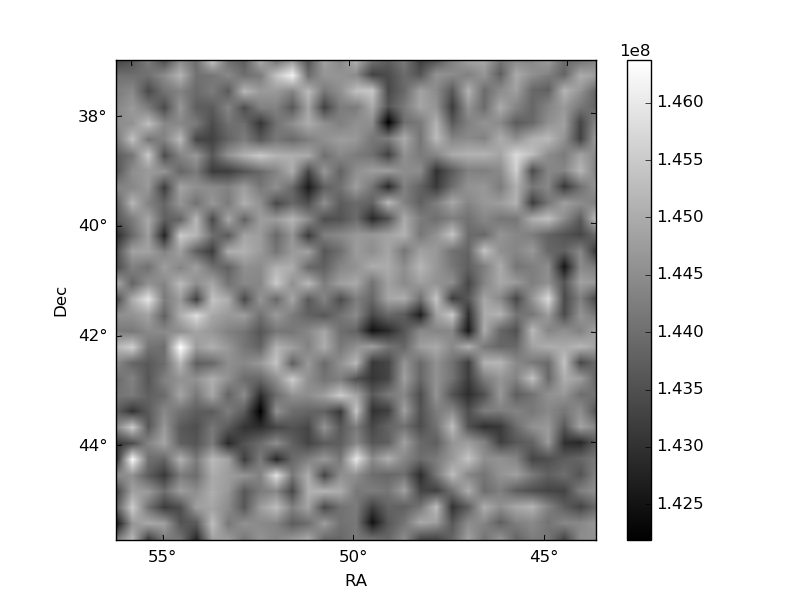
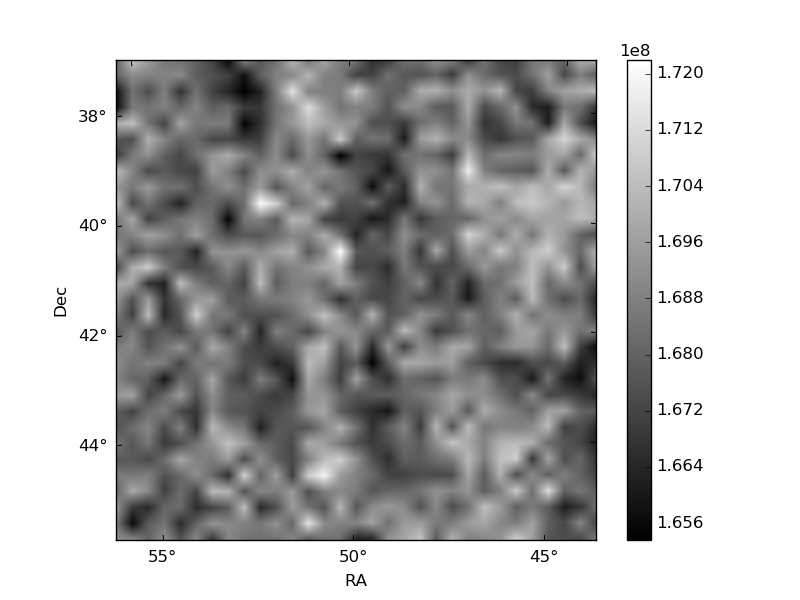
Histogram calculated using DETX and DETY for each event in the final _common_clean file
| Quadrant A | 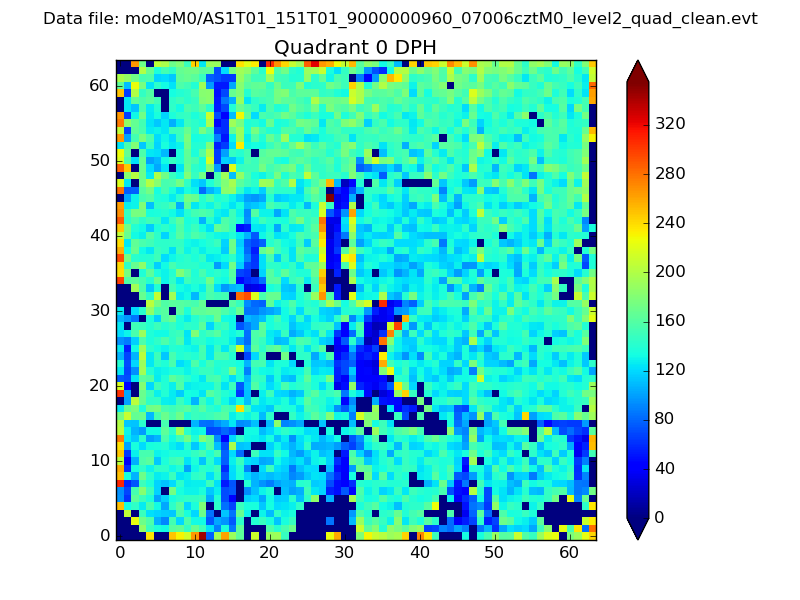 |
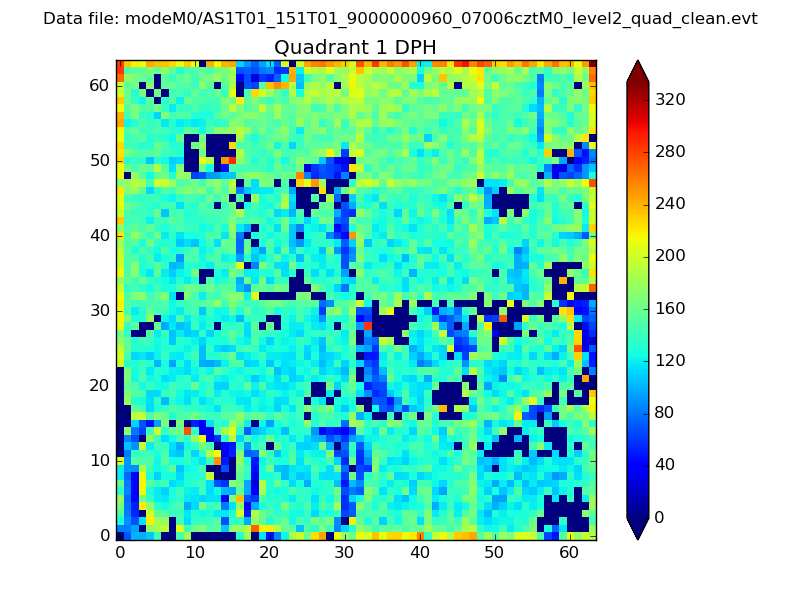 |
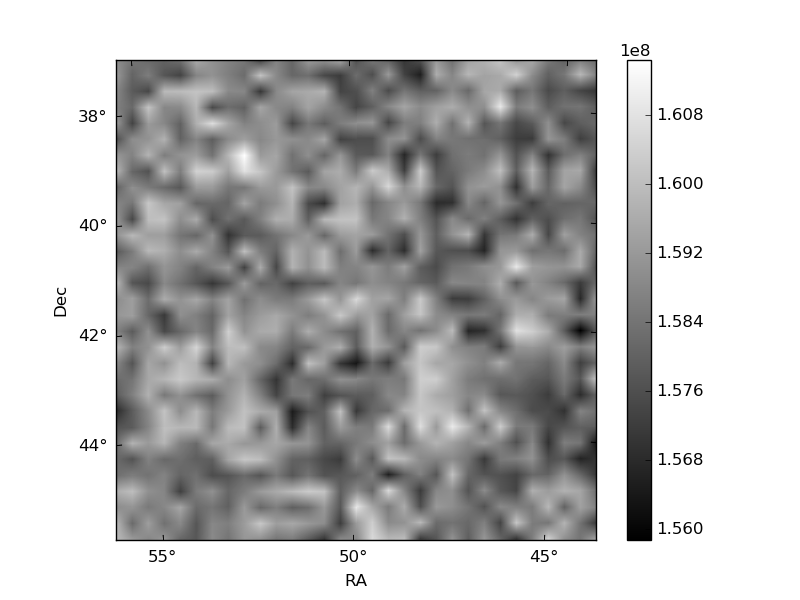
Quadrant B |
|---|---|---|---|
| Quadrant D | 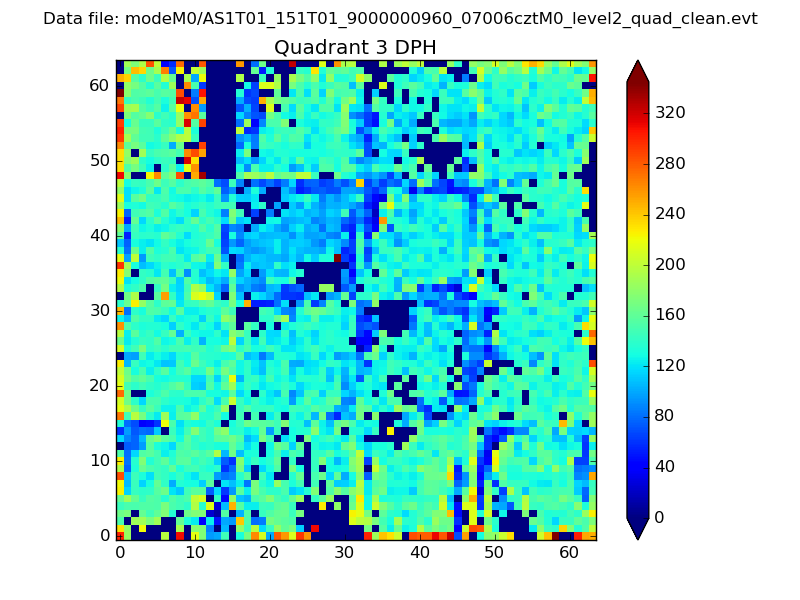 |
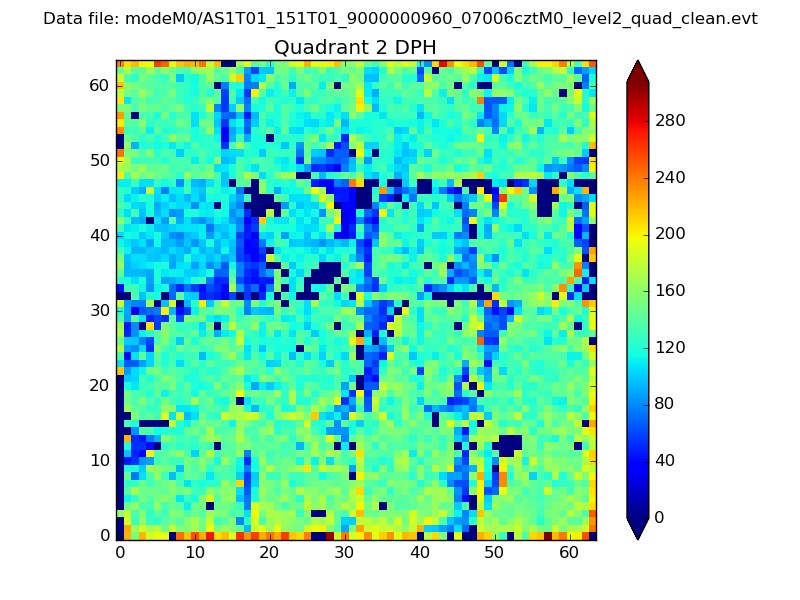 |
Quadrant C |
| Plot type | Count rate plots | Images |
|---|---|---|
| Comparison with Poisson distribution Blue bars denote a histogram of data divided into 1 sec bins. Red curve is a Poisson curve with rate = median count rate of data. |
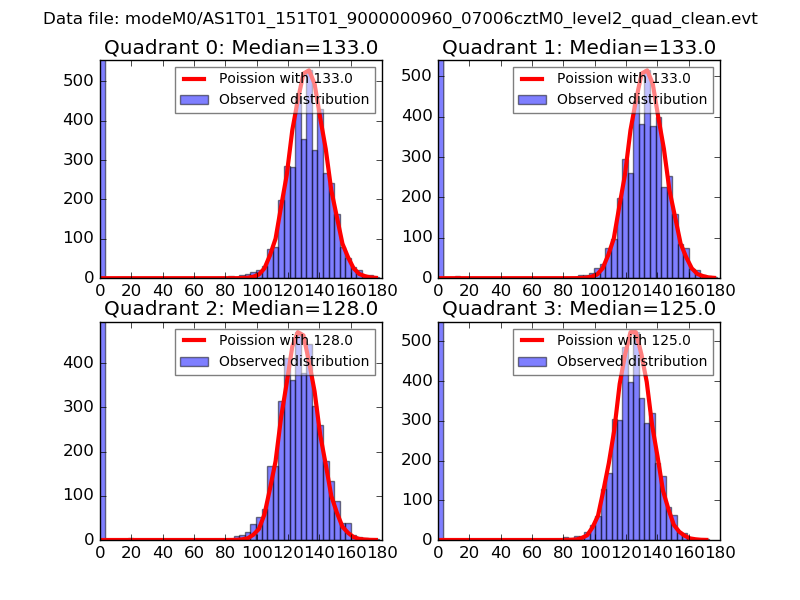 |
 |
| Quadrant-wise count rates Data is divided into 100 sec bins |
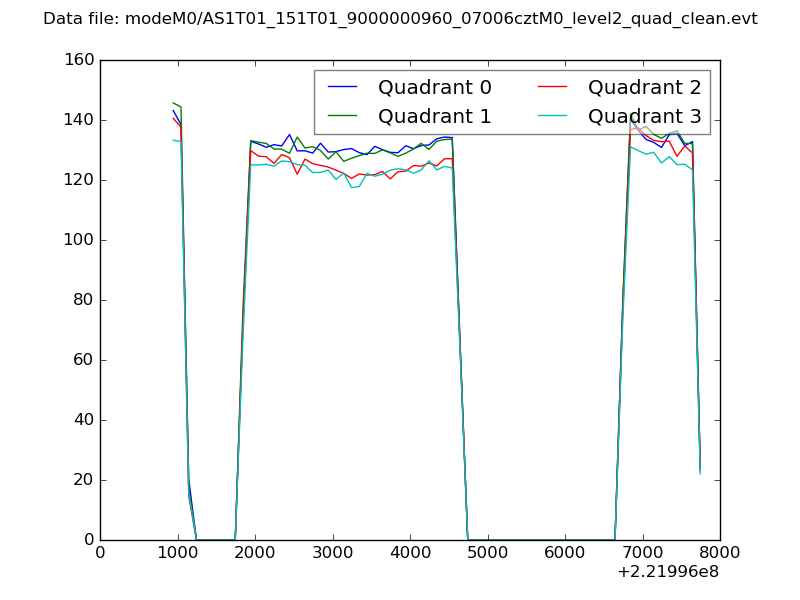 |
|
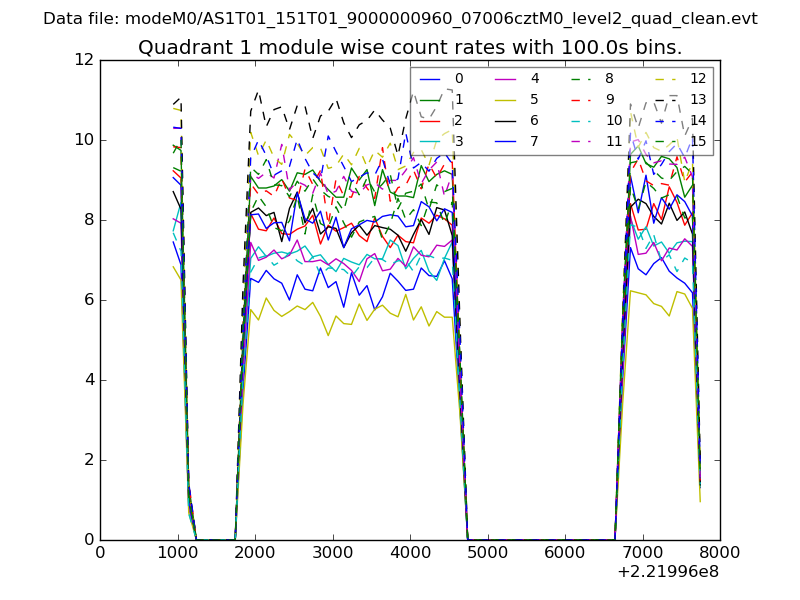
| Module-wise count rates for Quadrant A Data is divided into 100 sec bins |
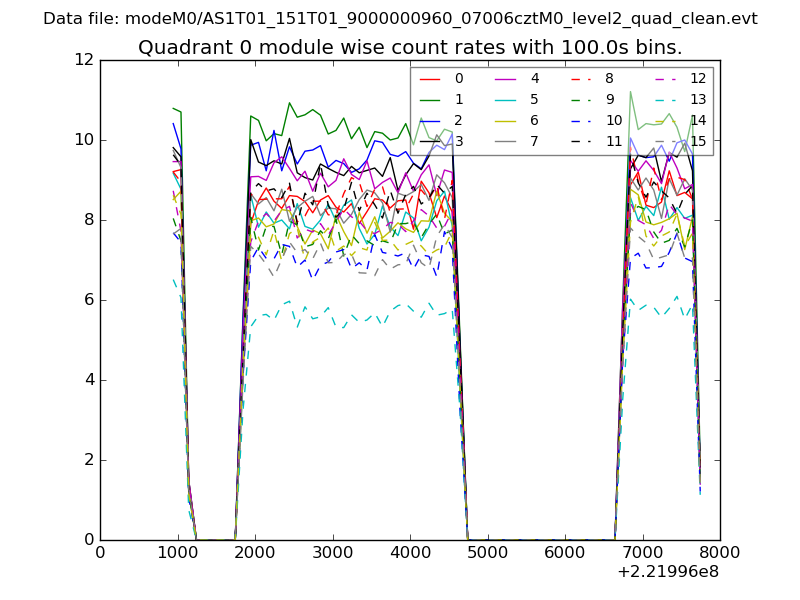 |
 |
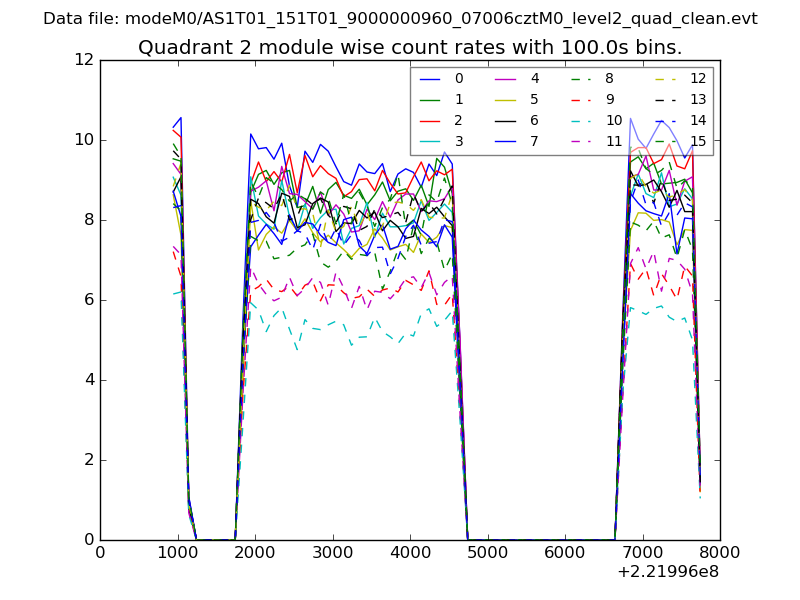
| Module-wise count rates for Quadrant B Data is divided into 100 sec bins |
 |
 |
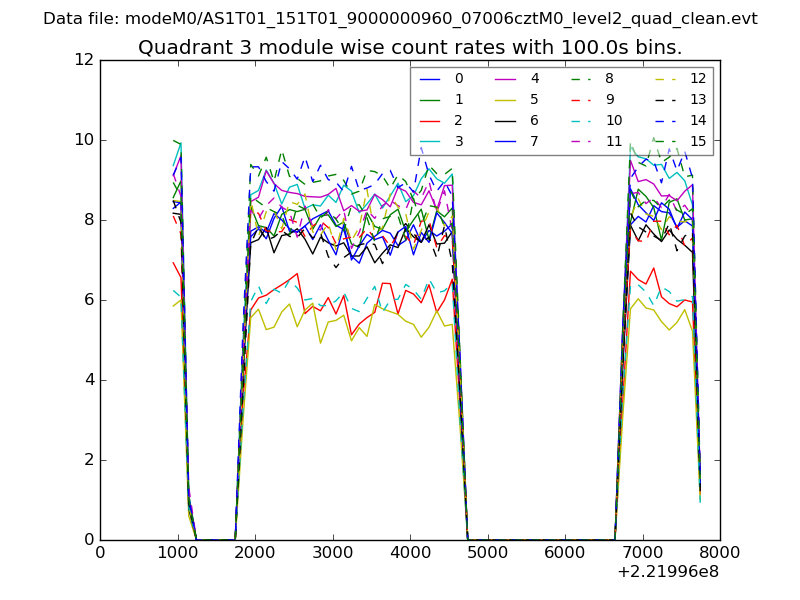
| Module-wise count rates for Quadrant C Data is divided into 100 sec bins |
 |
 |
| Module-wise count rates for Quadrant D Data is divided into 100 sec bins |
 |
 |
| Parameter | Plot |
|---|---|
| CZT HV Monitor | 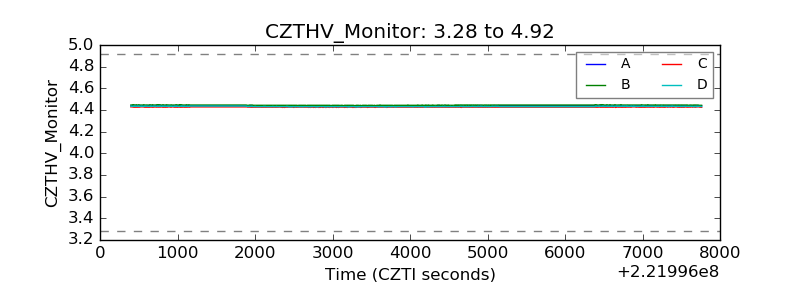 |
| D_VDD | 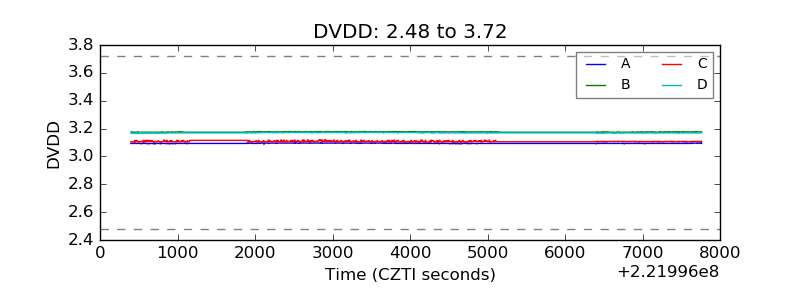 |
| Temperature 1 | 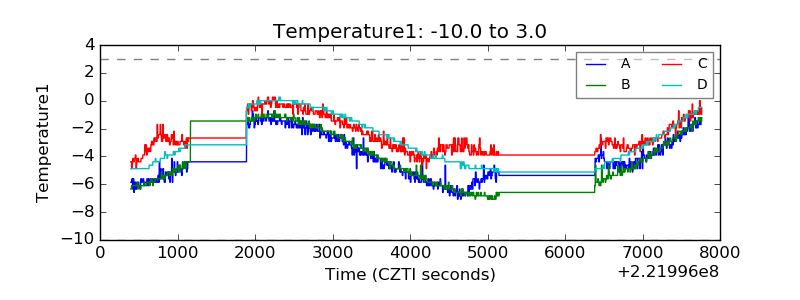 |
| Veto HV Monitor | 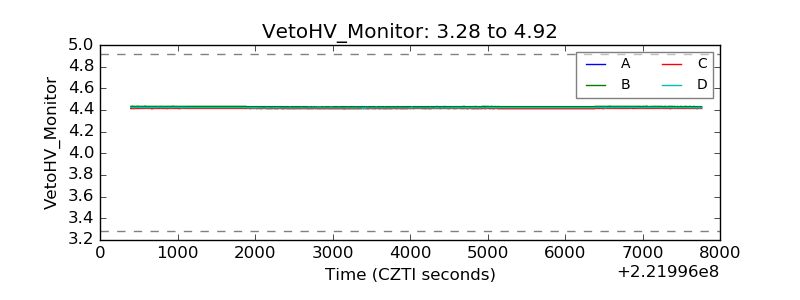 |
| Veto LLD | 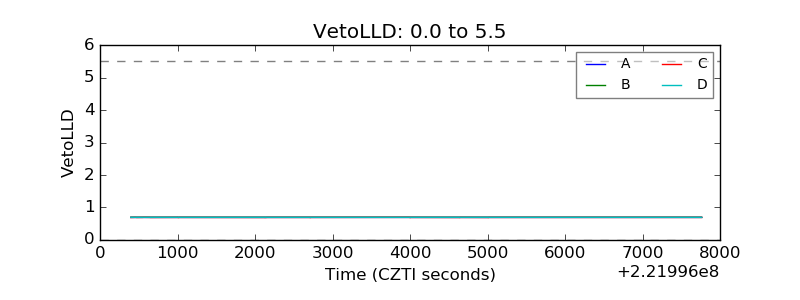 |
| Alpha Counter | 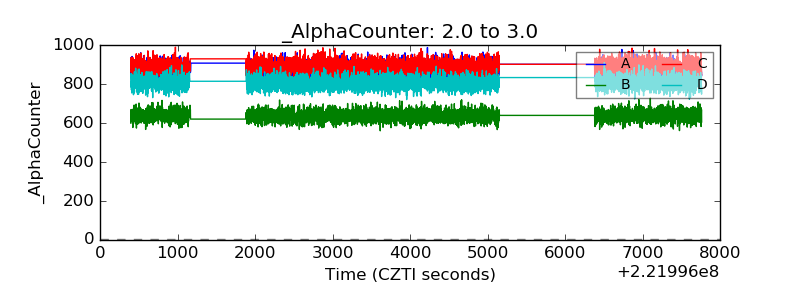 |
| _CPM_Rate | 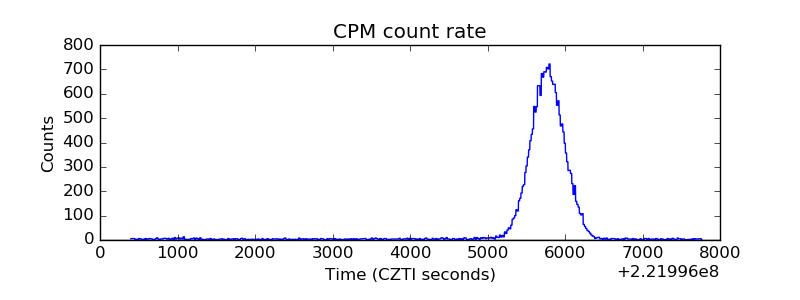 |
| CZT Counter | 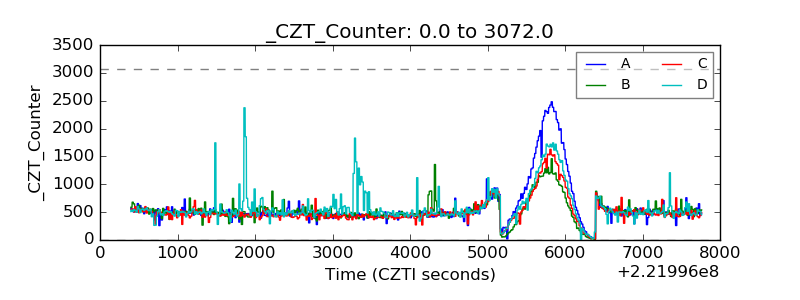 |
| +2.5 Volts monitor | 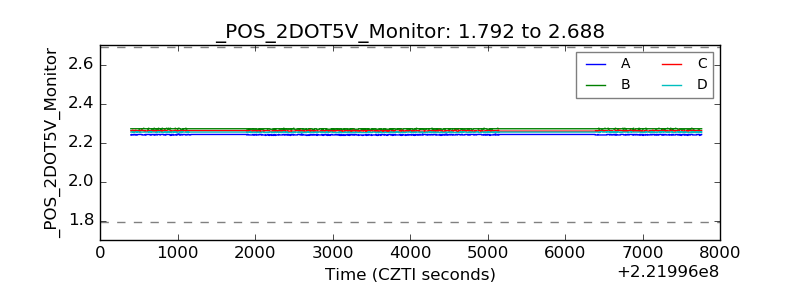 |
| +5 Volts monitor | 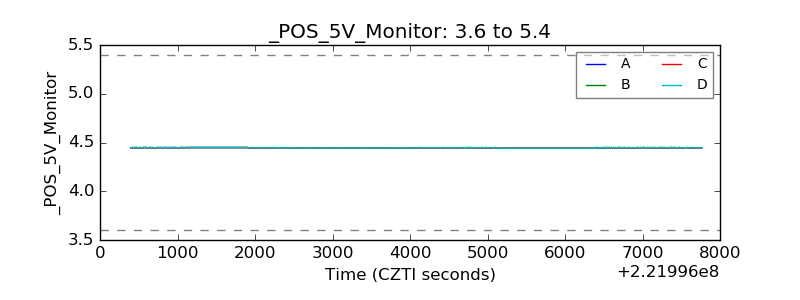 |
| _ROLL_ROT | 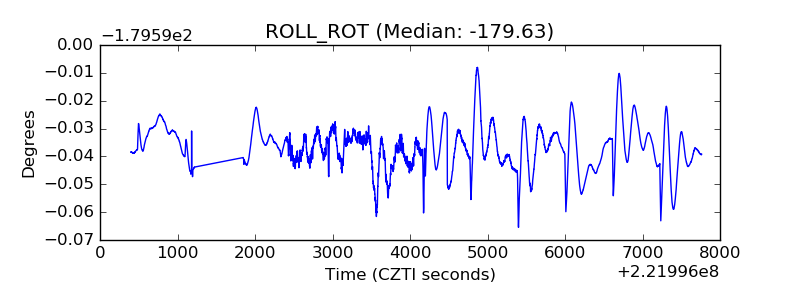 |
| _Roll_DEC | 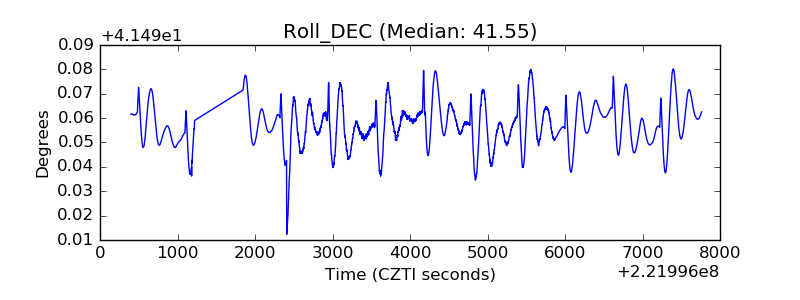 |
| _Roll_RA | 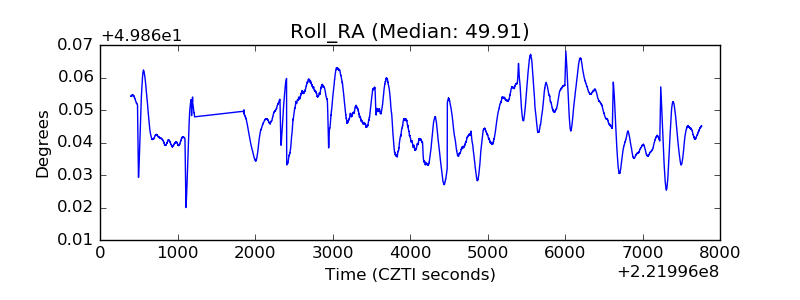 |
| Veto Counter | 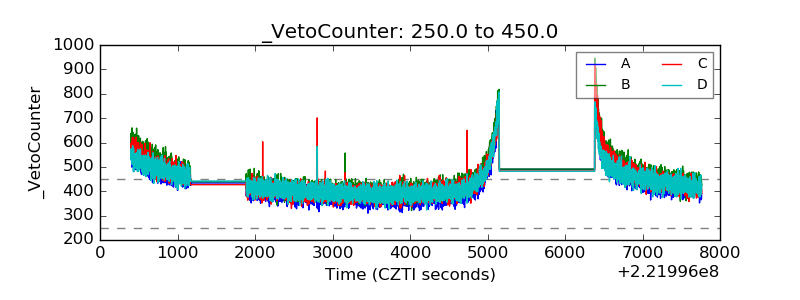 |