| Param | Original file | Final file |
|---|---|---|
| Filename | modeM0/AS1T01_151T01_9000000960_07007cztM0_level2.evt | modeM0/AS1T01_151T01_9000000960_07007cztM0_level2_quad_clean.evt |
| Size (bytes) | 777,479,040 | 176,857,920 |
| Size | 741.5 MB | 168.7 MB |
| Events in quadrant A | 5,503,519 | 1,166,883 |
| Events in quadrant B | 5,858,379 | 1,165,483 |
| Events in quadrant C | 5,345,773 | 1,129,503 |
| Events in quadrant D | 6,063,620 | 1,104,057 |
| Mode SS | |||
|---|---|---|---|
| Quadrant | BADHDUFLAG | Total packets | Discarded packets |
| A | 0 | 232 | 0 |
| B | 0 | 232 | 0 |
| C | 0 | 232 | 0 |
| D | 0 | 232 | 0 |
| Mode M9 | |||
|---|---|---|---|
| Quadrant | BADHDUFLAG | Total packets | Discarded packets |
| A | 0 | 22 | 0 |
| B | 0 | 22 | 0 |
| C | 0 | 22 | 0 |
| D | 0 | 22 | 0 |
| Mode M0 | |||
|---|---|---|---|
| Quadrant | BADHDUFLAG | Total packets | Discarded packets |
| A | 0 | 23671 | 3 |
| B | 0 | 24458 | 2 |
| C | 0 | 23559 | 2 |
| D | 0 | 25063 | 2 |
| Quadrant | Total seconds | Saturated seconds | Saturation percentage |
|---|---|---|---|
| A | 11435 | 273 | 2.387407% |
| B | 11435 | 289 | 2.527328% |
| C | 11435 | 187 | 1.635330% |
| D | 11435 | 231 | 2.020114% |
Noise dominated data is calculated using 1-second bins in cleaned event files. If a bin has >2000 counts, and if more than 50% of those come from <1% of pixels, then it is considered to be noise-dominated and hence unusable.
| Quadrant | # 1 sec bins | Bins with >0 counts | Bins with >2000 counts | High rate bins dominated by noise | Noise dominated (total time) | Noise dominated (detector-on time) | Marked lightcurve |
|---|---|---|---|---|---|---|---|
| A | 13690 | 11437 | 0 | 0 | 0.00% | 0.00% | 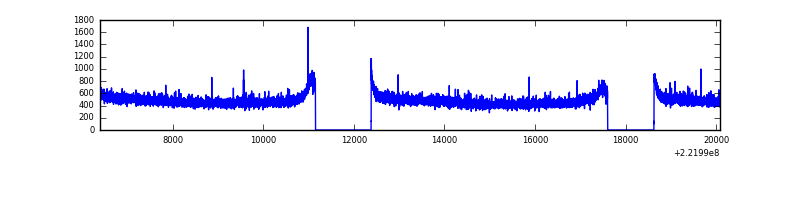 |
| B | 13690 | 11437 | 6 | 6 | 0.04% | 0.05% | 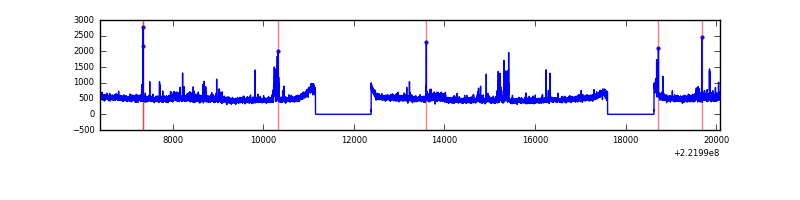 |
| C | 13690 | 11437 | 0 | 0 | 0.00% | 0.00% | 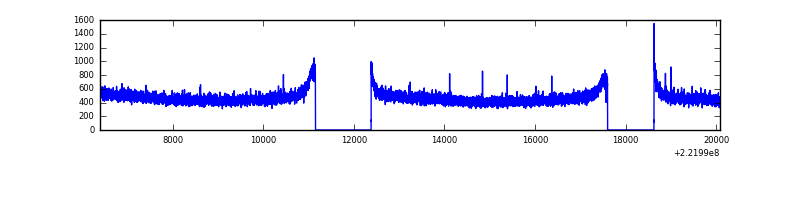 |
| D | 13690 | 11437 | 29 | 29 | 0.21% | 0.25% | 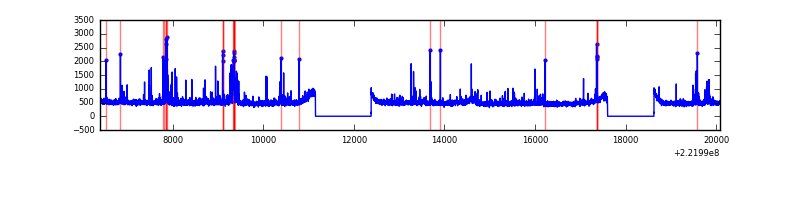 |
Top three noisy pixels from each quadrant. If the there are fewer than three noisy pixels in the level2.evt file, extra rows are filled as -1
| Pixel properties | Quadrant properties | ||||||
|---|---|---|---|---|---|---|---|
| Quadrant | DetID | PixID | Counts | Sigma | Mean | Median | Sigma |
| A | 13 | 248 | 17857 | 57.93 | 1417 | 1385 | 284.3 |
| A | 0 | 226 | 13805 | 43.68 | 1417 | 1385 | 284.3 |
| A | 12 | 194 | 13236 | 41.68 | 1417 | 1385 | 284.3 |
| B | 0 | 214 | 157905 | 589.49 | 1414 | 1383 | 265.5 |
| B | 4 | 239 | 121142 | 451.03 | 1414 | 1383 | 265.5 |
| B | 3 | 220 | 35105 | 127.0 | 1414 | 1383 | 265.5 |
| C | 1 | 16 | 18176 | 54.0 | 1358 | 1364 | 311.4 |
| C | 8 | 128 | 12539 | 35.89 | 1358 | 1364 | 311.4 |
| C | 13 | 61 | 10703 | 29.99 | 1358 | 1364 | 311.4 |
| D | 8 | 195 | 327992 | 968.92 | 1377 | 1331 | 337.1 |
| D | 13 | 105 | 178119 | 524.37 | 1377 | 1331 | 337.1 |
| D | 14 | 34 | 134335 | 394.5 | 1377 | 1331 | 337.1 |
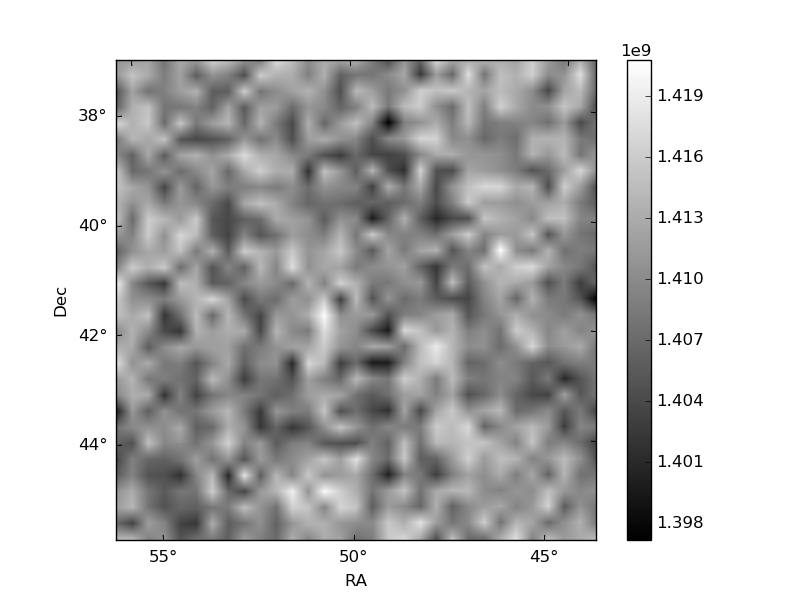
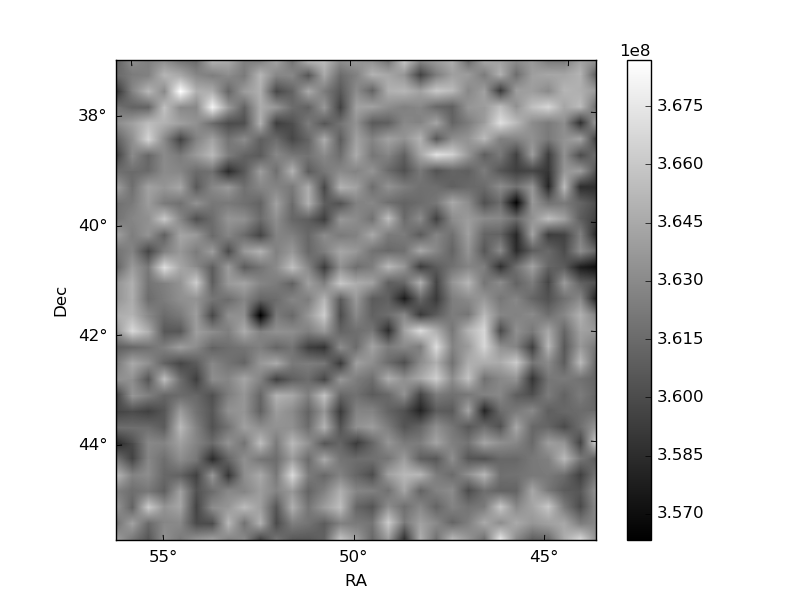
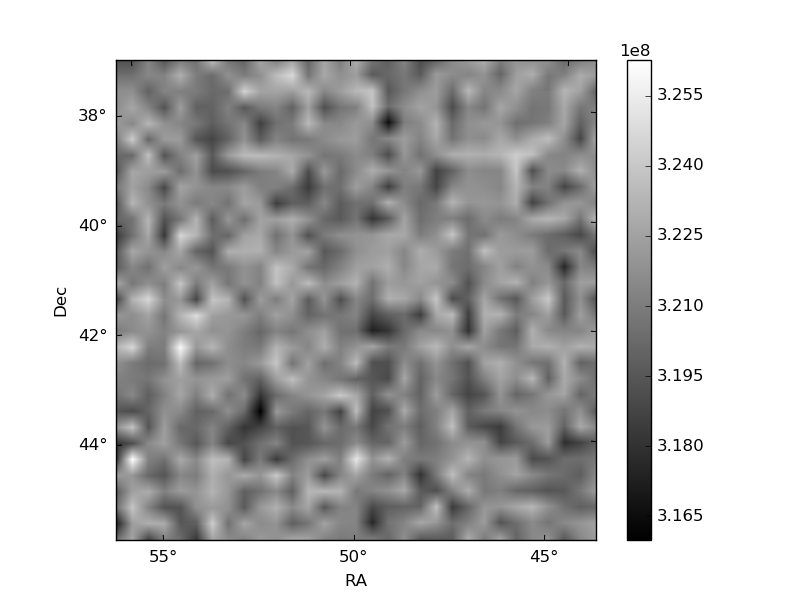
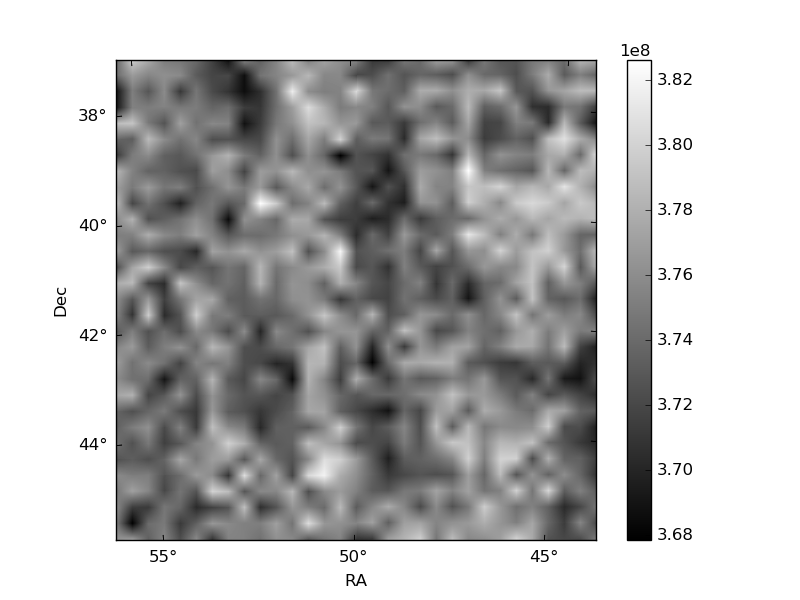
Histogram calculated using DETX and DETY for each event in the final _common_clean file
| Quadrant A | 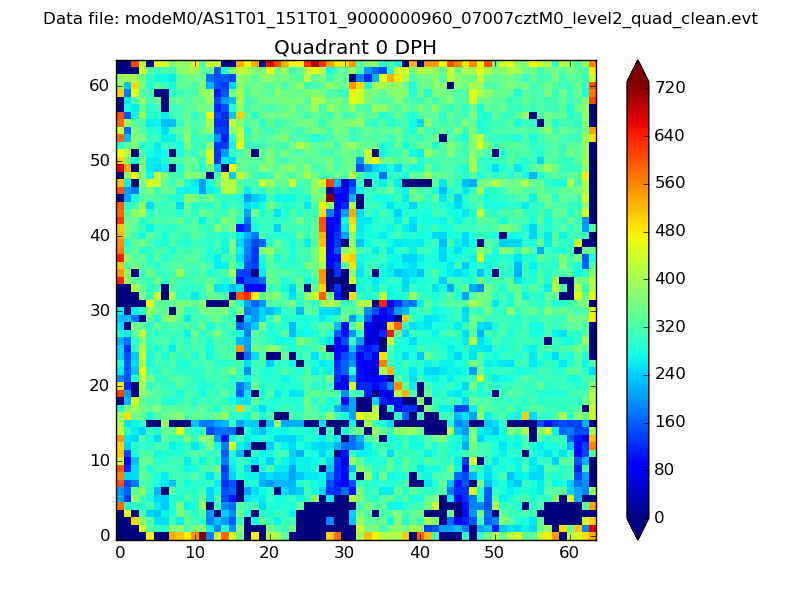 |
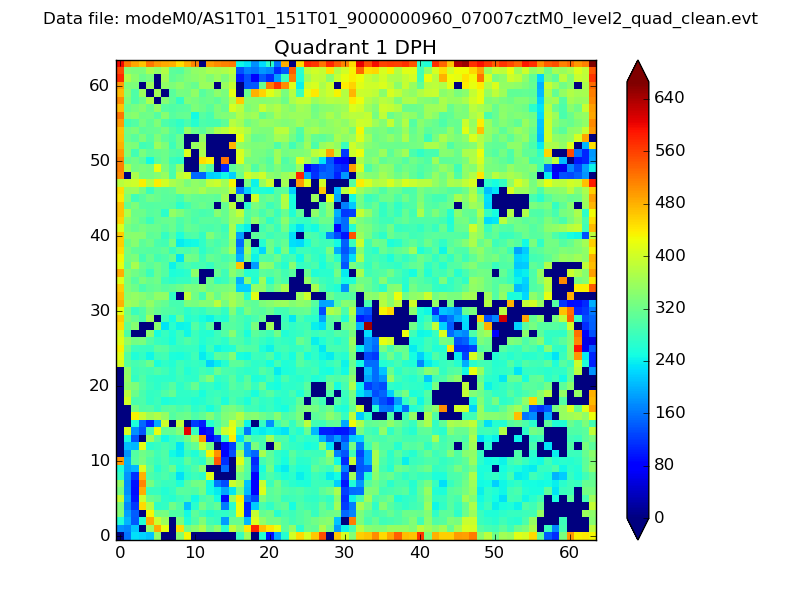 |
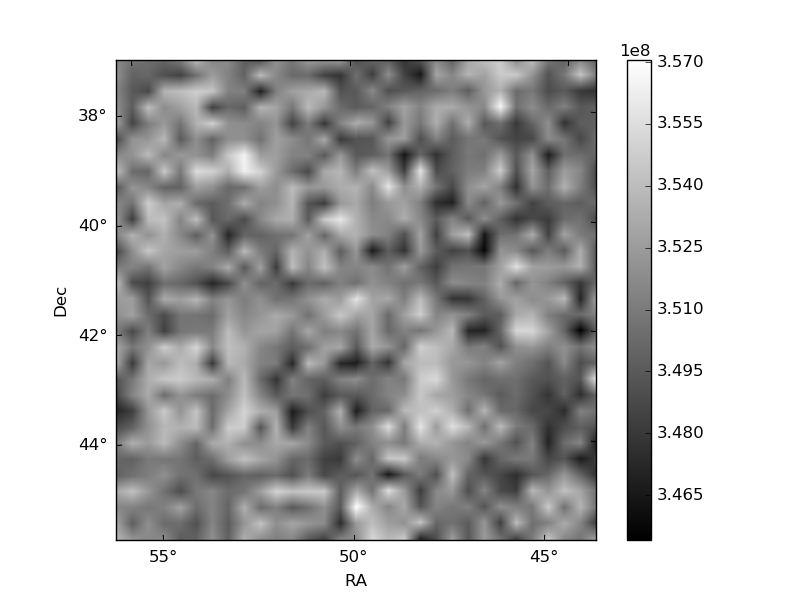
Quadrant B |
|---|---|---|---|
| Quadrant D | 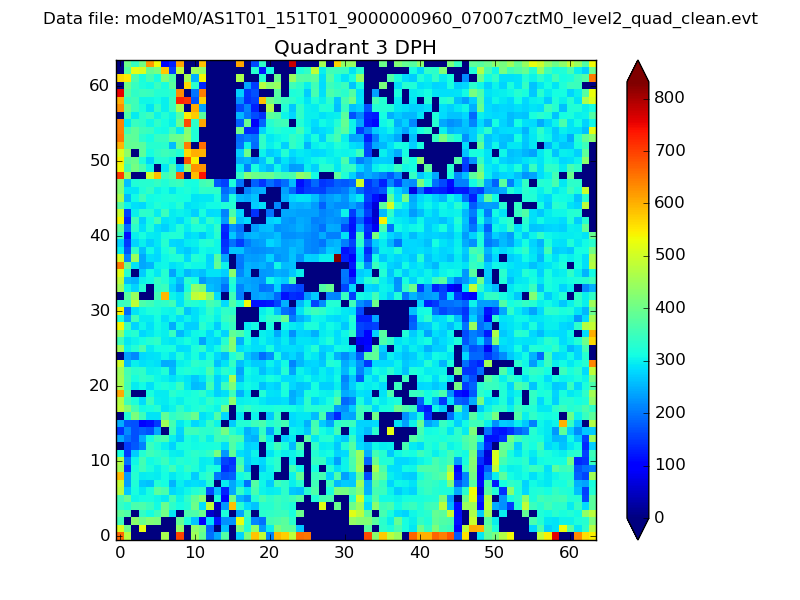 |
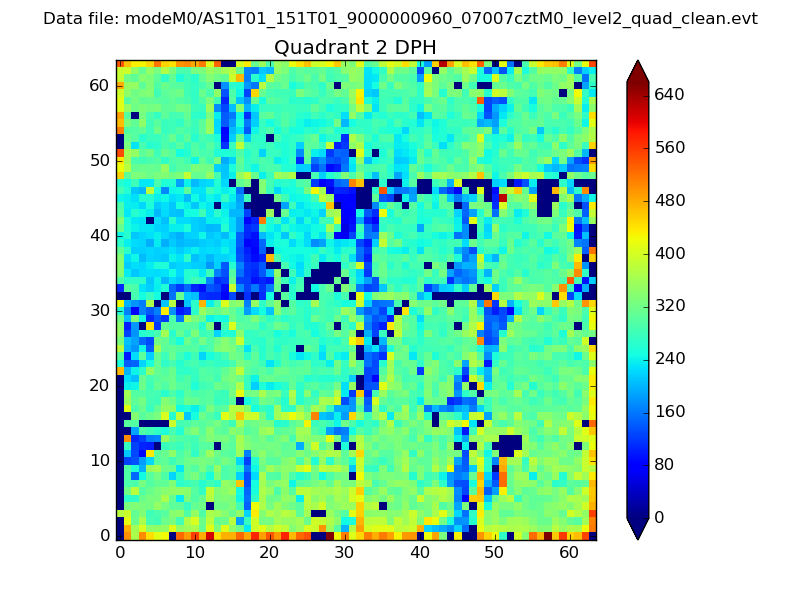 |
Quadrant C |
| Plot type | Count rate plots | Images |
|---|---|---|
| Comparison with Poisson distribution Blue bars denote a histogram of data divided into 1 sec bins. Red curve is a Poisson curve with rate = median count rate of data. |
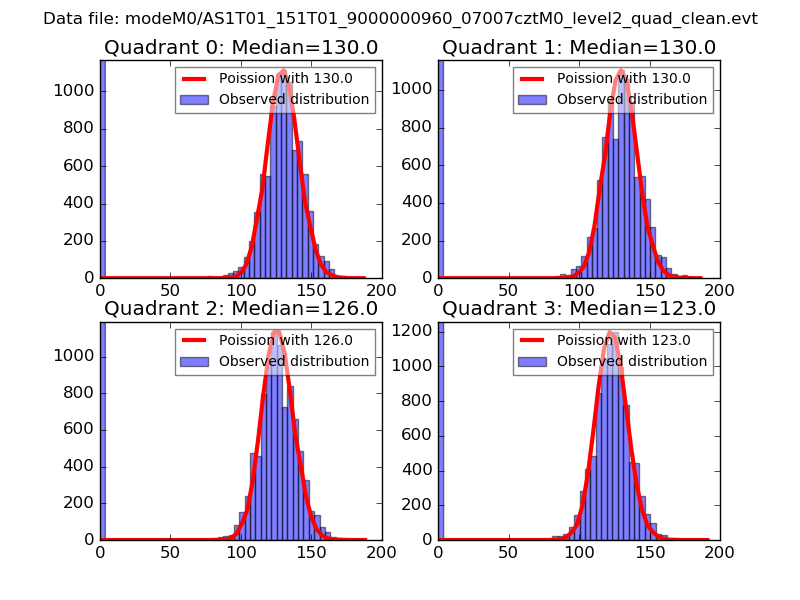 |
 |
| Quadrant-wise count rates Data is divided into 100 sec bins |
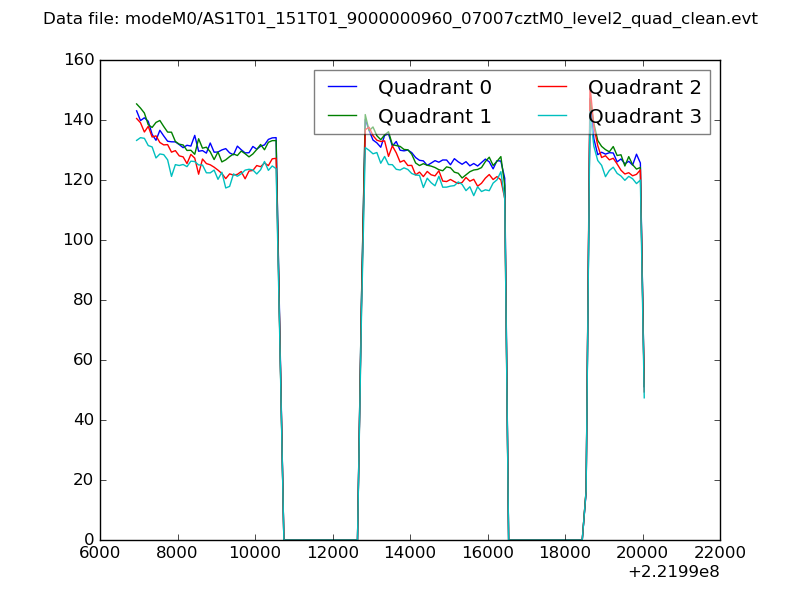 |
|
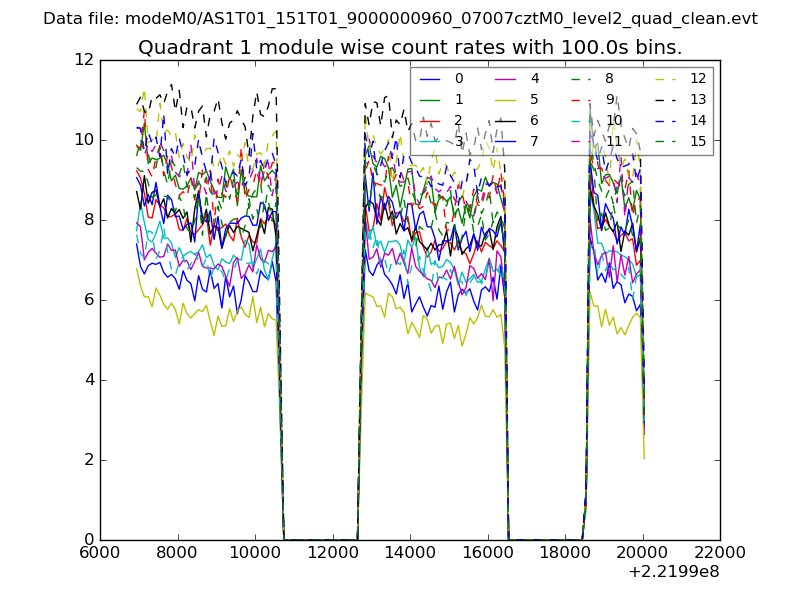
| Module-wise count rates for Quadrant A Data is divided into 100 sec bins |
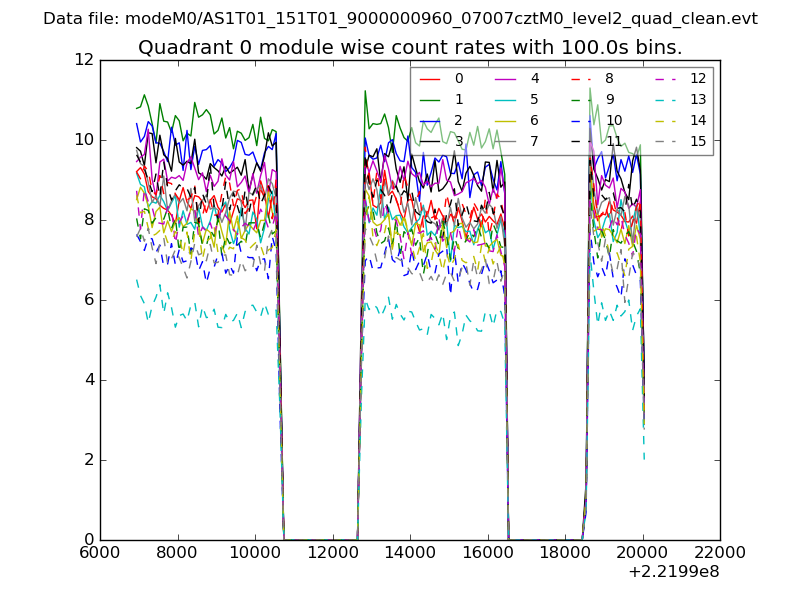 |
 |
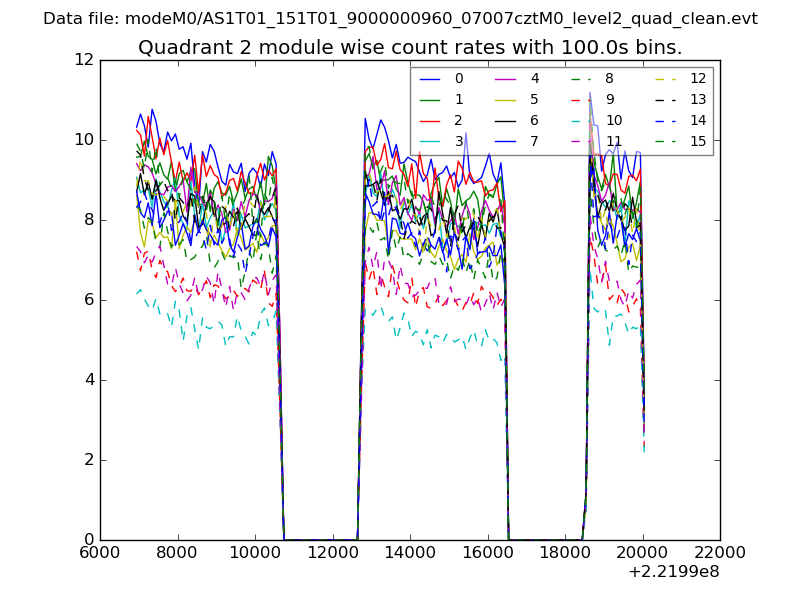
| Module-wise count rates for Quadrant B Data is divided into 100 sec bins |
 |
 |
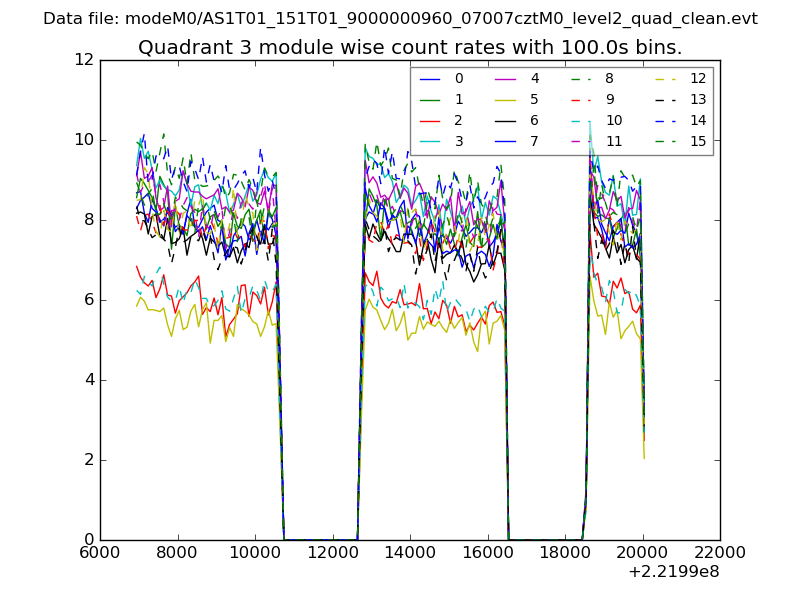
| Module-wise count rates for Quadrant C Data is divided into 100 sec bins |
 |
 |
| Module-wise count rates for Quadrant D Data is divided into 100 sec bins |
 |
 |
| Parameter | Plot |
|---|---|
| CZT HV Monitor | 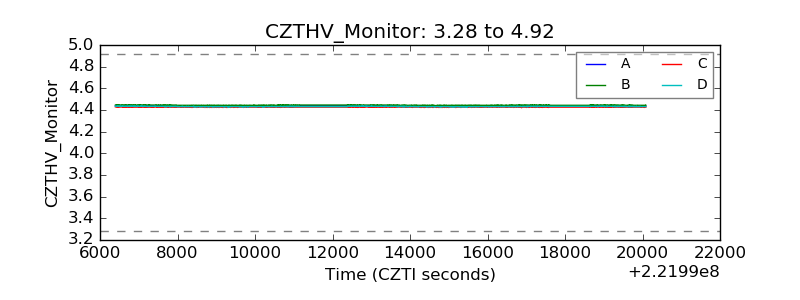 |
| D_VDD | 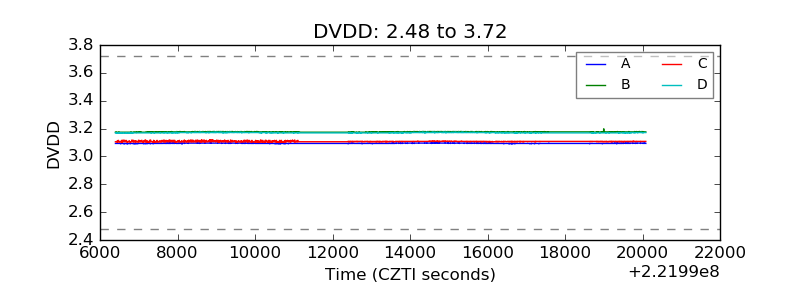 |
| Temperature 1 | 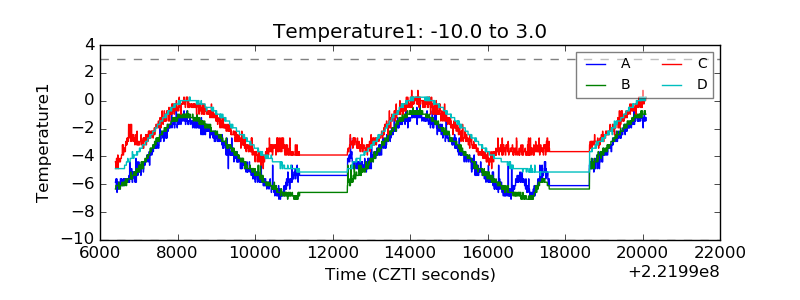 |
| Veto HV Monitor | 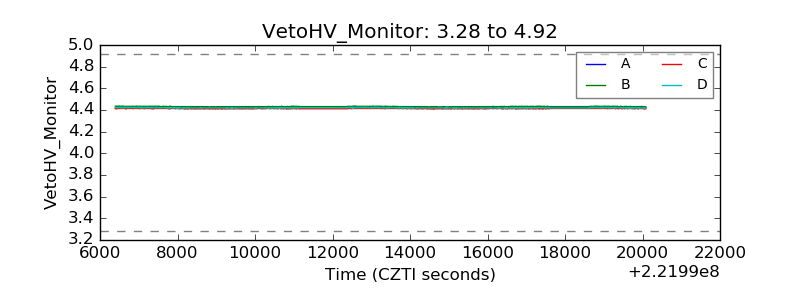 |
| Veto LLD | 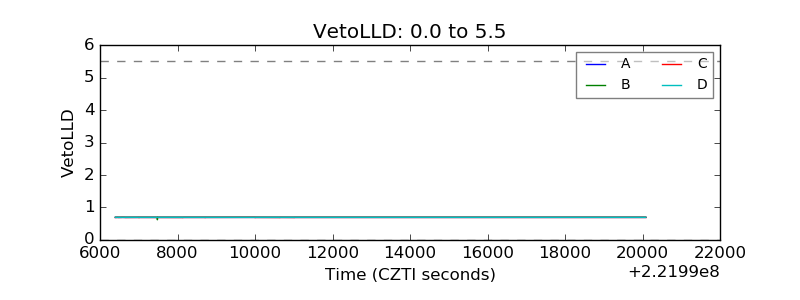 |
| Alpha Counter | 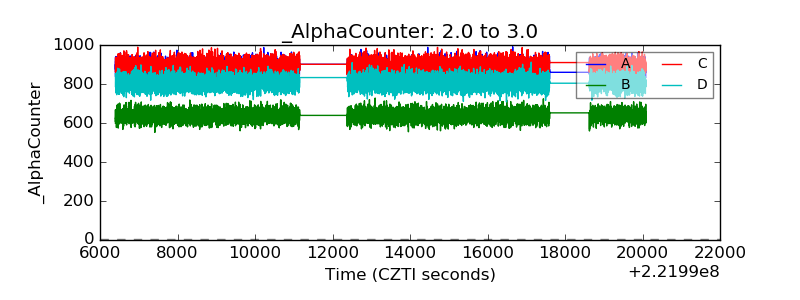 |
| _CPM_Rate | 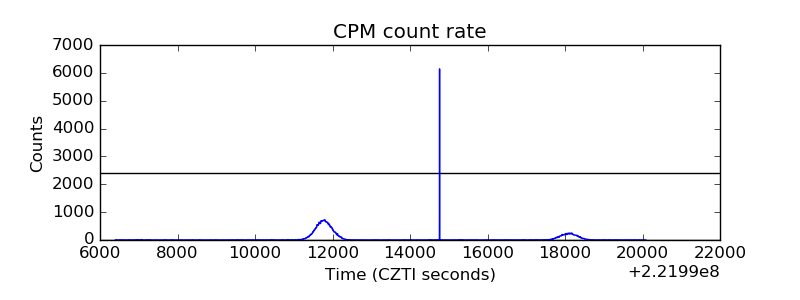 |
| CZT Counter | 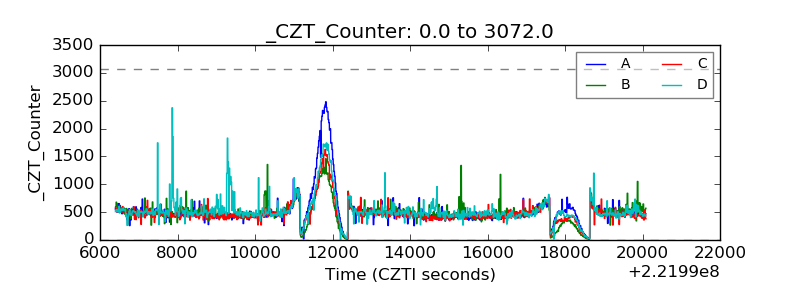 |
| +2.5 Volts monitor | 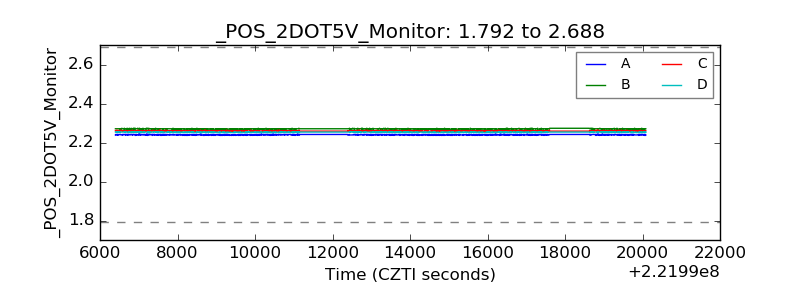 |
| +5 Volts monitor | 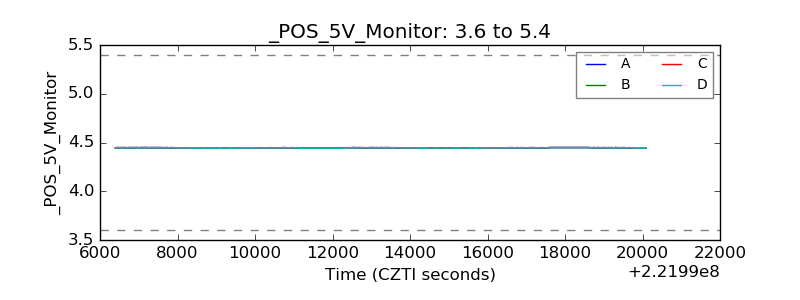 |
| _ROLL_ROT | 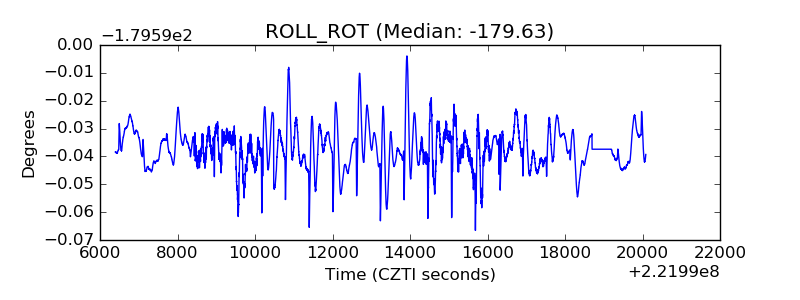 |
| _Roll_DEC | 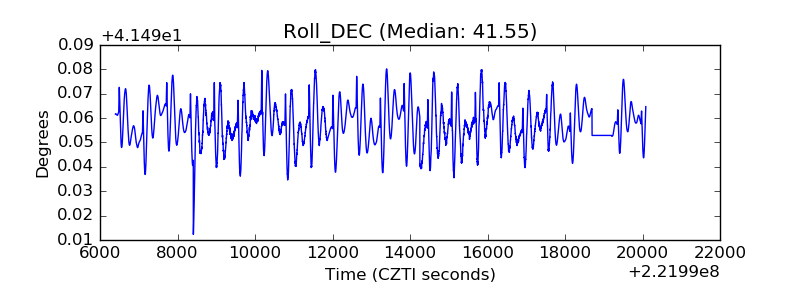 |
| _Roll_RA | 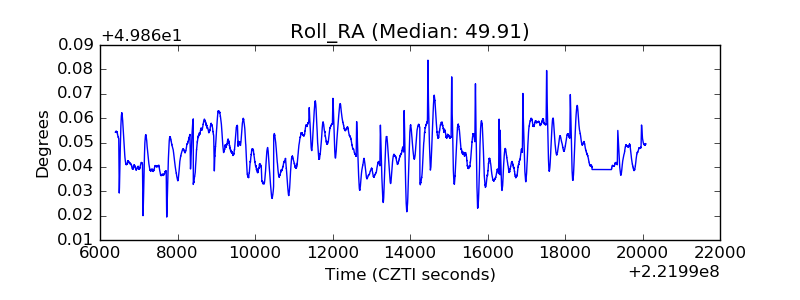 |
| Veto Counter | 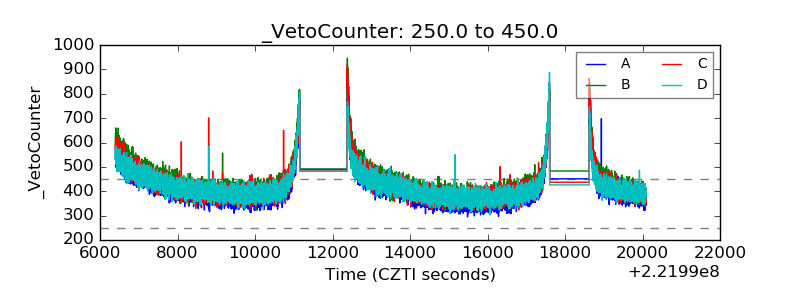 |