| Param | Original file | Final file |
|---|---|---|
| Filename | modeM0/AS1T01_151T01_9000000960_07008cztM0_level2.evt | modeM0/AS1T01_151T01_9000000960_07008cztM0_level2_quad_clean.evt |
| Size (bytes) | 472,610,880 | 93,545,280 |
| Size | 450.7 MB | 89.2 MB |
| Events in quadrant A | 3,067,917 | 606,584 |
| Events in quadrant B | 4,442,219 | 592,879 |
| Events in quadrant C | 2,981,138 | 592,193 |
| Events in quadrant D | 3,369,246 | 576,790 |
| Mode SS | |||
|---|---|---|---|
| Quadrant | BADHDUFLAG | Total packets | Discarded packets |
| A | 0 | 136 | 0 |
| B | 0 | 136 | 0 |
| C | 0 | 136 | 0 |
| D | 0 | 136 | 0 |
| Mode M9 | |||
|---|---|---|---|
| Quadrant | BADHDUFLAG | Total packets | Discarded packets |
| A | 0 | 7 | 0 |
| B | 0 | 7 | 0 |
| C | 0 | 7 | 0 |
| D | 0 | 7 | 0 |
| Mode M0 | |||
|---|---|---|---|
| Quadrant | BADHDUFLAG | Total packets | Discarded packets |
| A | 0 | 13695 | 2 |
| B | 0 | 17498 | 1 |
| C | 0 | 13587 | 1 |
| D | 0 | 14472 | 1 |
| Quadrant | Total seconds | Saturated seconds | Saturation percentage |
|---|---|---|---|
| A | 6658 | 92 | 1.381796% |
| B | 6658 | 313 | 4.701111% |
| C | 6658 | 37 | 0.555722% |
| D | 6658 | 91 | 1.366777% |
Noise dominated data is calculated using 1-second bins in cleaned event files. If a bin has >2000 counts, and if more than 50% of those come from <1% of pixels, then it is considered to be noise-dominated and hence unusable.
| Quadrant | # 1 sec bins | Bins with >0 counts | Bins with >2000 counts | High rate bins dominated by noise | Noise dominated (total time) | Noise dominated (detector-on time) | Marked lightcurve |
|---|---|---|---|---|---|---|---|
| A | 7413 | 6659 | 0 | 0 | 0.00% | 0.00% | 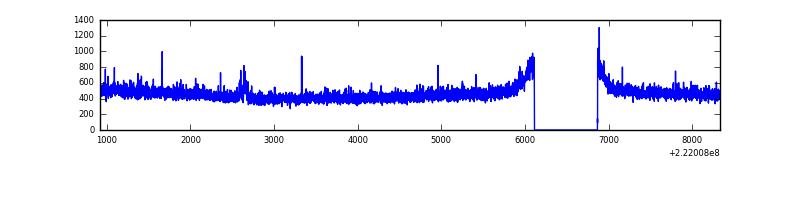 |
| B | 7413 | 6659 | 268 | 268 | 3.62% | 4.02% | 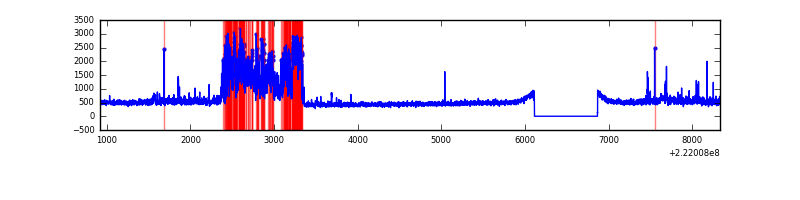 |
| C | 7413 | 6659 | 0 | 0 | 0.00% | 0.00% | 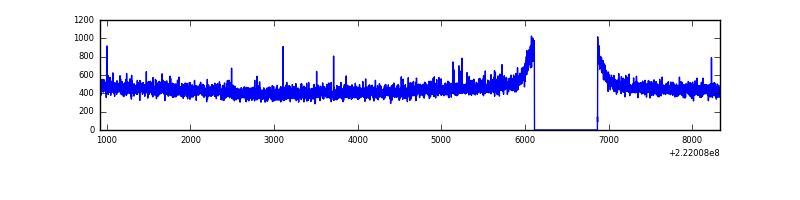 |
| D | 7413 | 6659 | 23 | 23 | 0.31% | 0.35% | 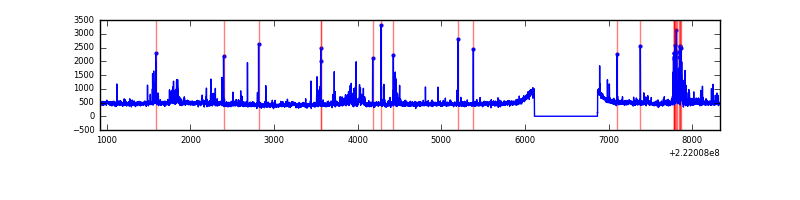 |
Top three noisy pixels from each quadrant. If the there are fewer than three noisy pixels in the level2.evt file, extra rows are filled as -1
| Pixel properties | Quadrant properties | ||||||
|---|---|---|---|---|---|---|---|
| Quadrant | DetID | PixID | Counts | Sigma | Mean | Median | Sigma |
| A | 15 | 234 | 19599 | 117.19 | 787 | 767 | 160.7 |
| A | 13 | 248 | 11173 | 64.76 | 787 | 767 | 160.7 |
| A | 0 | 226 | 7709 | 43.2 | 787 | 767 | 160.7 |
| B | 4 | 239 | 1149922 | 7693.94 | 778 | 761 | 149.4 |
| B | 0 | 214 | 181217 | 1208.2 | 778 | 761 | 149.4 |
| B | 4 | 81 | 24782 | 160.83 | 778 | 761 | 149.4 |
| C | 1 | 16 | 13040 | 69.45 | 758 | 761 | 176.8 |
| C | 10 | 22 | 6178 | 30.64 | 758 | 761 | 176.8 |
| C | 13 | 61 | 6052 | 29.93 | 758 | 761 | 176.8 |
| D | 14 | 34 | 168804 | 881.53 | 769 | 744 | 190.6 |
| D | 8 | 195 | 133097 | 694.23 | 769 | 744 | 190.6 |
| D | 2 | 136 | 50911 | 263.14 | 769 | 744 | 190.6 |
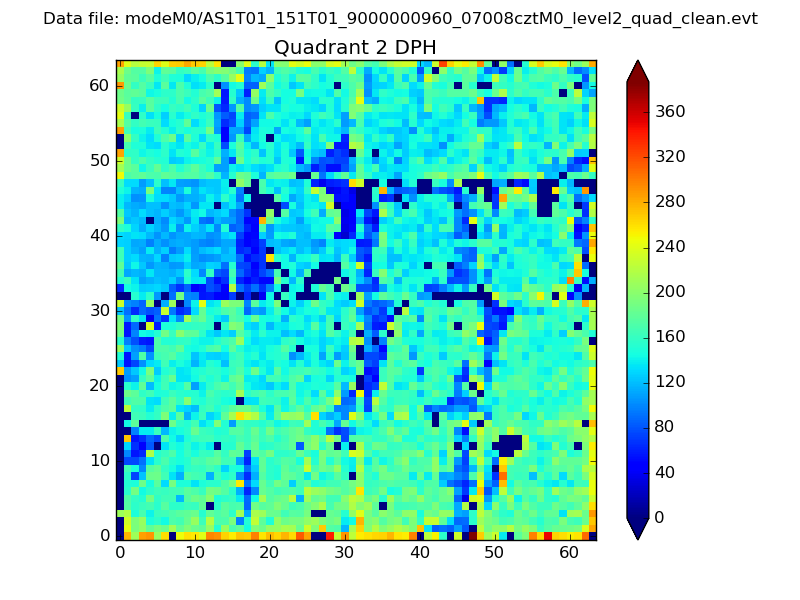
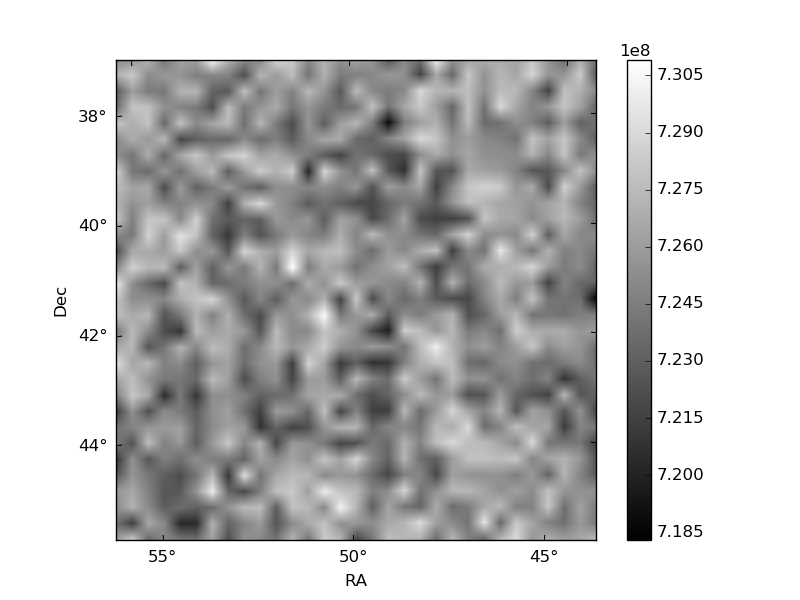
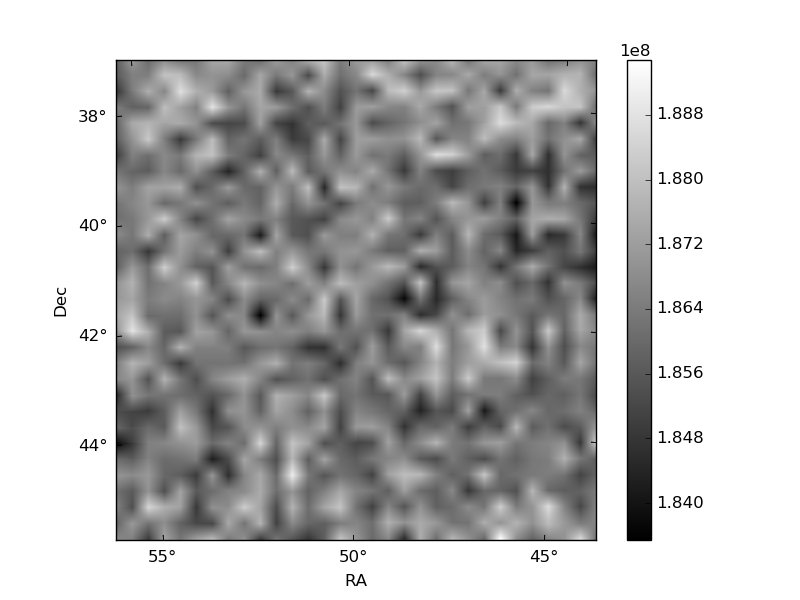
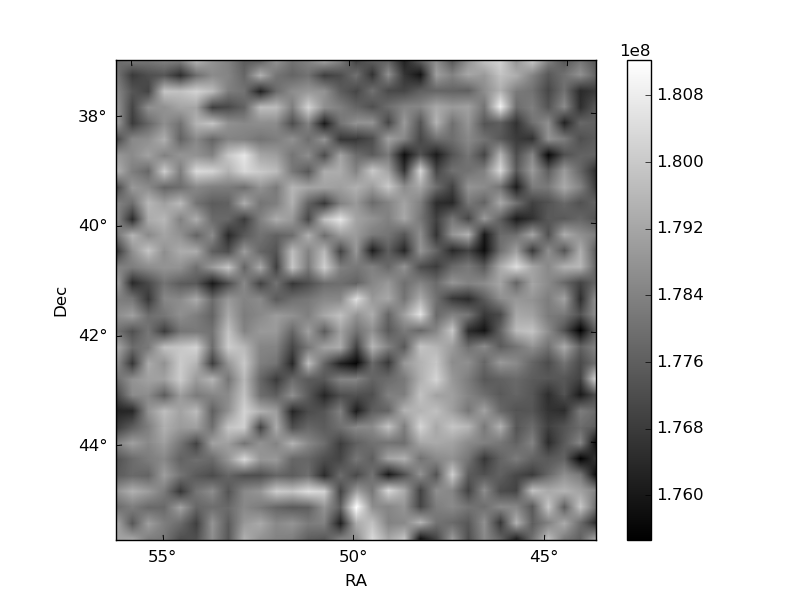
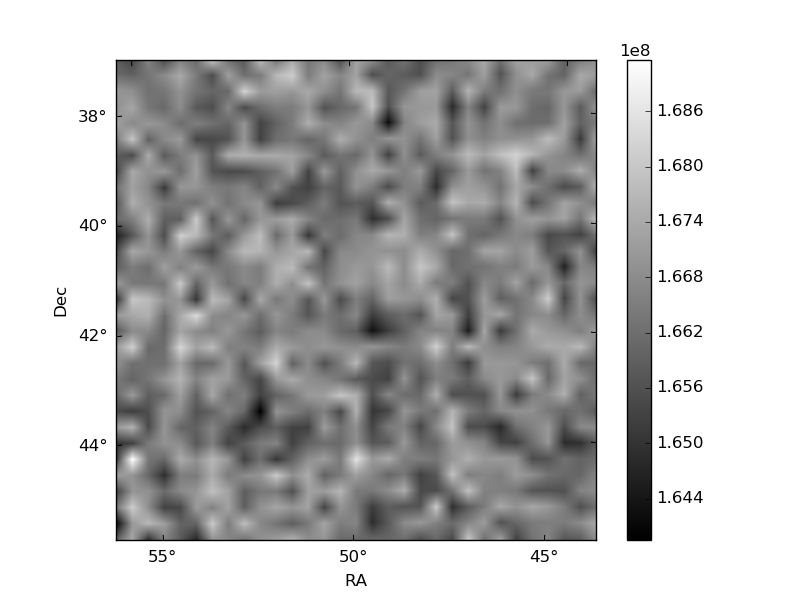
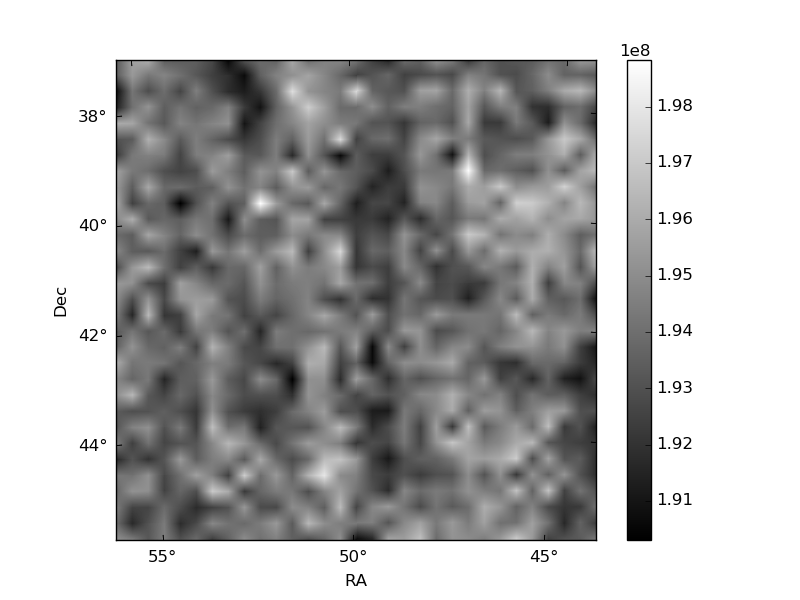
Histogram calculated using DETX and DETY for each event in the final _common_clean file
| Quadrant A | 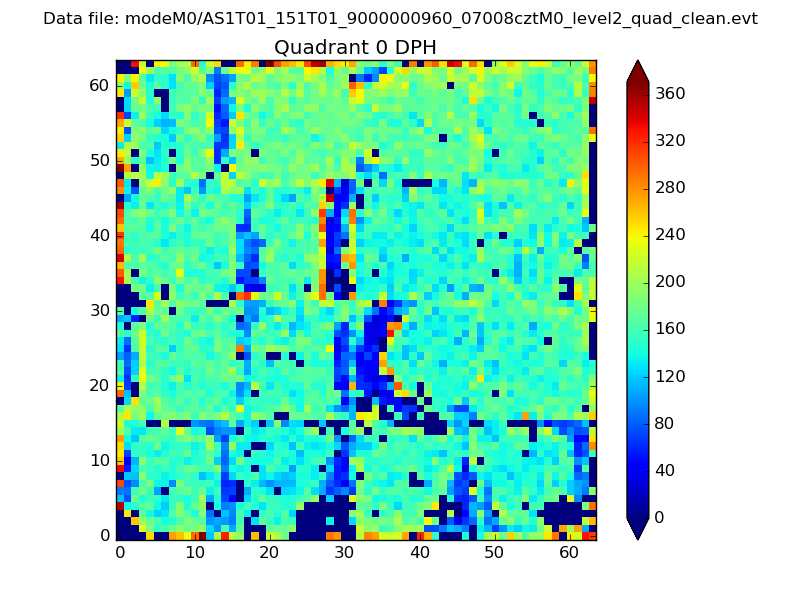 |
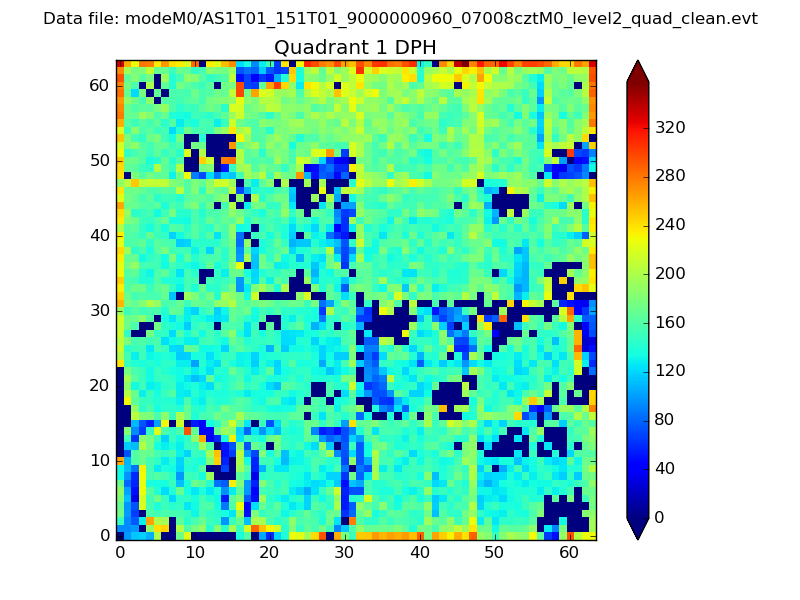 |
Quadrant B |
|---|---|---|---|
| Quadrant D | 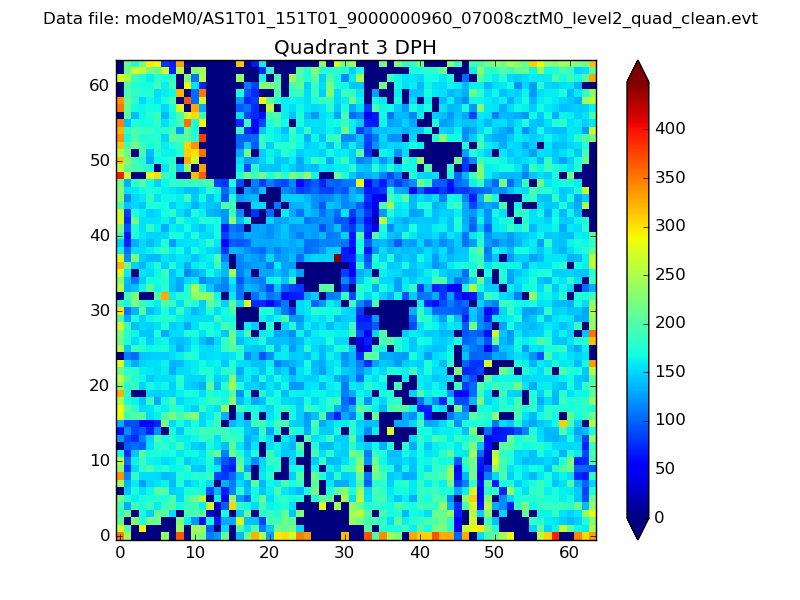 |
 |
Quadrant C |
| Plot type | Count rate plots | Images |
|---|---|---|
| Comparison with Poisson distribution Blue bars denote a histogram of data divided into 1 sec bins. Red curve is a Poisson curve with rate = median count rate of data. |
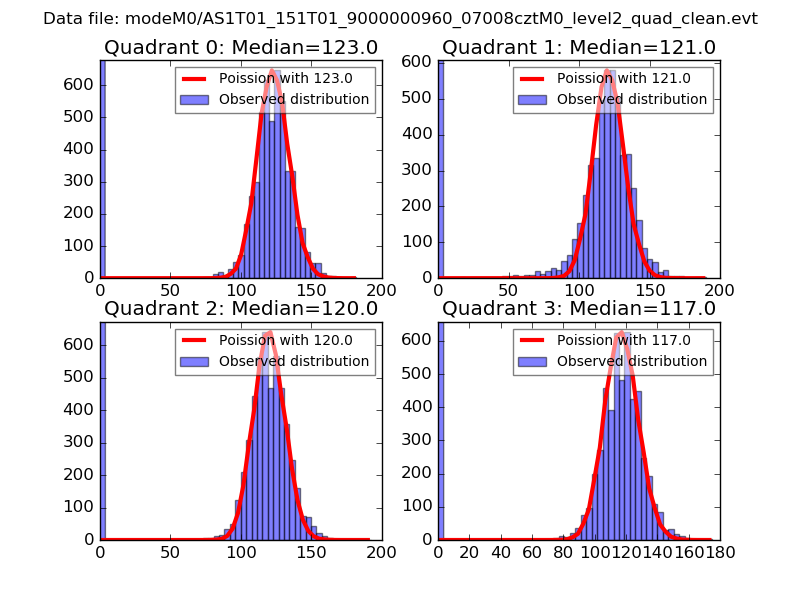 |
 |
| Quadrant-wise count rates Data is divided into 100 sec bins |
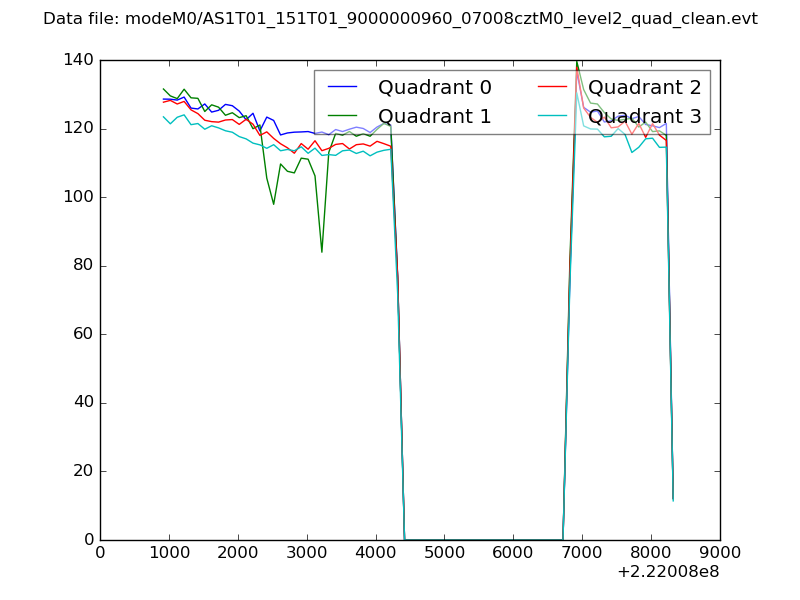 |
|
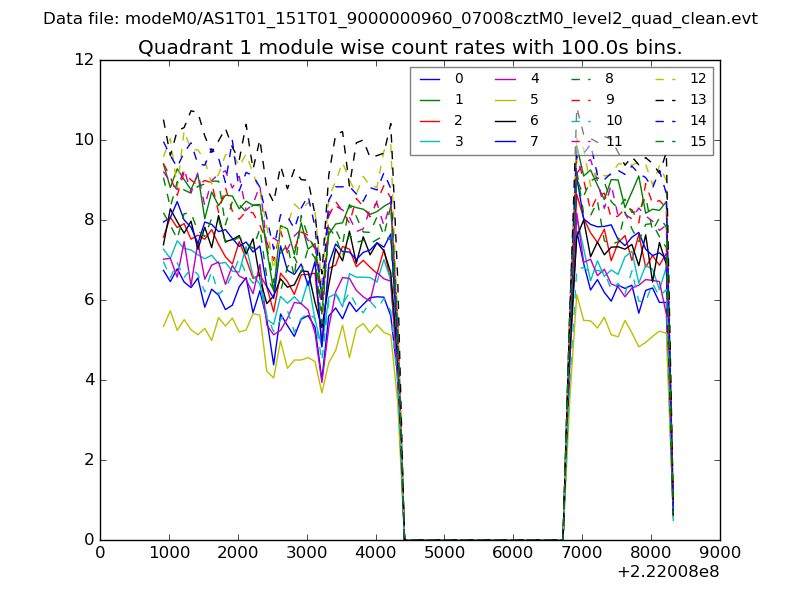
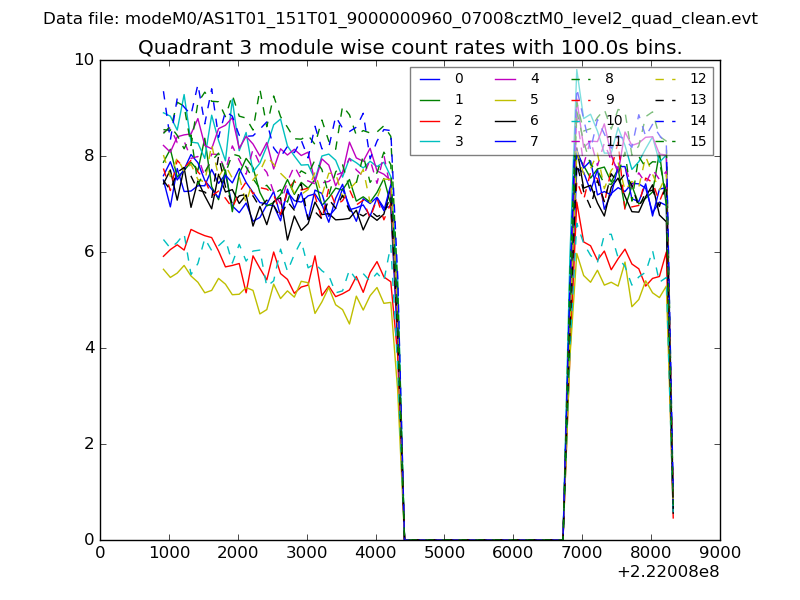
| Module-wise count rates for Quadrant A Data is divided into 100 sec bins |
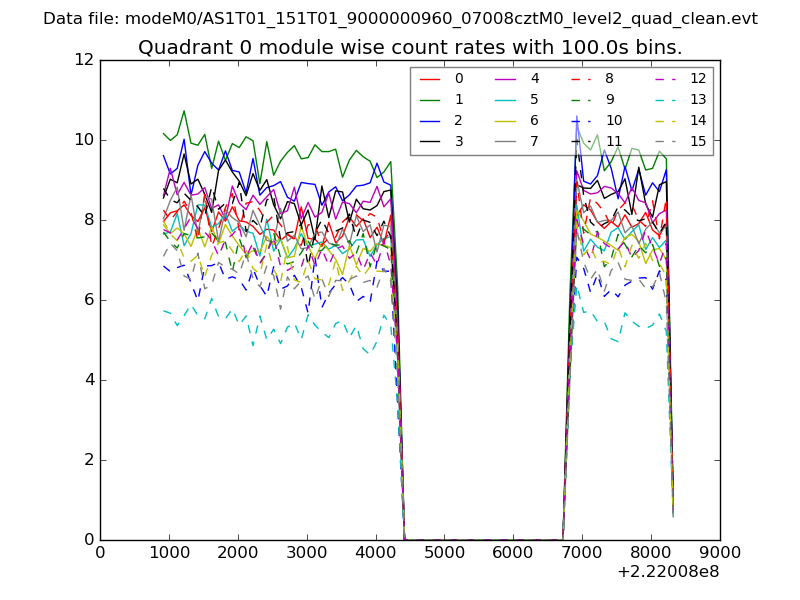 |
 |
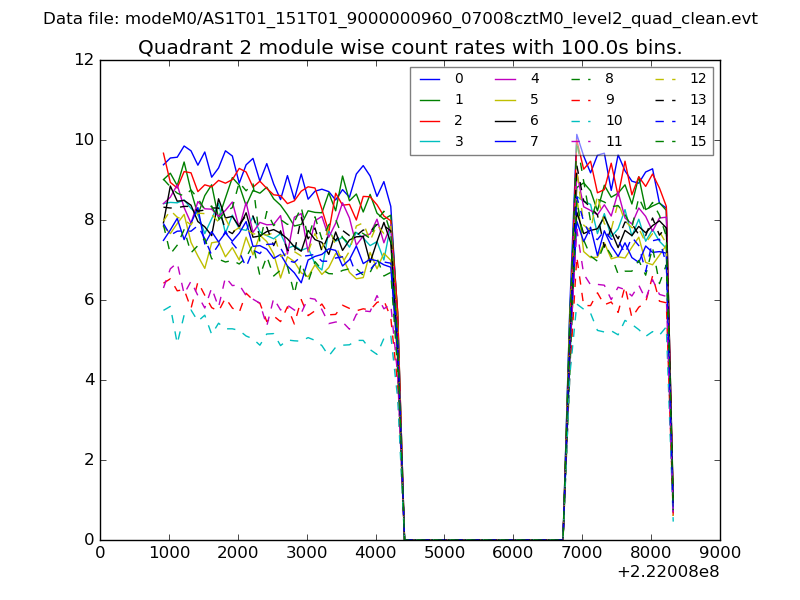
| Module-wise count rates for Quadrant B Data is divided into 100 sec bins |
 |
 |
| Module-wise count rates for Quadrant C Data is divided into 100 sec bins |
 |
 |
| Module-wise count rates for Quadrant D Data is divided into 100 sec bins |
 |
 |
| Parameter | Plot |
|---|---|
| CZT HV Monitor | 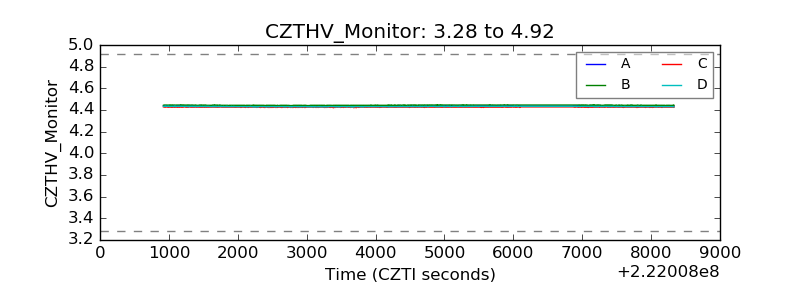 |
| D_VDD | 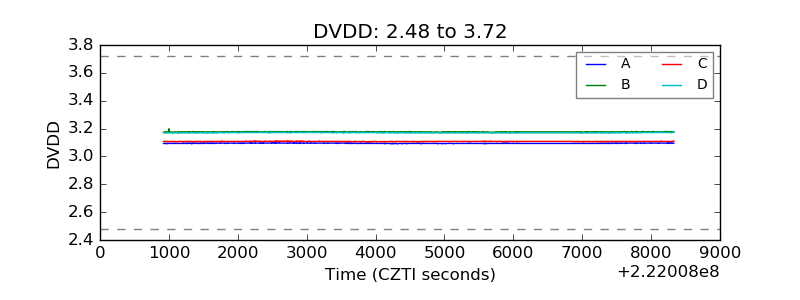 |
| Temperature 1 | 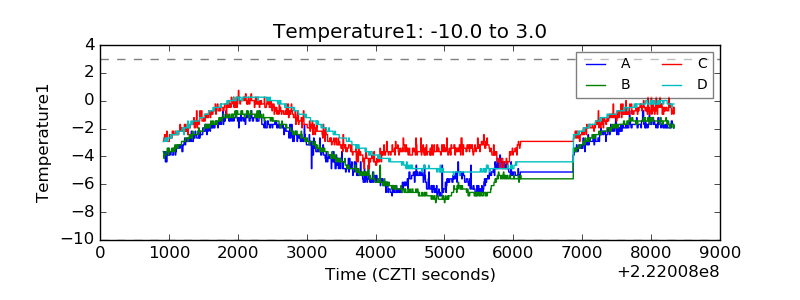 |
| Veto HV Monitor | 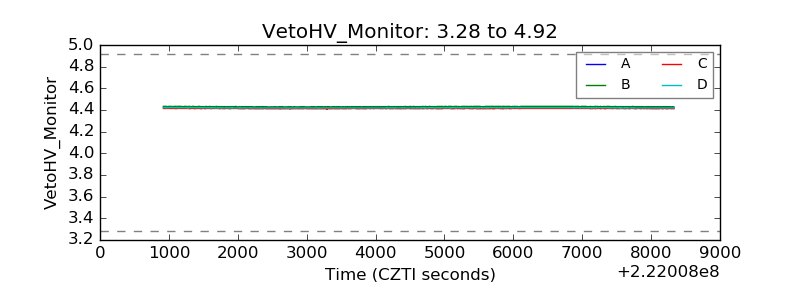 |
| Veto LLD | 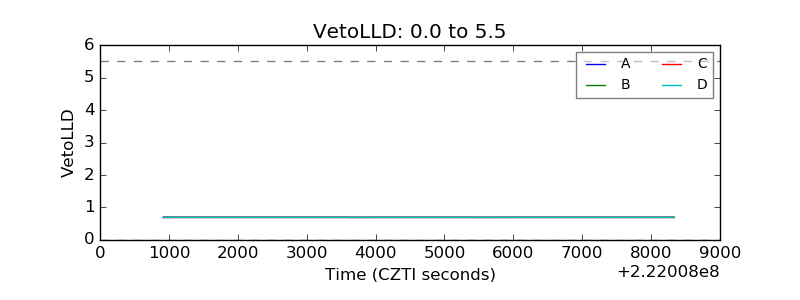 |
| Alpha Counter | 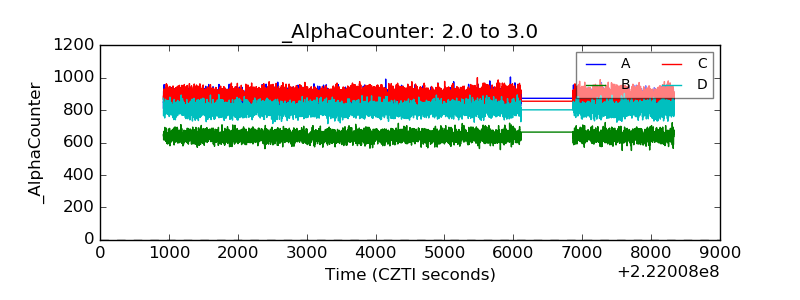 |
| _CPM_Rate | 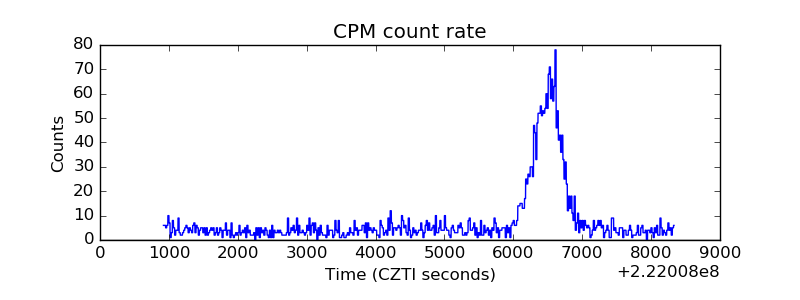 |
| CZT Counter | 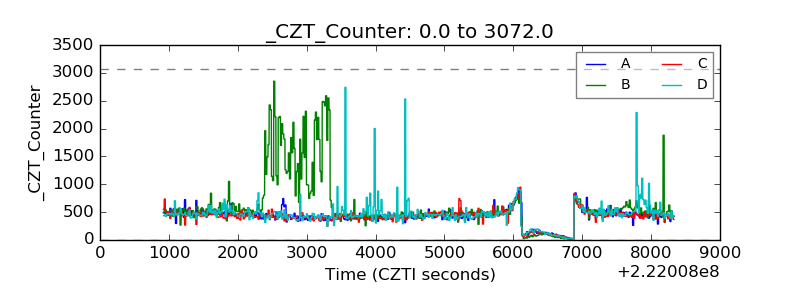 |
| +2.5 Volts monitor | 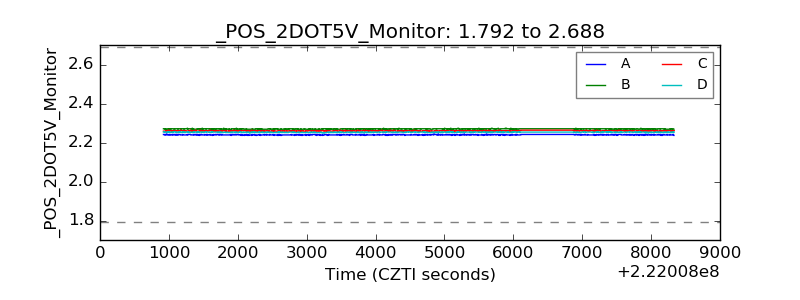 |
| +5 Volts monitor | 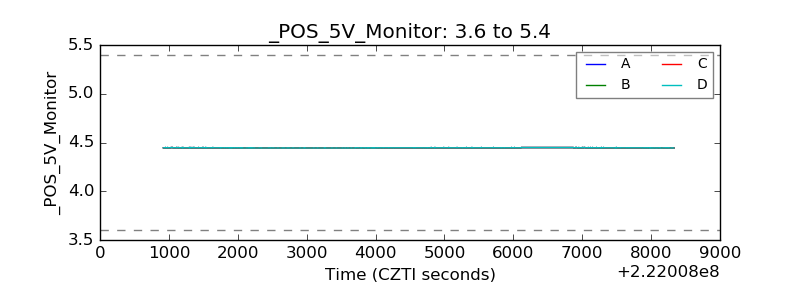 |
| _ROLL_ROT | 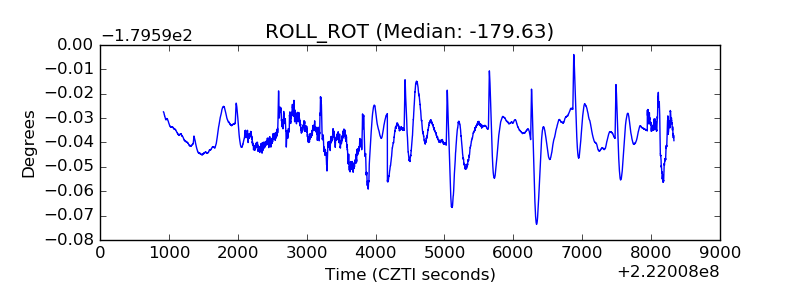 |
| _Roll_DEC | 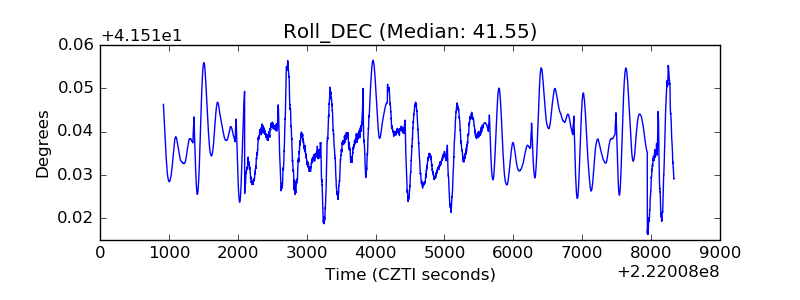 |
| _Roll_RA | 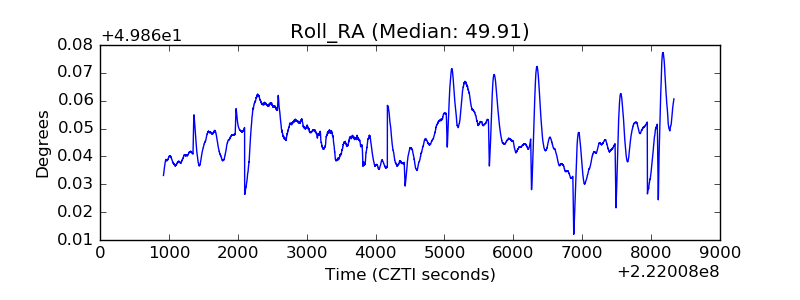 |
| Veto Counter | 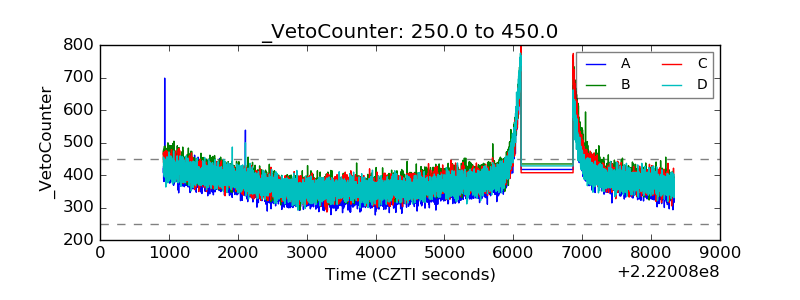 |