| Param | Original file | Final file |
|---|---|---|
| Filename | modeM0/AS1T01_151T01_9000000960_07010cztM0_level2.evt | modeM0/AS1T01_151T01_9000000960_07010cztM0_level2_quad_clean.evt |
| Size (bytes) | 494,654,400 | 91,474,560 |
| Size | 471.7 MB | 87.2 MB |
| Events in quadrant A | 3,227,940 | 589,772 |
| Events in quadrant B | 3,483,626 | 590,218 |
| Events in quadrant C | 3,139,943 | 577,657 |
| Events in quadrant D | 4,658,096 | 529,315 |
| Mode SS | |||
|---|---|---|---|
| Quadrant | BADHDUFLAG | Total packets | Discarded packets |
| A | 0 | 142 | 0 |
| B | 0 | 142 | 0 |
| C | 0 | 142 | 0 |
| D | 0 | 142 | 0 |
| Mode M9 | |||
|---|---|---|---|
| Quadrant | BADHDUFLAG | Total packets | Discarded packets |
| A | 0 | 3 | 0 |
| B | 0 | 3 | 0 |
| C | 0 | 3 | 0 |
| D | 0 | 3 | 0 |
| Mode M0 | |||
|---|---|---|---|
| Quadrant | BADHDUFLAG | Total packets | Discarded packets |
| A | 0 | 14415 | 1 |
| B | 0 | 14942 | 1 |
| C | 0 | 14273 | 1 |
| D | 0 | 18609 | 1 |
| Quadrant | Total seconds | Saturated seconds | Saturation percentage |
|---|---|---|---|
| A | 6930 | 72 | 1.038961% |
| B | 6930 | 90 | 1.298701% |
| C | 6930 | 30 | 0.432900% |
| D | 6930 | 474 | 6.839827% |
Noise dominated data is calculated using 1-second bins in cleaned event files. If a bin has >2000 counts, and if more than 50% of those come from <1% of pixels, then it is considered to be noise-dominated and hence unusable.
| Quadrant | # 1 sec bins | Bins with >0 counts | Bins with >2000 counts | High rate bins dominated by noise | Noise dominated (total time) | Noise dominated (detector-on time) | Marked lightcurve |
|---|---|---|---|---|---|---|---|
| A | 7280 | 6931 | 0 | 0 | 0.00% | 0.00% | 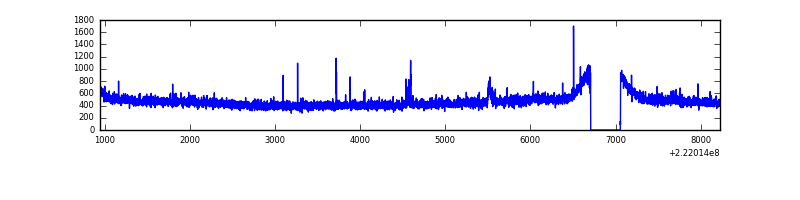 |
| B | 7280 | 6931 | 2 | 2 | 0.03% | 0.03% | 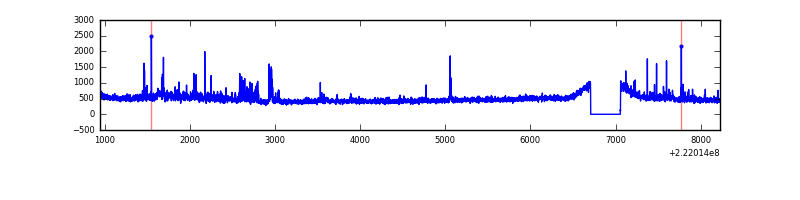 |
| C | 7280 | 6931 | 0 | 0 | 0.00% | 0.00% | 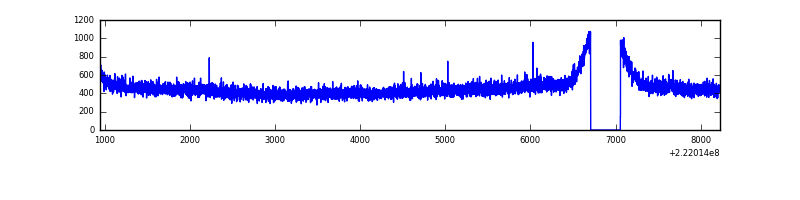 |
| D | 7280 | 6931 | 417 | 417 | 5.73% | 6.02% | 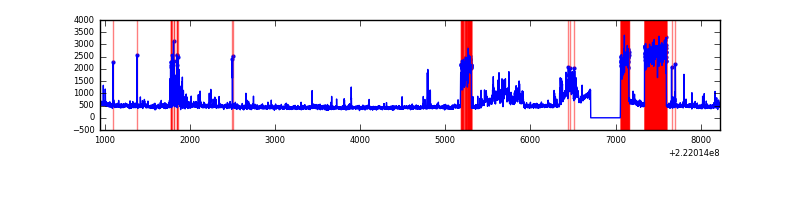 |
Top three noisy pixels from each quadrant. If the there are fewer than three noisy pixels in the level2.evt file, extra rows are filled as -1
| Pixel properties | Quadrant properties | ||||||
|---|---|---|---|---|---|---|---|
| Quadrant | DetID | PixID | Counts | Sigma | Mean | Median | Sigma |
| A | 4 | 2 | 18964 | 106.82 | 826 | 808 | 170.0 |
| A | 15 | 234 | 16779 | 93.97 | 826 | 808 | 170.0 |
| A | 13 | 14 | 8822 | 47.15 | 826 | 808 | 170.0 |
| B | 0 | 214 | 134893 | 837.02 | 827 | 808 | 160.2 |
| B | 4 | 239 | 60567 | 373.04 | 827 | 808 | 160.2 |
| B | 0 | 228 | 23892 | 144.1 | 827 | 808 | 160.2 |
| C | 1 | 16 | 13636 | 68.99 | 798 | 801 | 186.0 |
| C | 13 | 61 | 6276 | 29.43 | 798 | 801 | 186.0 |
| C | 8 | 128 | 3836 | 16.31 | 798 | 801 | 186.0 |
| D | 1 | 239 | 1340585 | 7001.85 | 773 | 747 | 191.4 |
| D | 8 | 195 | 179588 | 934.6 | 773 | 747 | 191.4 |
| D | 14 | 34 | 98135 | 508.94 | 773 | 747 | 191.4 |
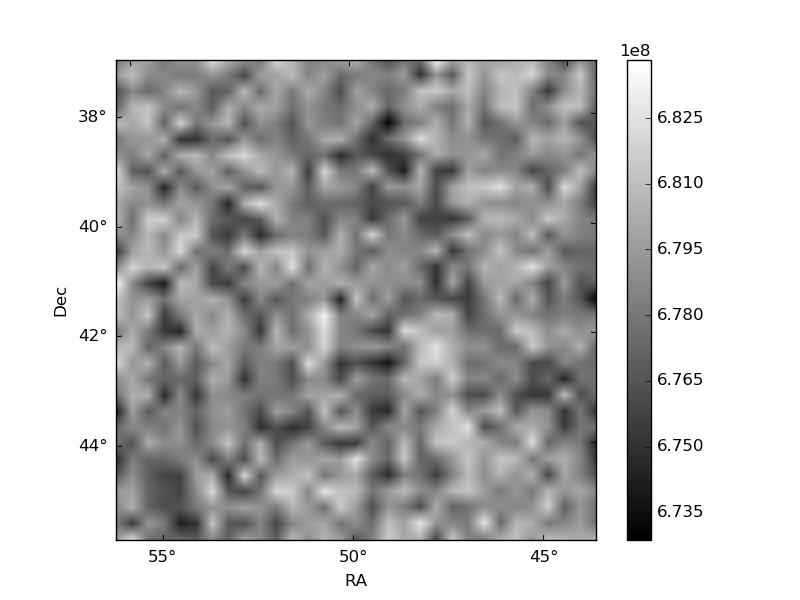
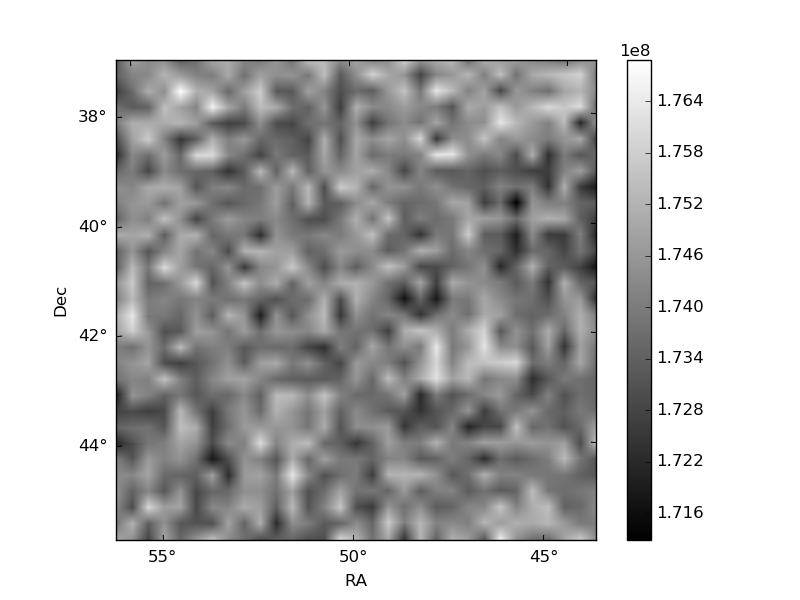
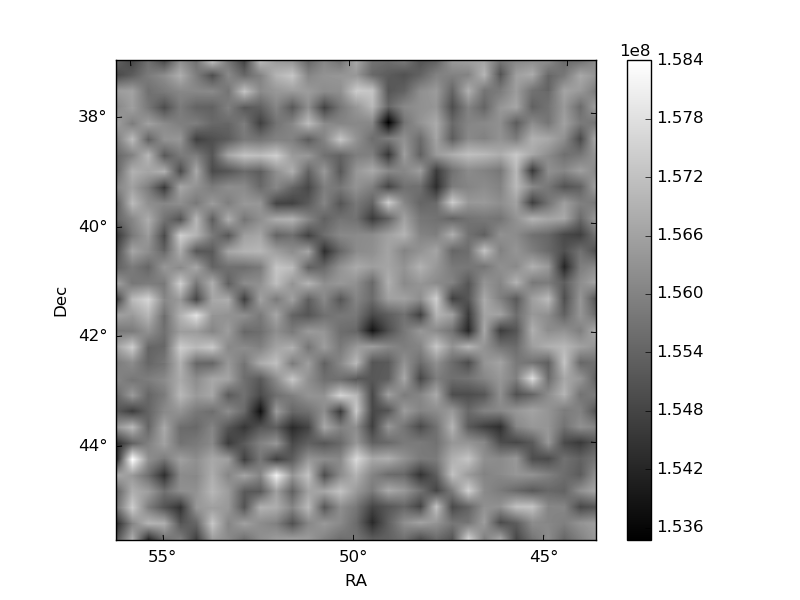
Histogram calculated using DETX and DETY for each event in the final _common_clean file
| Quadrant A | 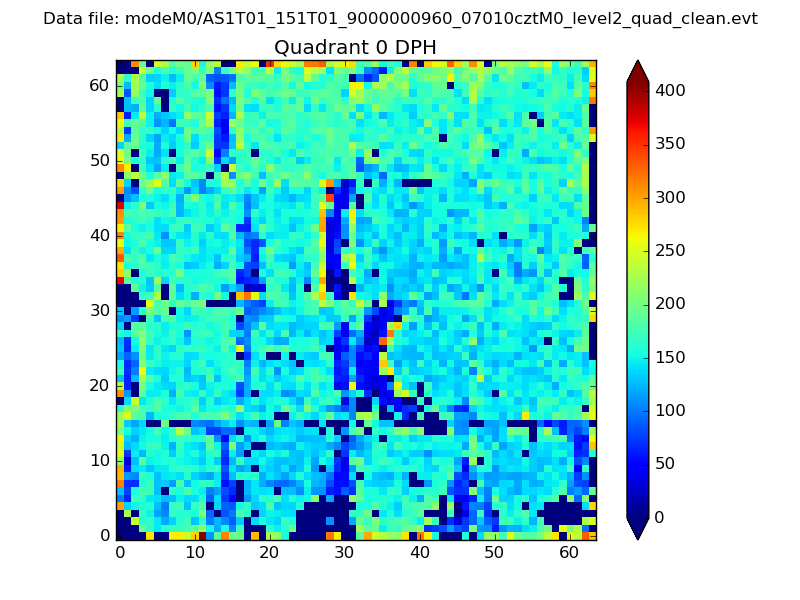 |
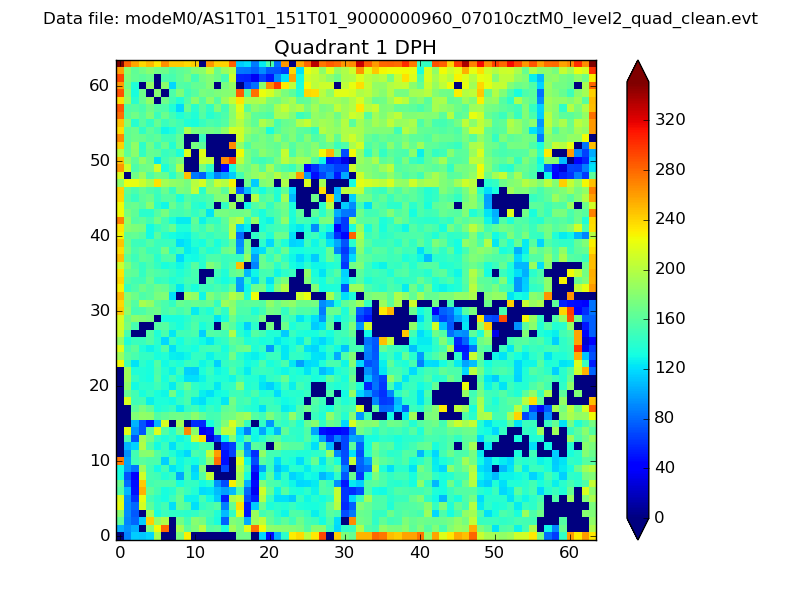 |
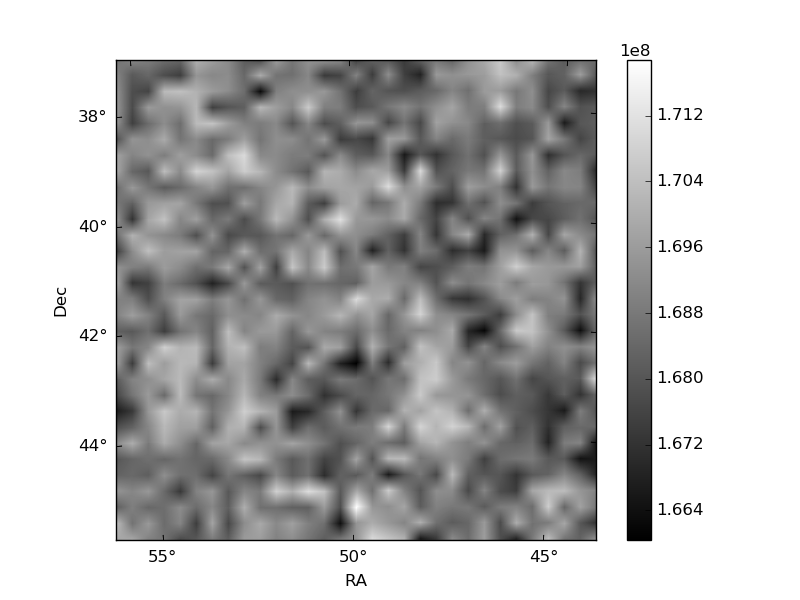
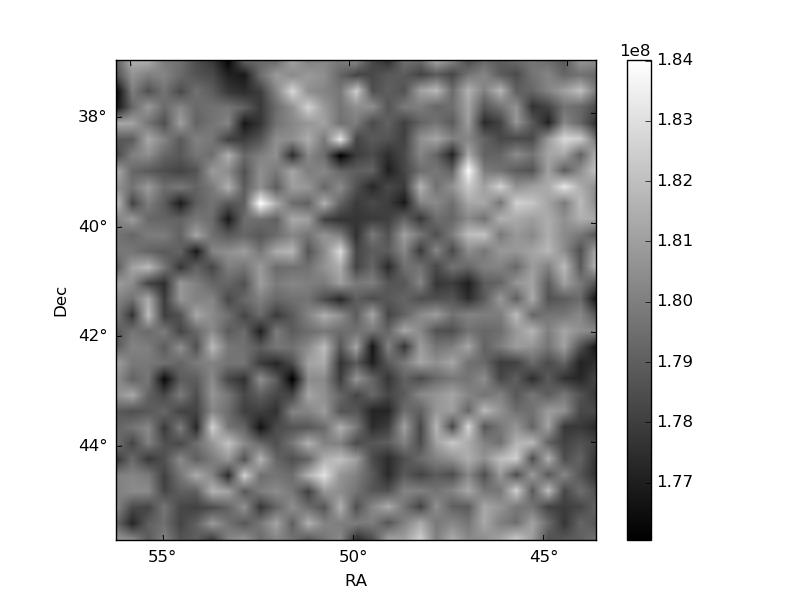
Quadrant B |
|---|---|---|---|
| Quadrant D | 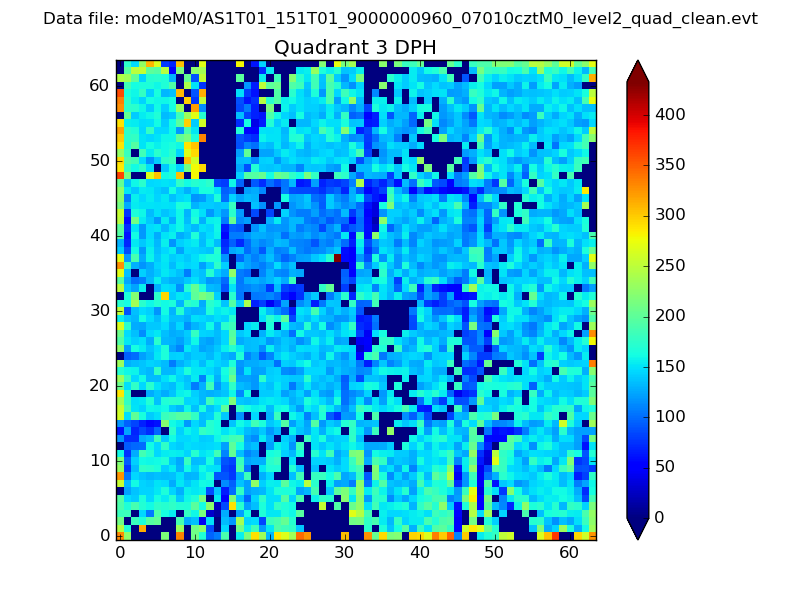 |
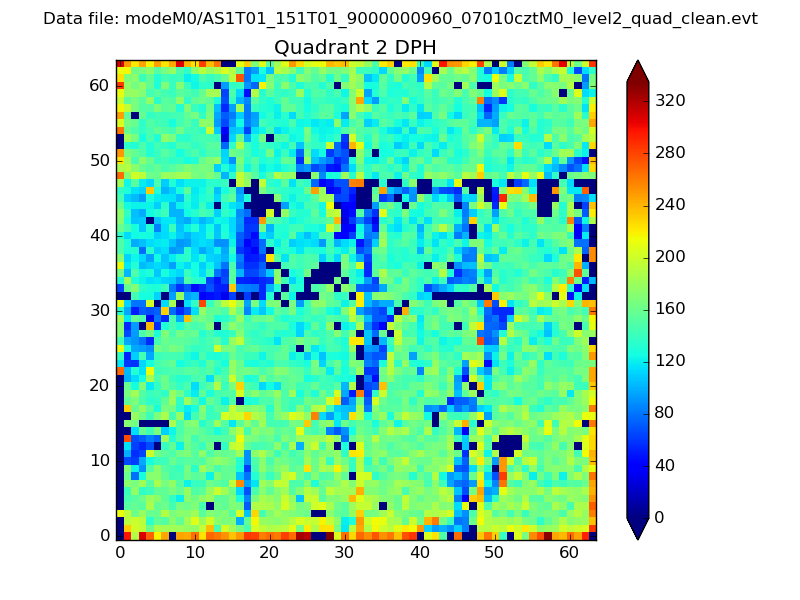 |
Quadrant C |
| Plot type | Count rate plots | Images |
|---|---|---|
| Comparison with Poisson distribution Blue bars denote a histogram of data divided into 1 sec bins. Red curve is a Poisson curve with rate = median count rate of data. |
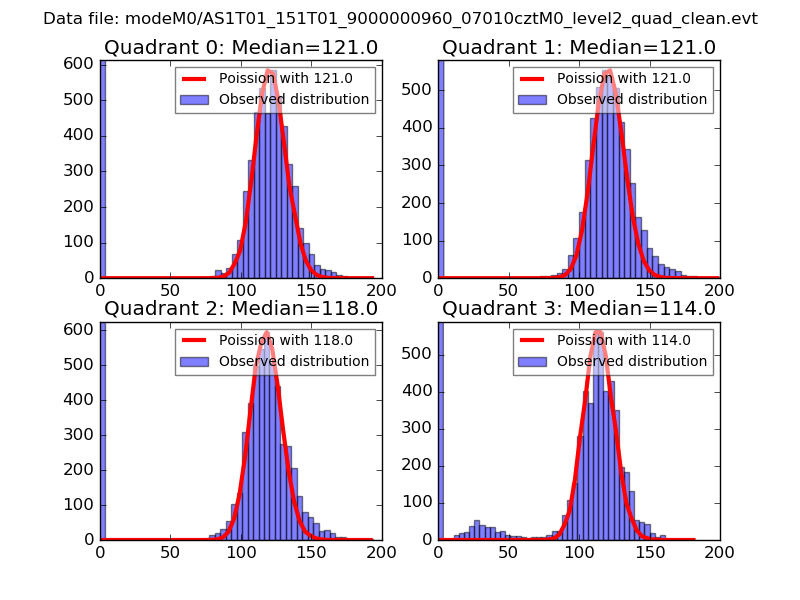 |
 |
| Quadrant-wise count rates Data is divided into 100 sec bins |
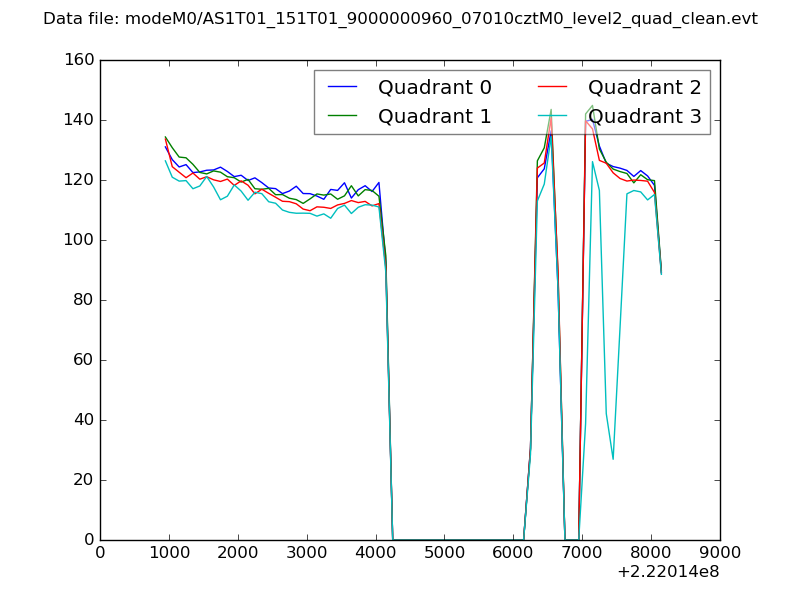 |
|
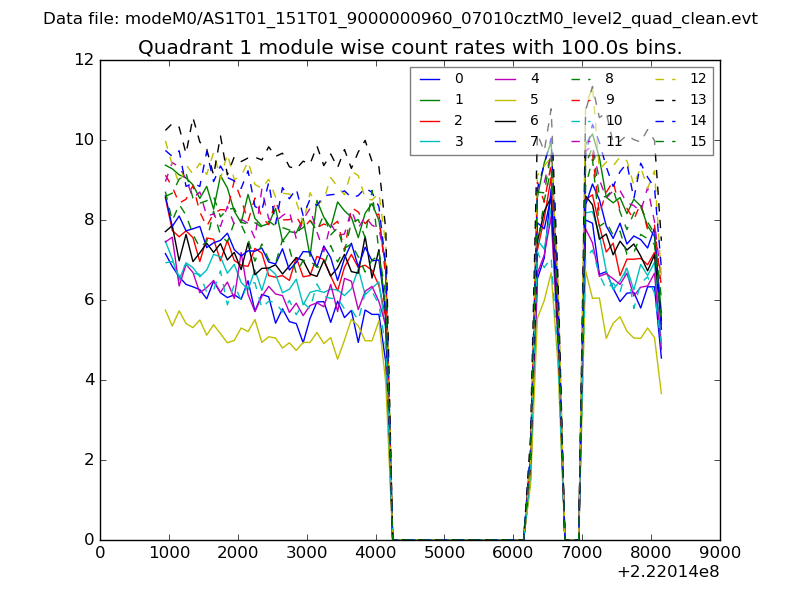
| Module-wise count rates for Quadrant A Data is divided into 100 sec bins |
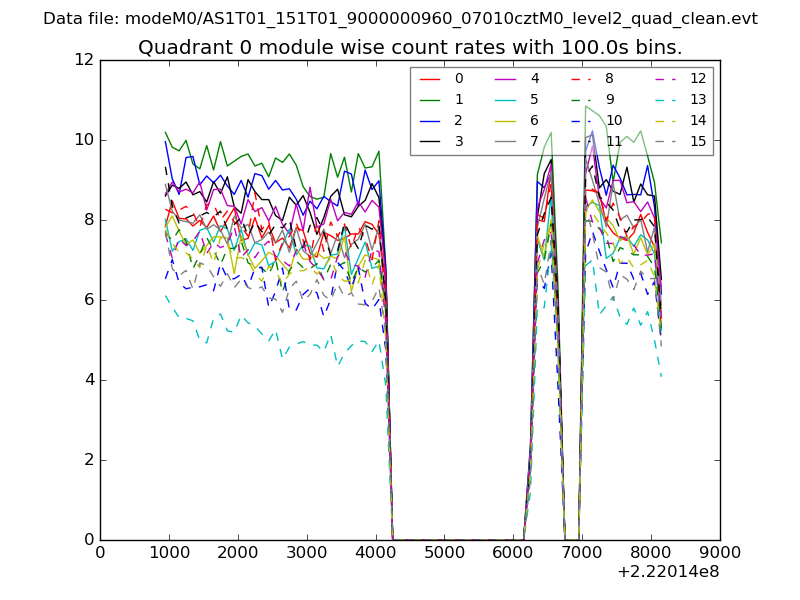 |
 |
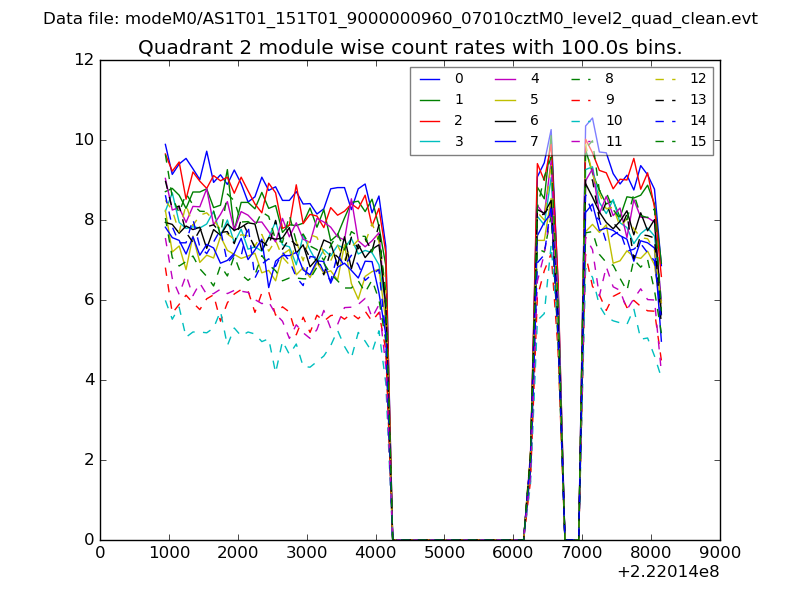
| Module-wise count rates for Quadrant B Data is divided into 100 sec bins |
 |
 |
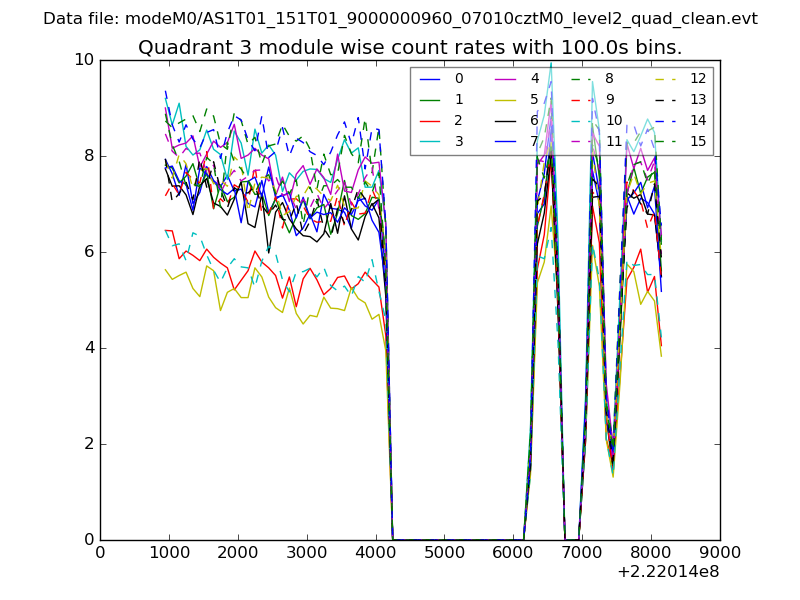
| Module-wise count rates for Quadrant C Data is divided into 100 sec bins |
 |
 |
| Module-wise count rates for Quadrant D Data is divided into 100 sec bins |
 |
 |
| Parameter | Plot |
|---|---|
| CZT HV Monitor | 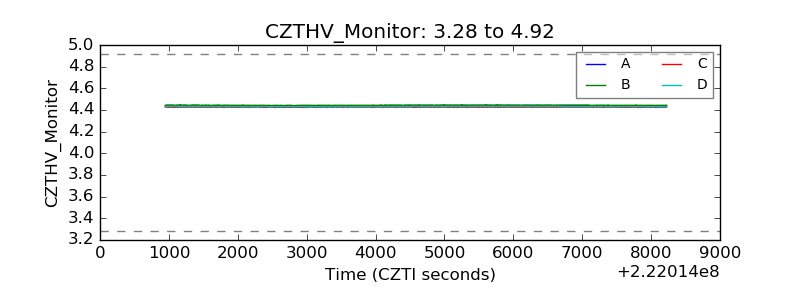 |
| D_VDD | 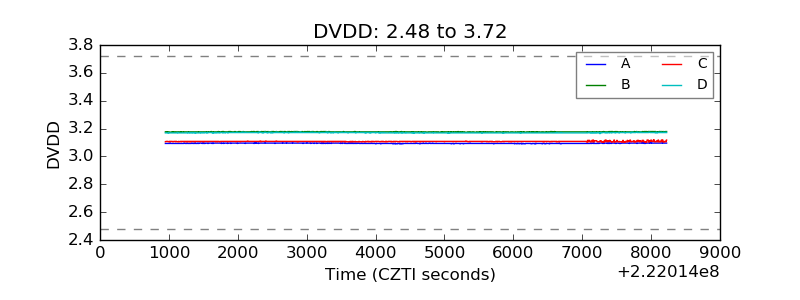 |
| Temperature 1 | 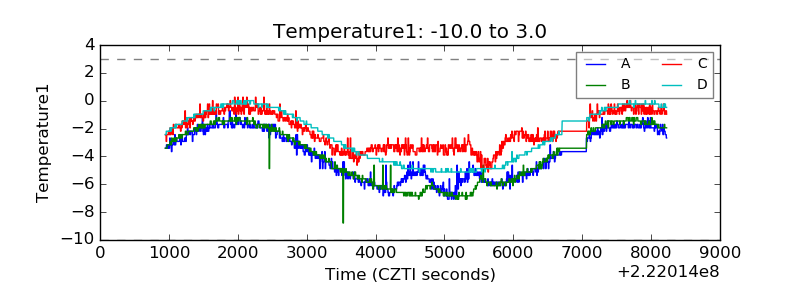 |
| Veto HV Monitor | 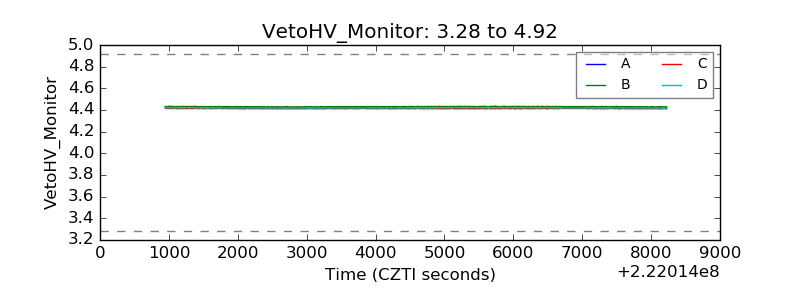 |
| Veto LLD | 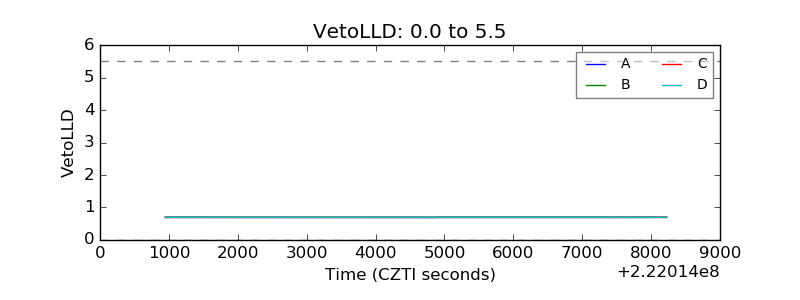 |
| Alpha Counter | 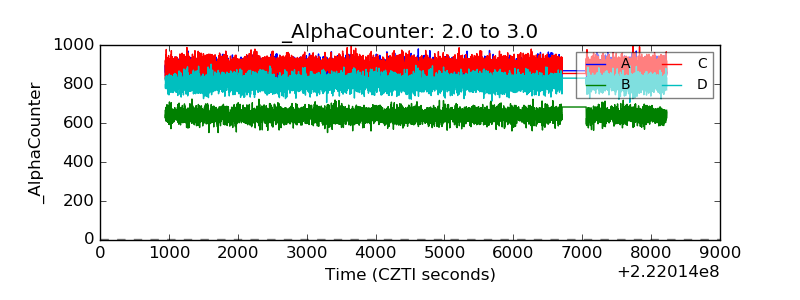 |
| _CPM_Rate | 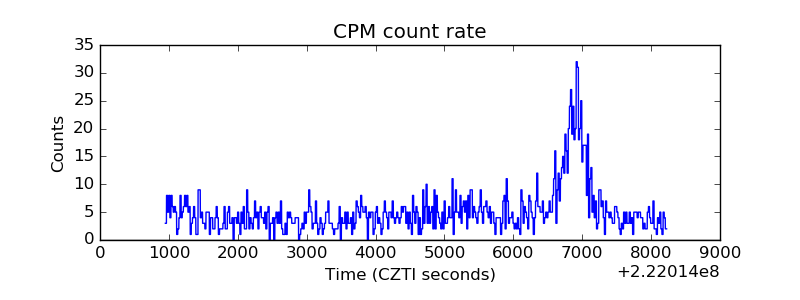 |
| CZT Counter | 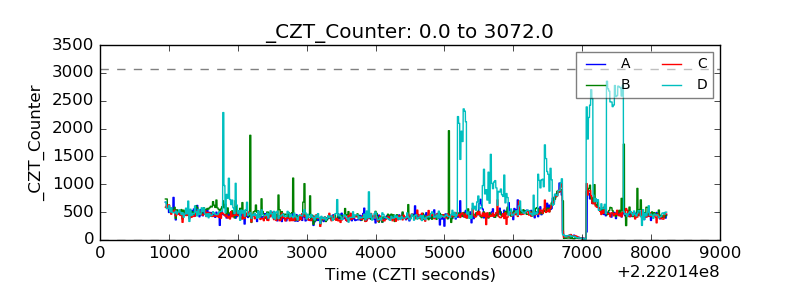 |
| +2.5 Volts monitor | 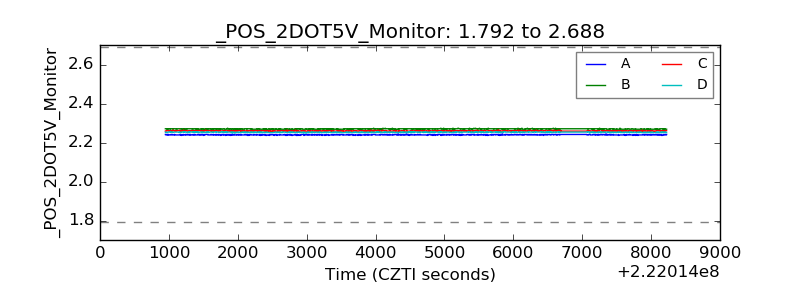 |
| +5 Volts monitor | 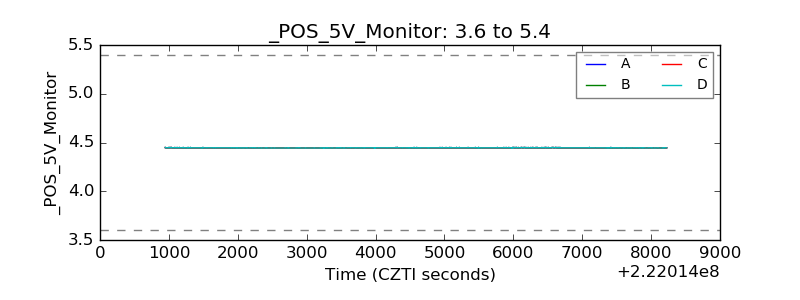 |
| _ROLL_ROT | 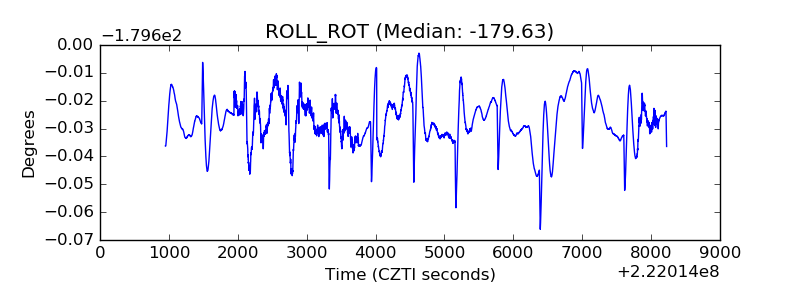 |
| _Roll_DEC | 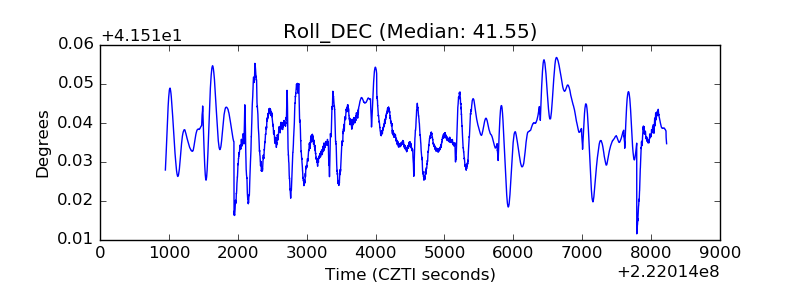 |
| _Roll_RA | 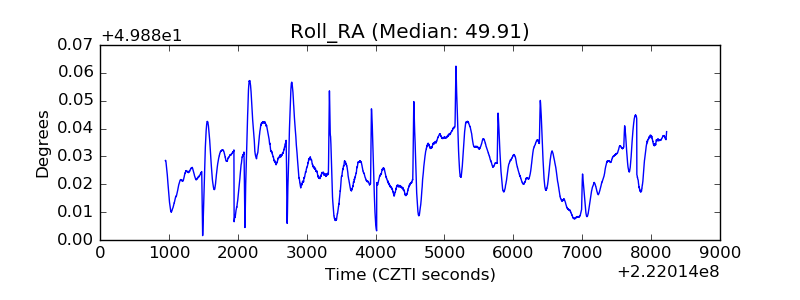 |
| Veto Counter | 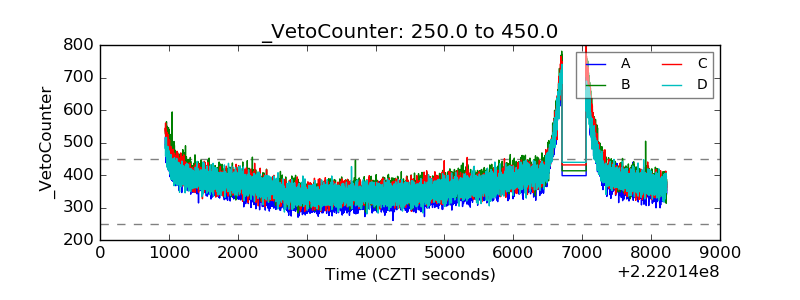 |