| Param | Original file | Final file |
|---|---|---|
| Filename | modeM0/AS1G06_026T01_9000000962cztM0_level2.fits | modeM0/AS1G06_026T01_9000000962cztM0_level2_quad_clean.evt |
| Size (bytes) | 710,305,920 | 704,223,360 |
| Size | 677.4 MB | 671.6 MB |
| Events in quadrant A | 4,278,268 | 4,210,637 |
| Events in quadrant B | 4,126,118 | 4,197,620 |
| Events in quadrant C | 4,219,516 | 4,001,107 |
| Events in quadrant D | 3,632,984 | 3,664,065 |
| Mode M9 | |||
|---|---|---|---|
| Quadrant | BADHDUFLAG | Total packets | Discarded packets |
| A | 0 | 118 | 0 |
| B | 0 | 118 | 0 |
| C | 0 | 118 | 0 |
| D | 0 | 118 | 0 |
| Mode M0 | |||
|---|---|---|---|
| Quadrant | BADHDUFLAG | Total packets | Discarded packets |
| A | 0 | 156753 | 0 |
| B | 0 | 161132 | 0 |
| C | 0 | 156383 | 0 |
| D | 0 | 171920 | 0 |
| Mode SS | |||
|---|---|---|---|
| Quadrant | BADHDUFLAG | Total packets | Discarded packets |
| A | 0 | 1556 | 0 |
| B | 0 | 1556 | 0 |
| C | 0 | 1556 | 0 |
| D | 0 | 1556 | 0 |
| Quadrant | Total seconds | Saturated seconds | Saturation percentage |
|---|---|---|---|
| A | 76653 | 786 | 1.025400% |
| B | 76653 | 893 | 1.164990% |
| C | 76653 | 589 | 0.768398% |
| D | 76653 | 1623 | 2.117334% |
Noise dominated data is calculated using 1-second bins in cleaned event files. If a bin has >2000 counts, and if more than 50% of those come from <1% of pixels, then it is considered to be noise-dominated and hence unusable.
| Quadrant | # 1 sec bins | Bins with >0 counts | Bins with >2000 counts | High rate bins dominated by noise | Noise dominated (total time) | Noise dominated (detector-on time) | Marked lightcurve |
|---|---|---|---|---|---|---|---|
| A | 88253 | 76653 | 0 | 0 | 0.00% | 0.00% |  |
| B | 88253 | 76653 | 0 | 0 | 0.00% | 0.00% |  |
| C | 88253 | 76654 | 0 | 0 | 0.00% | 0.00% |  |
| D | 88253 | 76646 | 0 | 0 | 0.00% | 0.00% |  |
Top three noisy pixels from each quadrant. If the there are fewer than three noisy pixels in the level2.evt file, extra rows are filled as -1
| Pixel properties | Quadrant properties | ||||||
|---|---|---|---|---|---|---|---|
| Quadrant | DetID | PixID | Counts | Sigma | Mean | Median | Sigma |
| A | 0 | 29 | 4255 | 11.43 | 1111 | 1038 | 281.4 |
| A | 7 | 110 | 3502 | 8.76 | 1111 | 1038 | 281.4 |
| A | 0 | 30 | 3276 | 7.95 | 1111 | 1038 | 281.4 |
| B | 2 | 9 | 3511 | 11.54 | 1087 | 1037 | 214.4 |
| B | 3 | 17 | 2861 | 8.51 | 1087 | 1037 | 214.4 |
| B | 12 | 226 | 2811 | 8.28 | 1087 | 1037 | 214.4 |
| C | 1 | 80 | 3148 | 7.23 | 1113 | 1031 | 293.0 |
| C | 1 | 81 | 3118 | 7.12 | 1113 | 1031 | 293.0 |
| C | 12 | 241 | 2958 | 6.58 | 1113 | 1031 | 293.0 |
| D | 3 | 14 | 2745 | 6.57 | 1034 | 940 | 274.8 |
| D | 6 | 231 | 2714 | 6.46 | 1034 | 940 | 274.8 |
| D | 7 | 5 | 2616 | 6.1 | 1034 | 940 | 274.8 |
Histogram calculated using DETX and DETY for each event in the final _common_clean file
| Quadrant A |  |
 |
Quadrant B |
|---|---|---|---|
| Quadrant D |  |
 |
Quadrant C |
| Plot type | Count rate plots | Images |
|---|---|---|
| Comparison with Poisson distribution Blue bars denote a histogram of data divided into 1 sec bins. Red curve is a Poisson curve with rate = median count rate of data. |
 |
 |
| Quadrant-wise count rates Data is divided into 100 sec bins |
 |
|
| Module-wise count rates for Quadrant A Data is divided into 100 sec bins |
 |
 |
| Module-wise count rates for Quadrant B Data is divided into 100 sec bins |
 |
 |
| Module-wise count rates for Quadrant C Data is divided into 100 sec bins |
 |
 |
| Module-wise count rates for Quadrant D Data is divided into 100 sec bins |
 |
 |
| Parameter | Plot |
|---|---|
| CZT HV Monitor |  |
| D_VDD | 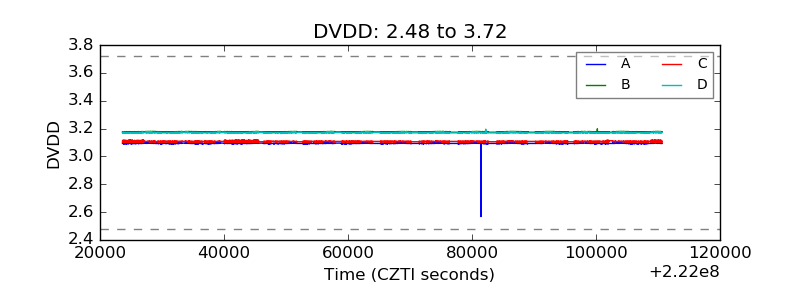 |
| Temperature 1 |  |
| Veto HV Monitor |  |
| Veto LLD |  |
| Alpha Counter |  |
| _CPM_Rate |  |
| CZT Counter |  |
| +2.5 Volts monitor |  |
| +5 Volts monitor |  |
| _ROLL_ROT |  |
| _Roll_DEC |  |
| _Roll_RA |  |
| Veto Counter |  |