| Param | Original file | Final file |
|---|---|---|
| Filename | modeM0/AS1G06_026T01_9000000962_07010cztM0_level2.evt | modeM0/AS1G06_026T01_9000000962_07010cztM0_level2_quad_clean.evt |
| Size (bytes) | 325,958,400 | 64,679,040 |
| Size | 310.9 MB | 61.7 MB |
| Events in quadrant A | 2,311,607 | 407,764 |
| Events in quadrant B | 2,417,743 | 411,202 |
| Events in quadrant C | 2,283,926 | 400,804 |
| Events in quadrant D | 2,515,533 | 386,150 |
| Mode M9 | |||
|---|---|---|---|
| Quadrant | BADHDUFLAG | Total packets | Discarded packets |
| A | 0 | 3 | 0 |
| B | 0 | 3 | 0 |
| C | 0 | 3 | 0 |
| D | 0 | 3 | 0 |
| Mode M0 | |||
|---|---|---|---|
| Quadrant | BADHDUFLAG | Total packets | Discarded packets |
| A | 0 | 10400 | 2 |
| B | 0 | 10634 | 1 |
| C | 0 | 10352 | 1 |
| D | 0 | 10897 | 1 |
| Mode SS | |||
|---|---|---|---|
| Quadrant | BADHDUFLAG | Total packets | Discarded packets |
| A | 0 | 100 | 0 |
| B | 0 | 100 | 0 |
| C | 0 | 100 | 0 |
| D | 0 | 100 | 0 |
| Quadrant | Total seconds | Saturated seconds | Saturation percentage |
|---|---|---|---|
| A | 5035 | 72 | 1.429990% |
| B | 5035 | 91 | 1.807349% |
| C | 5035 | 26 | 0.516385% |
| D | 5035 | 55 | 1.092354% |
Noise dominated data is calculated using 1-second bins in cleaned event files. If a bin has >2000 counts, and if more than 50% of those come from <1% of pixels, then it is considered to be noise-dominated and hence unusable.
| Quadrant | # 1 sec bins | Bins with >0 counts | Bins with >2000 counts | High rate bins dominated by noise | Noise dominated (total time) | Noise dominated (detector-on time) | Marked lightcurve |
|---|---|---|---|---|---|---|---|
| A | 5265 | 5036 | 0 | 0 | 0.00% | 0.00% | 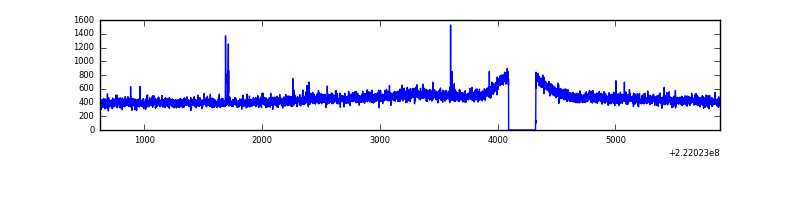 |
| B | 5265 | 5036 | 1 | 1 | 0.02% | 0.02% | 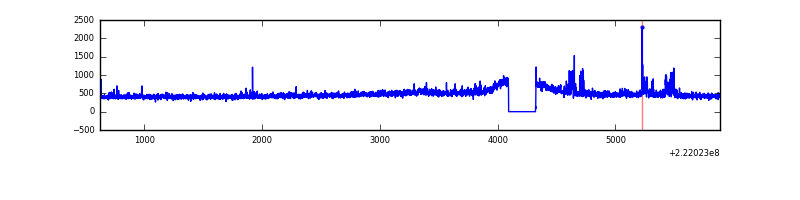 |
| C | 5265 | 5036 | 0 | 0 | 0.00% | 0.00% | 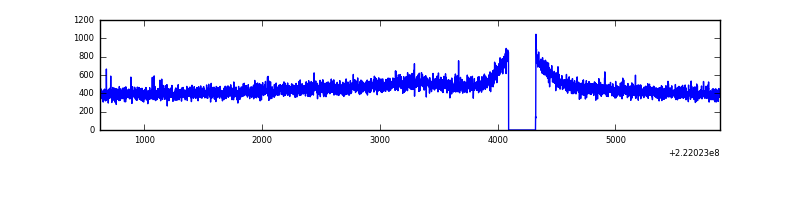 |
| D | 5265 | 5036 | 28 | 28 | 0.53% | 0.56% | 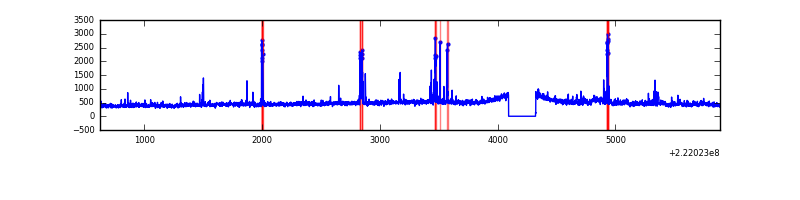 |
Top three noisy pixels from each quadrant. If the there are fewer than three noisy pixels in the level2.evt file, extra rows are filled as -1
| Pixel properties | Quadrant properties | ||||||
|---|---|---|---|---|---|---|---|
| Quadrant | DetID | PixID | Counts | Sigma | Mean | Median | Sigma |
| A | 13 | 14 | 13491 | 106.08 | 593 | 578 | 121.7 |
| A | 4 | 2 | 12535 | 98.23 | 593 | 578 | 121.7 |
| A | 0 | 226 | 5709 | 42.15 | 593 | 578 | 121.7 |
| B | 4 | 239 | 43552 | 373.07 | 597 | 580 | 115.2 |
| B | 4 | 173 | 25772 | 218.71 | 597 | 580 | 115.2 |
| B | 0 | 214 | 21198 | 179.0 | 597 | 580 | 115.2 |
| C | 8 | 128 | 8047 | 55.25 | 579 | 580 | 135.1 |
| C | 1 | 16 | 7230 | 49.21 | 579 | 580 | 135.1 |
| C | 13 | 61 | 4597 | 29.73 | 579 | 580 | 135.1 |
| D | 8 | 195 | 127025 | 890.17 | 578 | 558 | 142.1 |
| D | 14 | 34 | 109963 | 770.08 | 578 | 558 | 142.1 |
| D | 2 | 14 | 32873 | 227.46 | 578 | 558 | 142.1 |
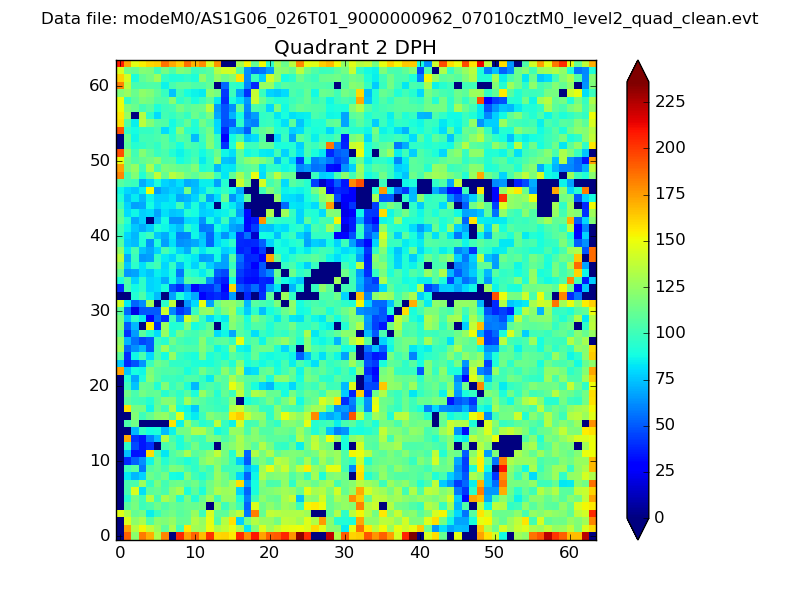
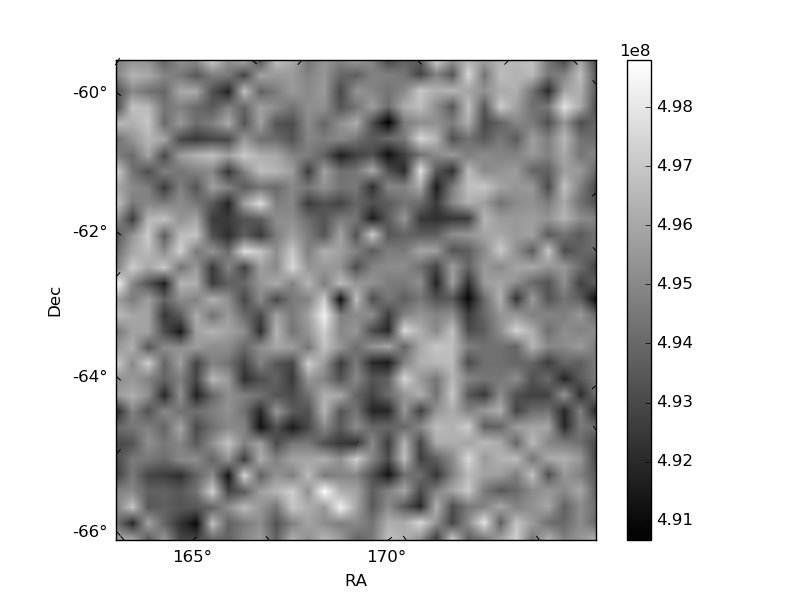
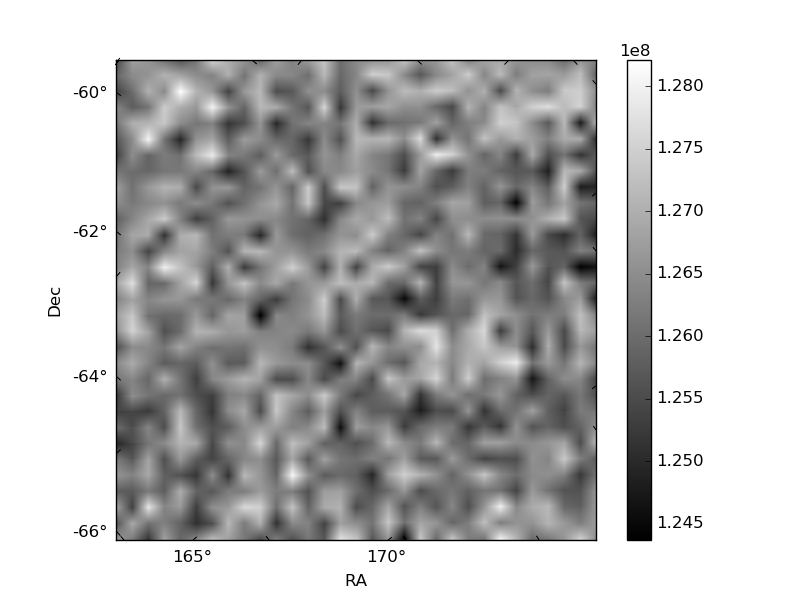
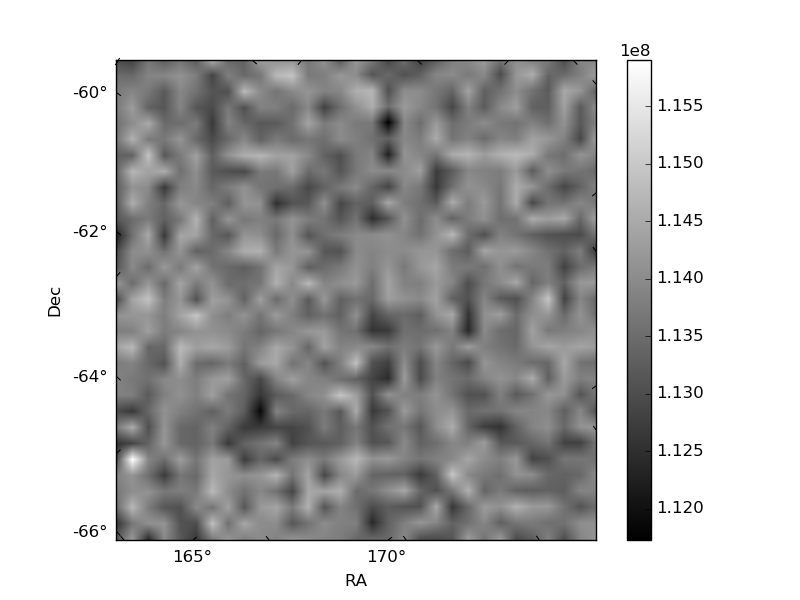
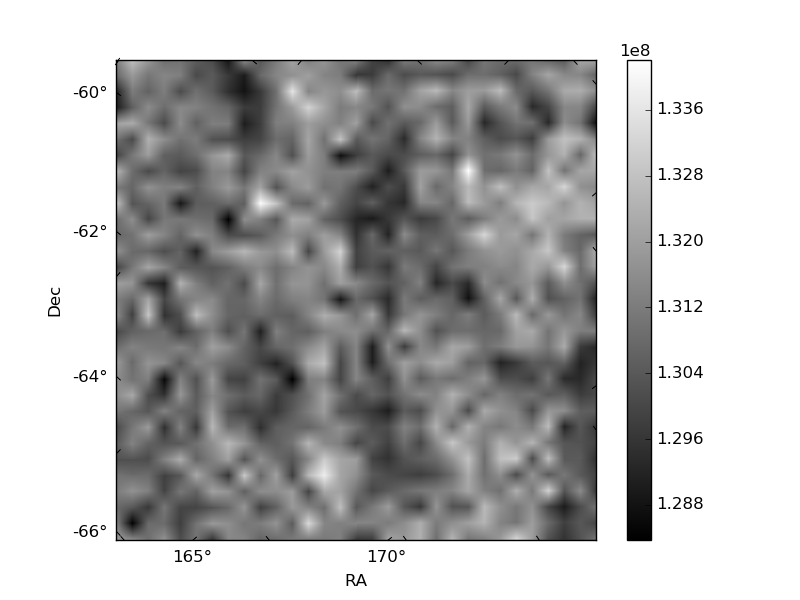
Histogram calculated using DETX and DETY for each event in the final _common_clean file
| Quadrant A | 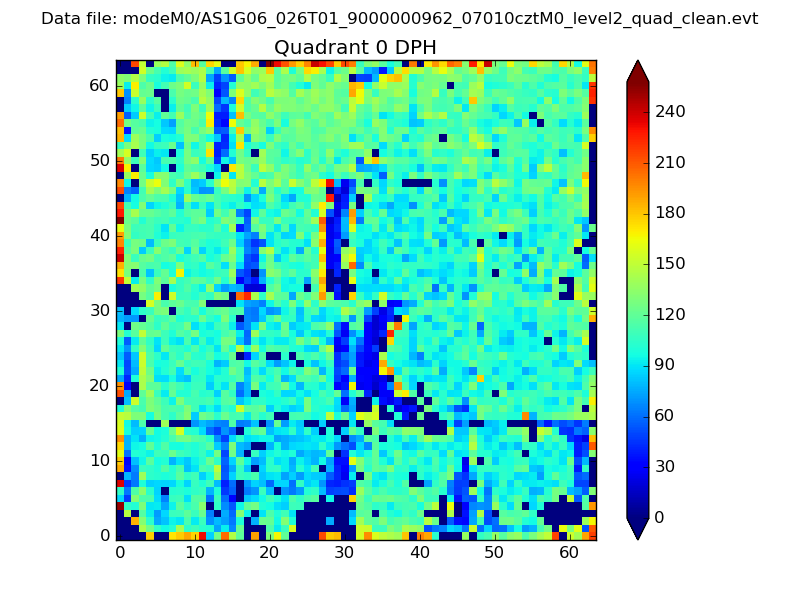 |
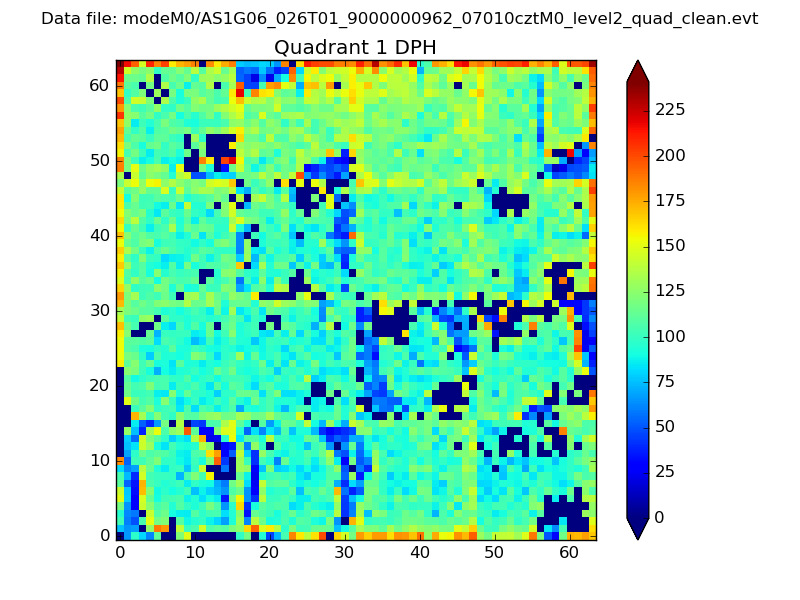 |
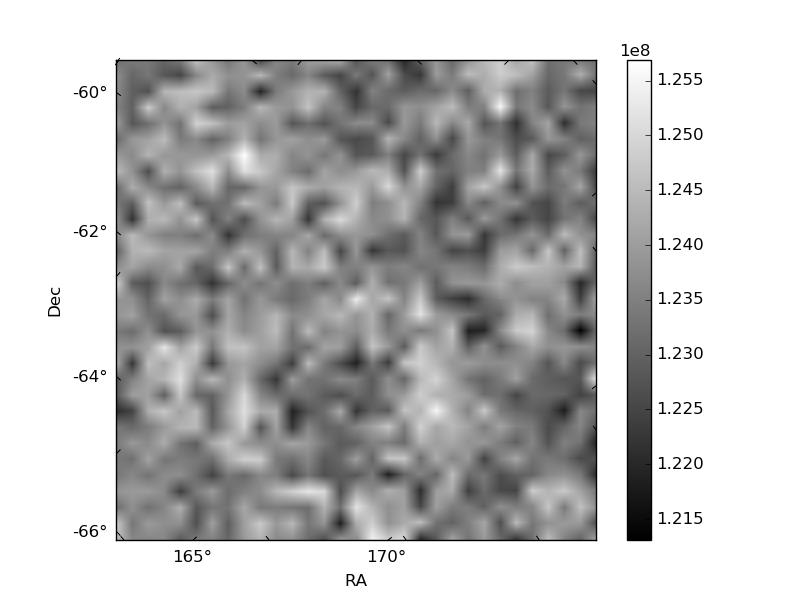
Quadrant B |
|---|---|---|---|
| Quadrant D | 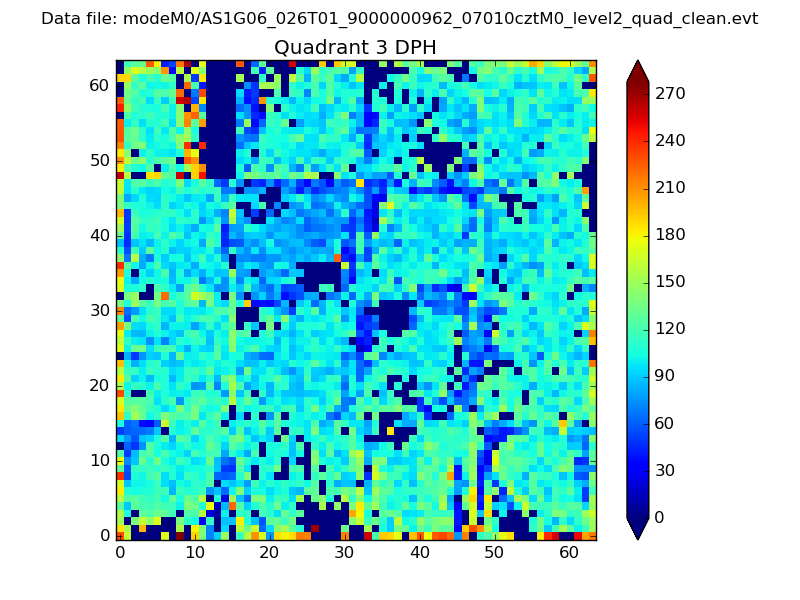 |
 |
Quadrant C |
| Plot type | Count rate plots | Images |
|---|---|---|
| Comparison with Poisson distribution Blue bars denote a histogram of data divided into 1 sec bins. Red curve is a Poisson curve with rate = median count rate of data. |
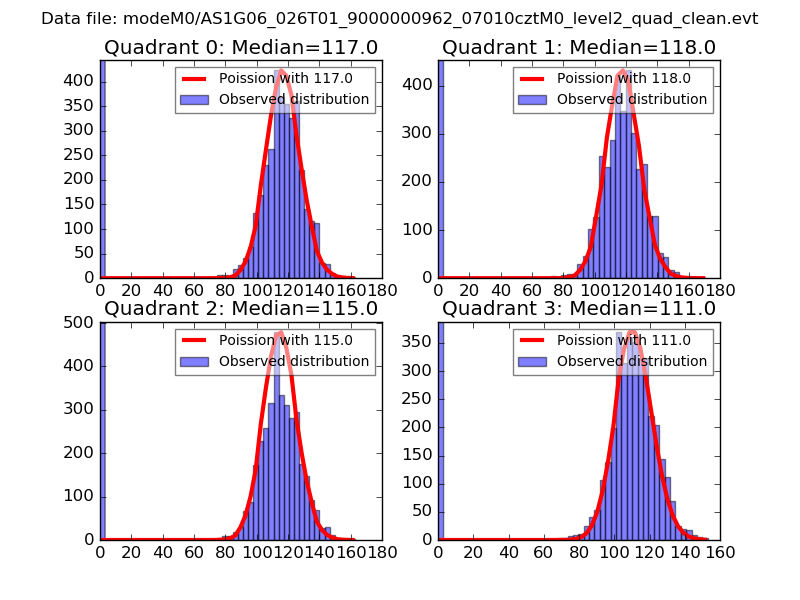 |
 |
| Quadrant-wise count rates Data is divided into 100 sec bins |
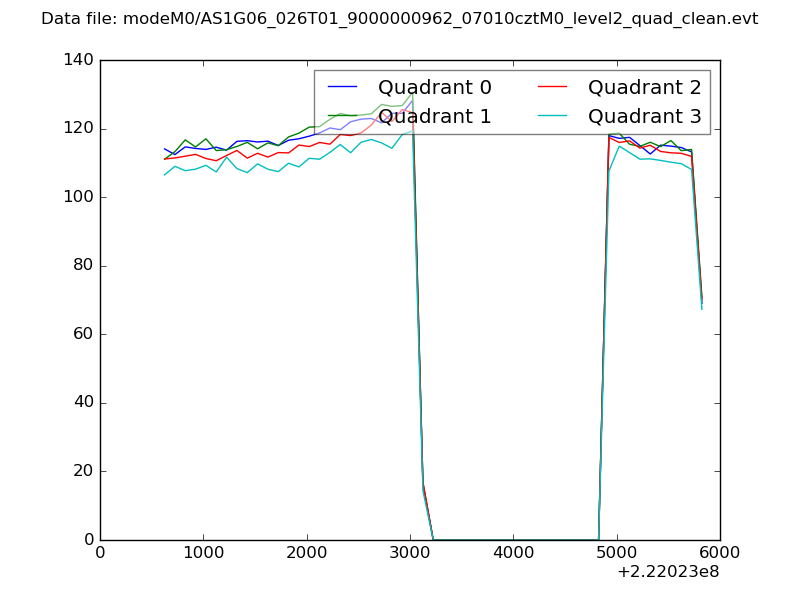 |
|
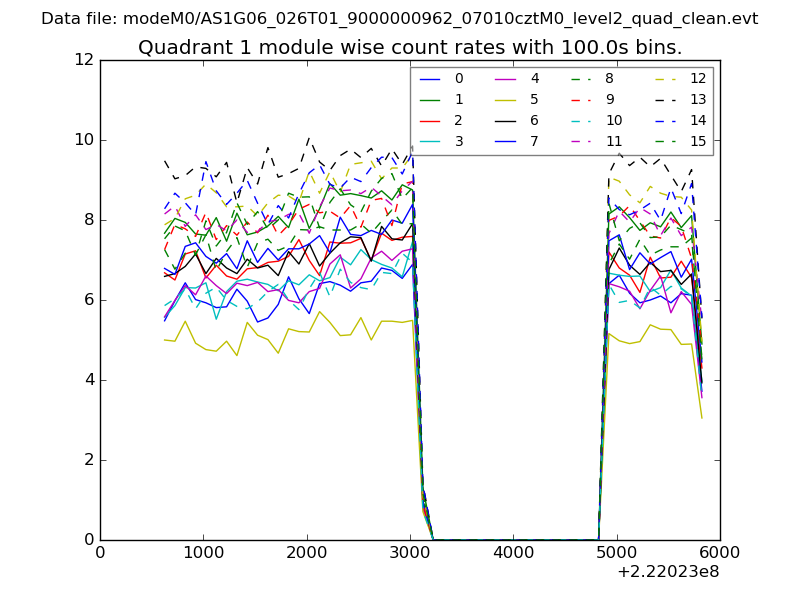
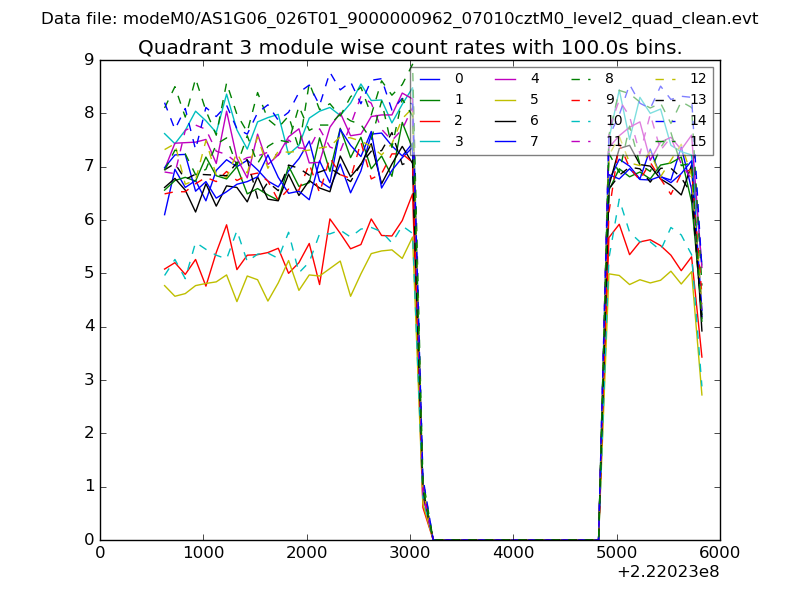
| Module-wise count rates for Quadrant A Data is divided into 100 sec bins |
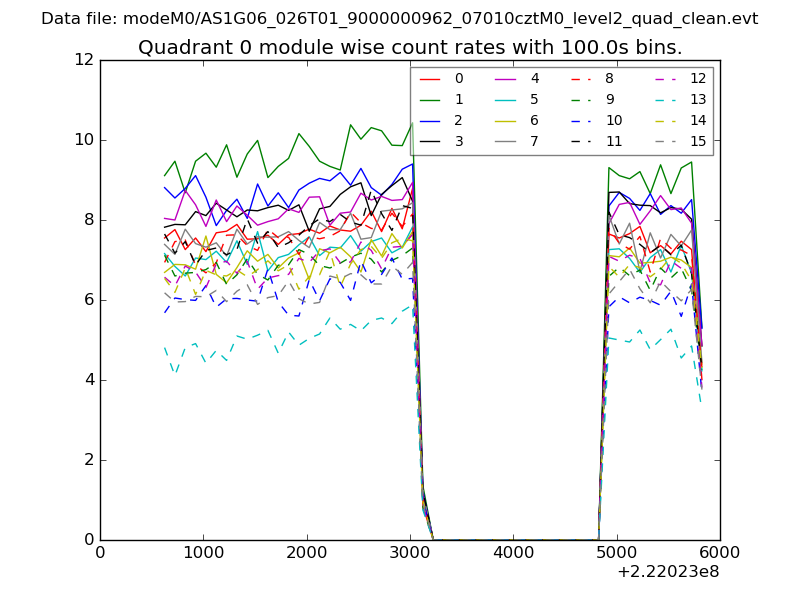 |
 |
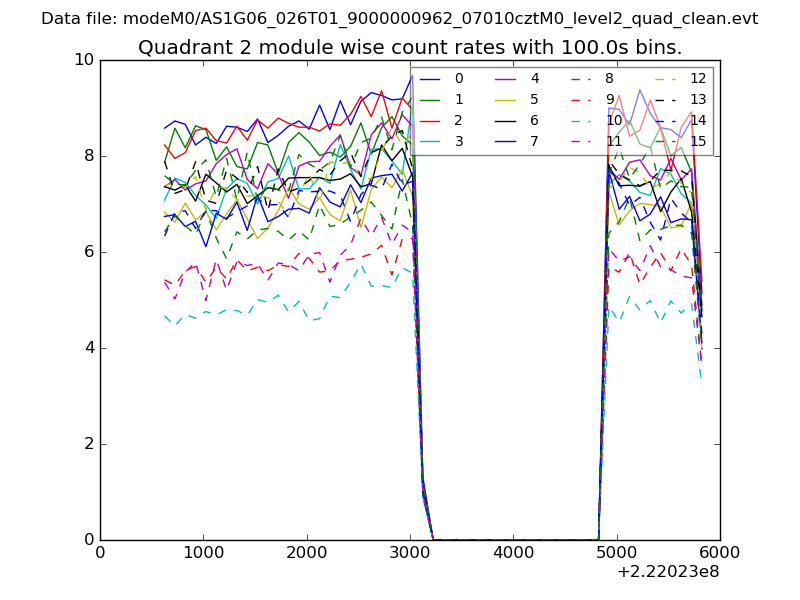
| Module-wise count rates for Quadrant B Data is divided into 100 sec bins |
 |
 |
| Module-wise count rates for Quadrant C Data is divided into 100 sec bins |
 |
 |
| Module-wise count rates for Quadrant D Data is divided into 100 sec bins |
 |
 |
| Parameter | Plot |
|---|---|
| CZT HV Monitor | 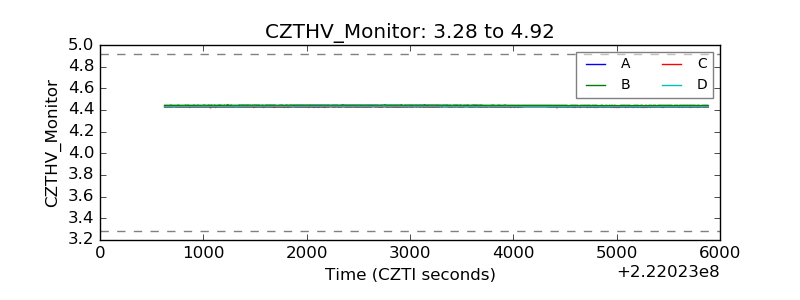 |
| D_VDD | 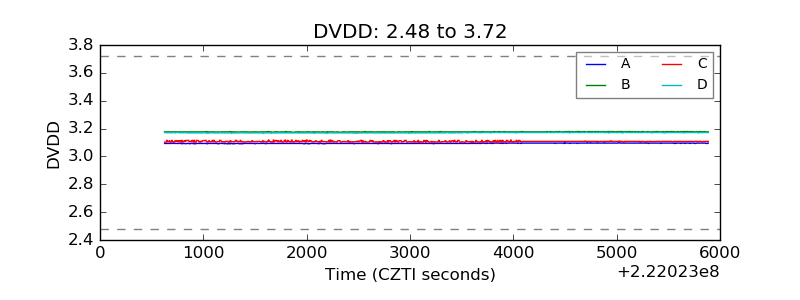 |
| Temperature 1 | 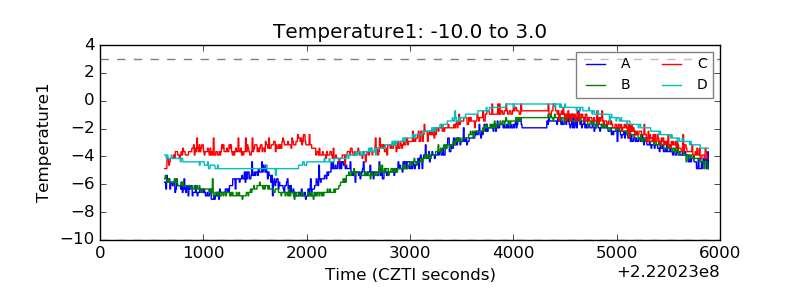 |
| Veto HV Monitor |  |
| Veto LLD | 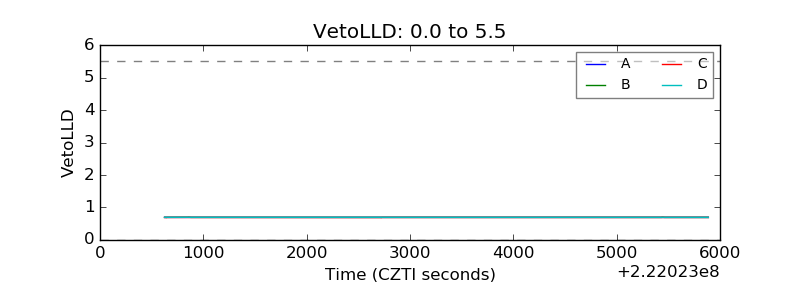 |
| Alpha Counter | 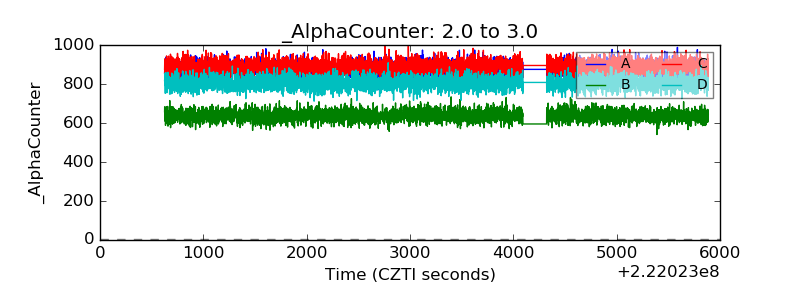 |
| _CPM_Rate | 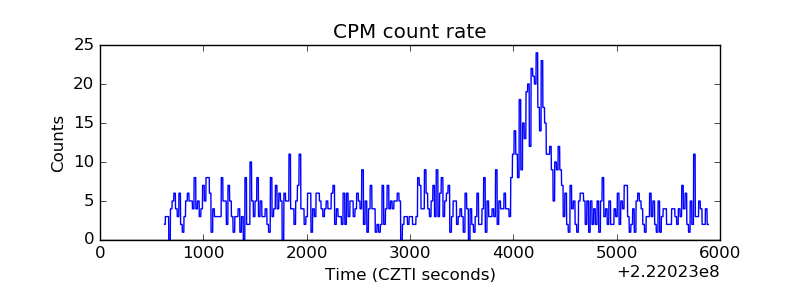 |
| CZT Counter | 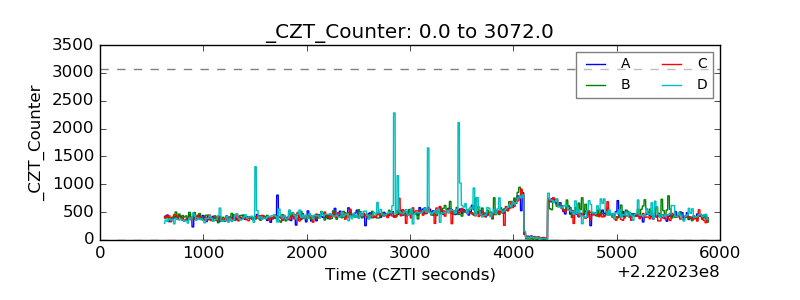 |
| +2.5 Volts monitor | 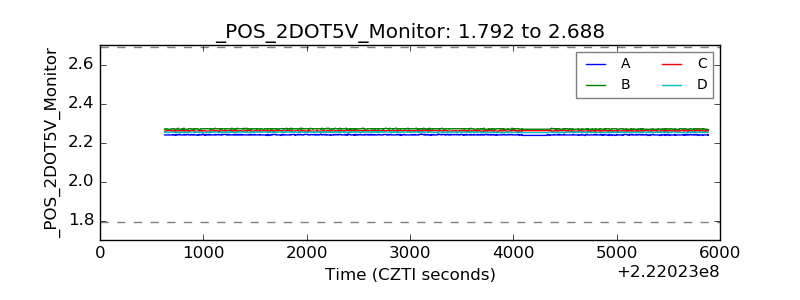 |
| +5 Volts monitor | 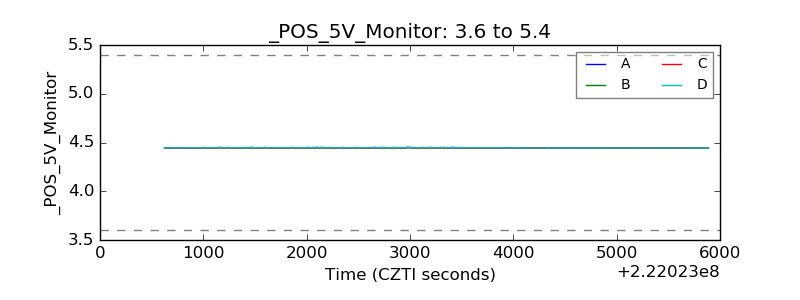 |
| _ROLL_ROT | 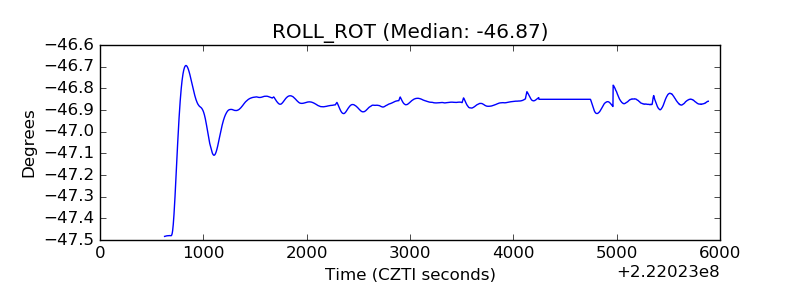 |
| _Roll_DEC | 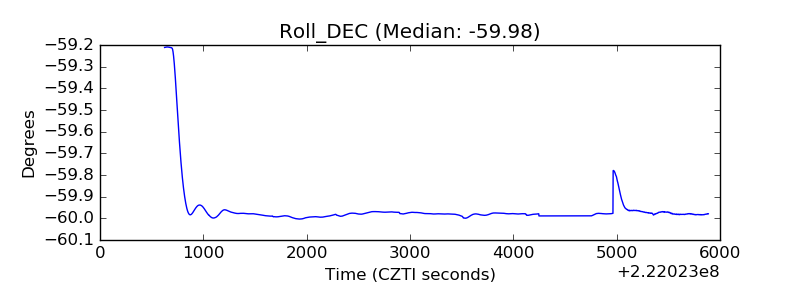 |
| _Roll_RA | 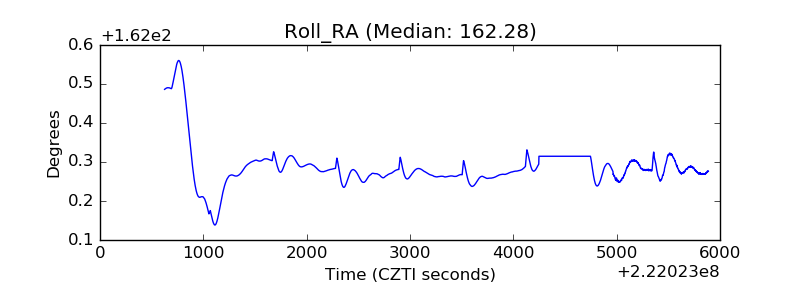 |
| Veto Counter | 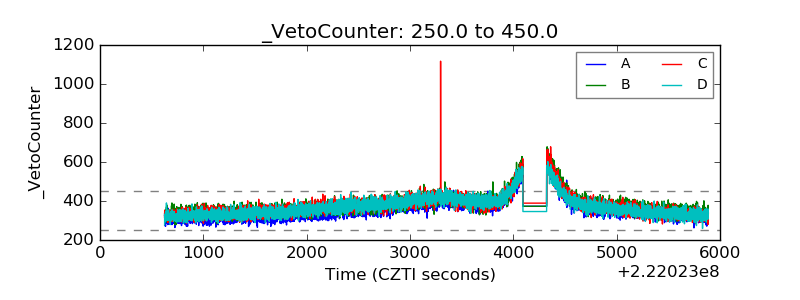 |