| Param | Original file | Final file |
|---|---|---|
| Filename | modeM0/AS1G06_026T01_9000000962_07015cztM0_level2.evt | modeM0/AS1G06_026T01_9000000962_07015cztM0_level2_quad_clean.evt |
| Size (bytes) | 409,737,600 | 92,661,120 |
| Size | 390.8 MB | 88.4 MB |
| Events in quadrant A | 2,958,547 | 590,633 |
| Events in quadrant B | 3,146,824 | 600,490 |
| Events in quadrant C | 2,932,162 | 589,730 |
| Events in quadrant D | 2,922,551 | 565,467 |
| Mode M9 | |||
|---|---|---|---|
| Quadrant | BADHDUFLAG | Total packets | Discarded packets |
| A | 0 | 15 | 0 |
| B | 0 | 15 | 0 |
| C | 0 | 15 | 0 |
| D | 0 | 16 | 0 |
| Mode M0 | |||
|---|---|---|---|
| Quadrant | BADHDUFLAG | Total packets | Discarded packets |
| A | 0 | 13384 | 3 |
| B | 0 | 13785 | 2 |
| C | 0 | 13336 | 2 |
| D | 0 | 13532 | 2 |
| Mode SS | |||
|---|---|---|---|
| Quadrant | BADHDUFLAG | Total packets | Discarded packets |
| A | 0 | 132 | 0 |
| B | 0 | 132 | 0 |
| C | 0 | 132 | 0 |
| D | 0 | 132 | 0 |
| Quadrant | Total seconds | Saturated seconds | Saturation percentage |
|---|---|---|---|
| A | 6601 | 20 | 0.302984% |
| B | 6601 | 30 | 0.454477% |
| C | 6601 | 20 | 0.302984% |
| D | 6601 | 12 | 0.181791% |
Noise dominated data is calculated using 1-second bins in cleaned event files. If a bin has >2000 counts, and if more than 50% of those come from <1% of pixels, then it is considered to be noise-dominated and hence unusable.
| Quadrant | # 1 sec bins | Bins with >0 counts | Bins with >2000 counts | High rate bins dominated by noise | Noise dominated (total time) | Noise dominated (detector-on time) | Marked lightcurve |
|---|---|---|---|---|---|---|---|
| A | 7621 | 6602 | 5 | 5 | 0.07% | 0.08% | 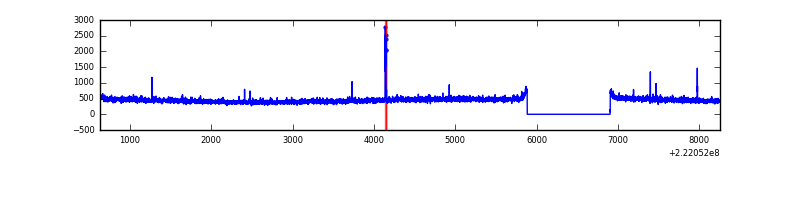 |
| B | 7621 | 6602 | 2 | 2 | 0.03% | 0.03% | 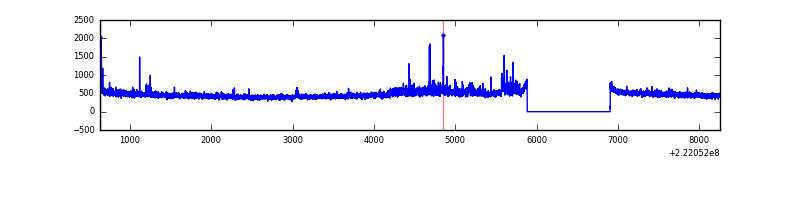 |
| C | 7621 | 6602 | 0 | 0 | 0.00% | 0.00% | 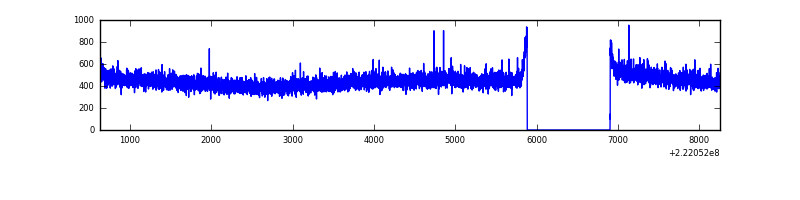 |
| D | 7621 | 6602 | 0 | 0 | 0.00% | 0.00% | 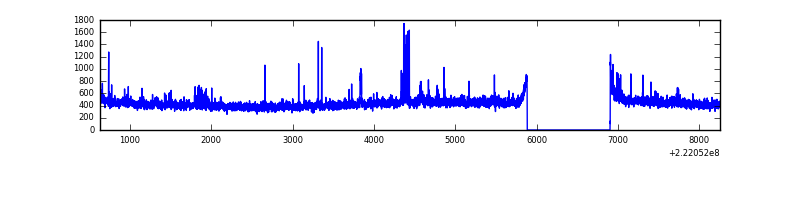 |
Top three noisy pixels from each quadrant. If the there are fewer than three noisy pixels in the level2.evt file, extra rows are filled as -1
| Pixel properties | Quadrant properties | ||||||
|---|---|---|---|---|---|---|---|
| Quadrant | DetID | PixID | Counts | Sigma | Mean | Median | Sigma |
| A | 4 | 2 | 24415 | 152.82 | 759 | 743 | 154.9 |
| A | 13 | 248 | 9928 | 59.3 | 759 | 743 | 154.9 |
| A | 0 | 226 | 7151 | 41.37 | 759 | 743 | 154.9 |
| B | 0 | 214 | 75804 | 513.06 | 771 | 752 | 146.3 |
| B | 0 | 199 | 35432 | 237.08 | 771 | 752 | 146.3 |
| B | 12 | 111 | 14402 | 93.31 | 771 | 752 | 146.3 |
| C | 13 | 61 | 5870 | 29.39 | 749 | 751 | 174.2 |
| C | 12 | 4 | 4090 | 19.17 | 749 | 751 | 174.2 |
| C | 14 | 67 | 3704 | 16.95 | 749 | 751 | 174.2 |
| D | 8 | 195 | 32700 | 176.02 | 743 | 720 | 181.7 |
| D | 12 | 233 | 23939 | 127.8 | 743 | 720 | 181.7 |
| D | 14 | 34 | 21793 | 115.99 | 743 | 720 | 181.7 |
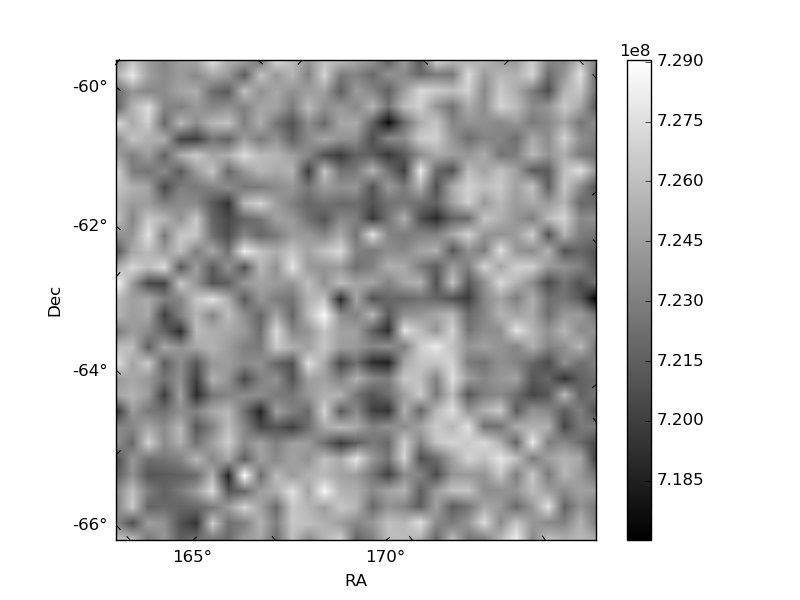
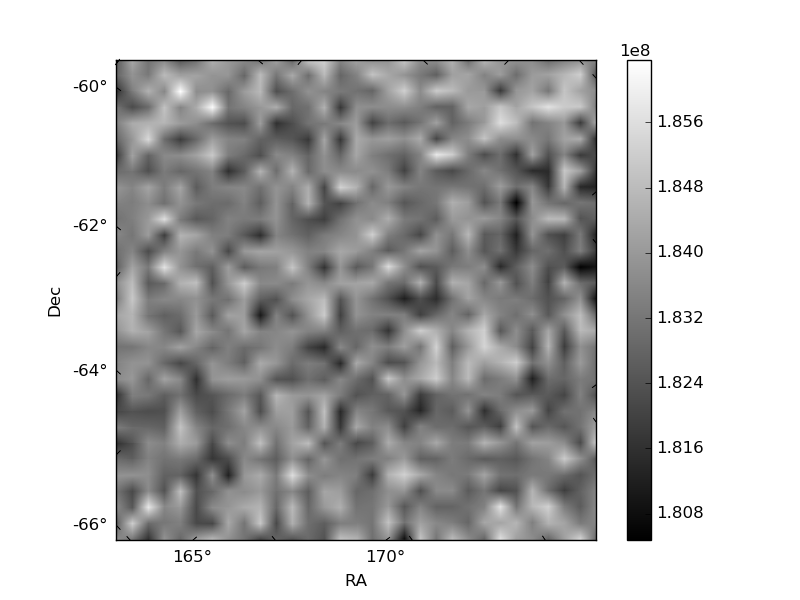
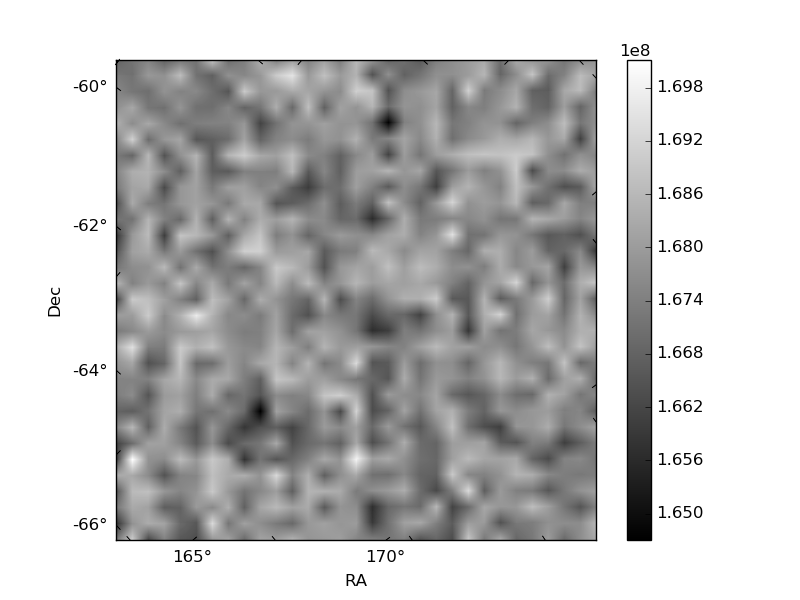
Histogram calculated using DETX and DETY for each event in the final _common_clean file
| Quadrant A | 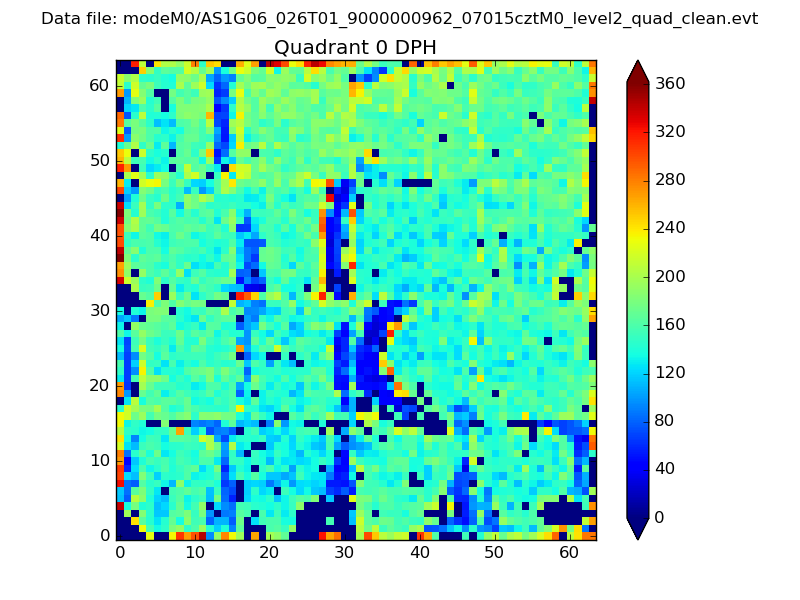 |
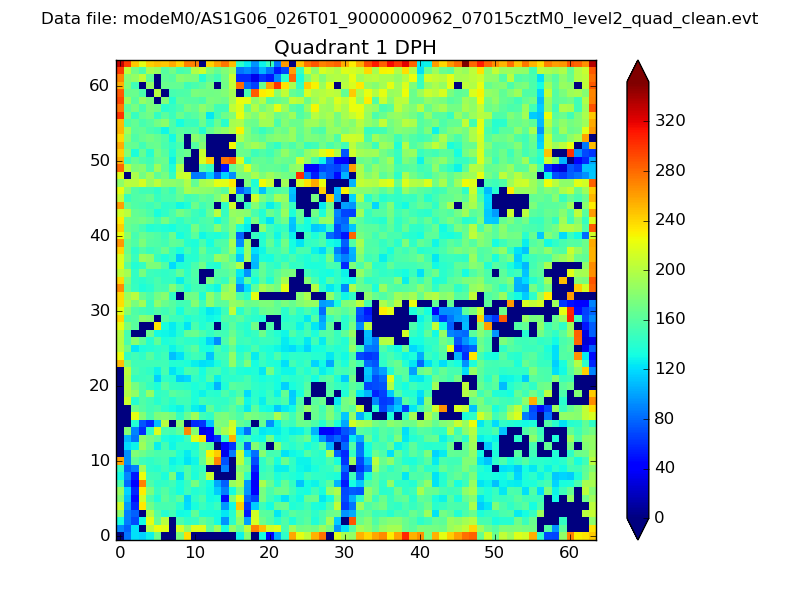 |
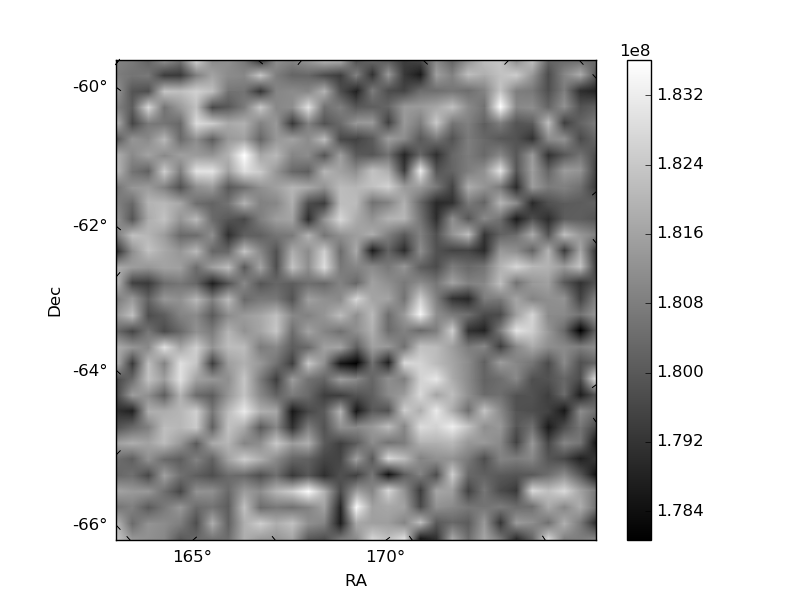
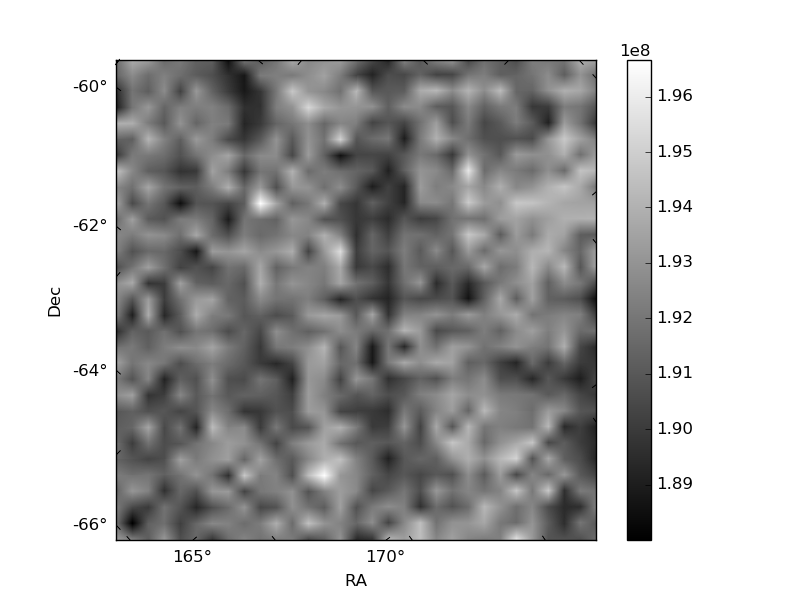
Quadrant B |
|---|---|---|---|
| Quadrant D | 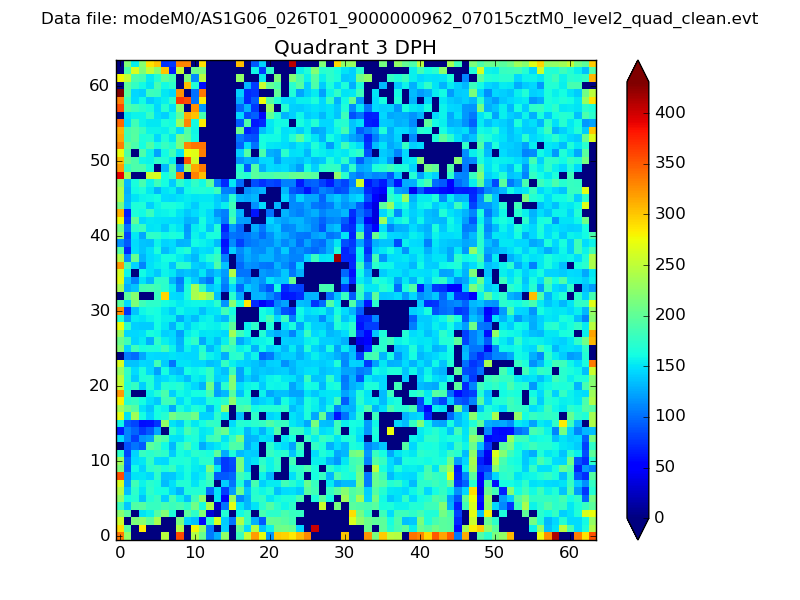 |
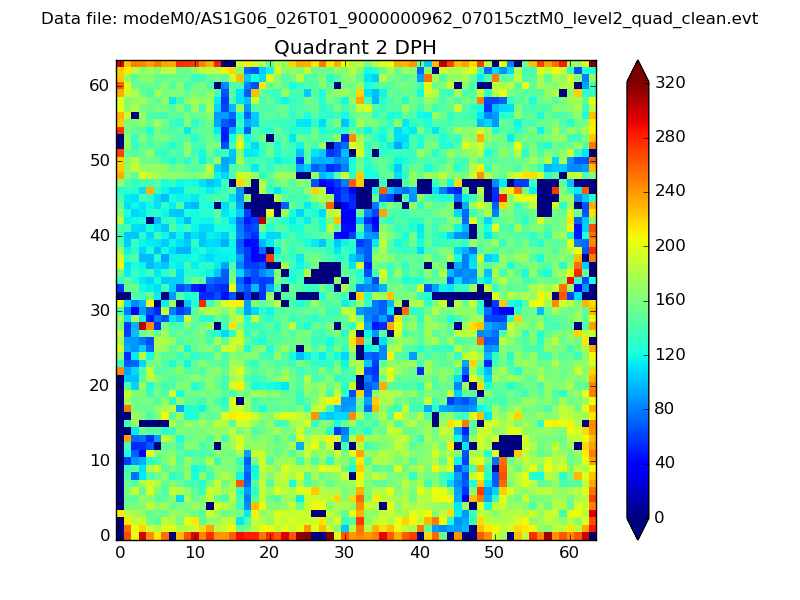 |
Quadrant C |
| Plot type | Count rate plots | Images |
|---|---|---|
| Comparison with Poisson distribution Blue bars denote a histogram of data divided into 1 sec bins. Red curve is a Poisson curve with rate = median count rate of data. |
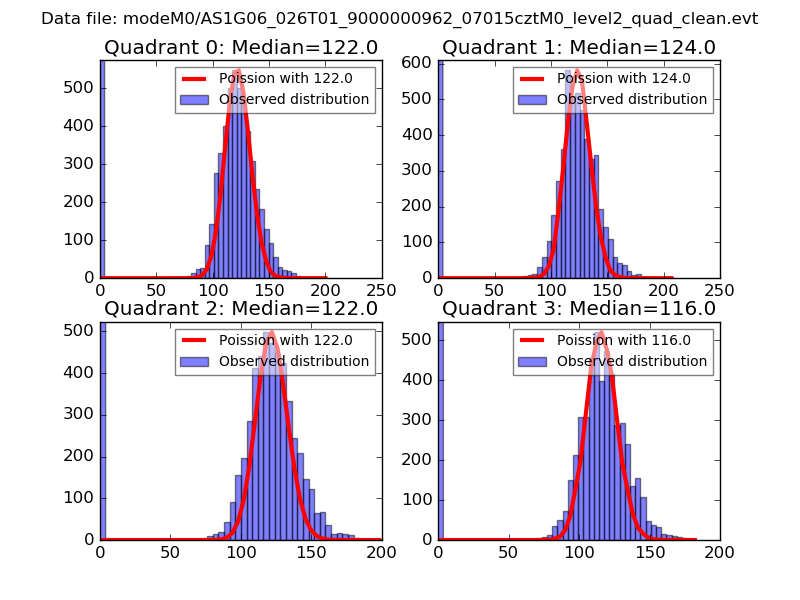 |
 |
| Quadrant-wise count rates Data is divided into 100 sec bins |
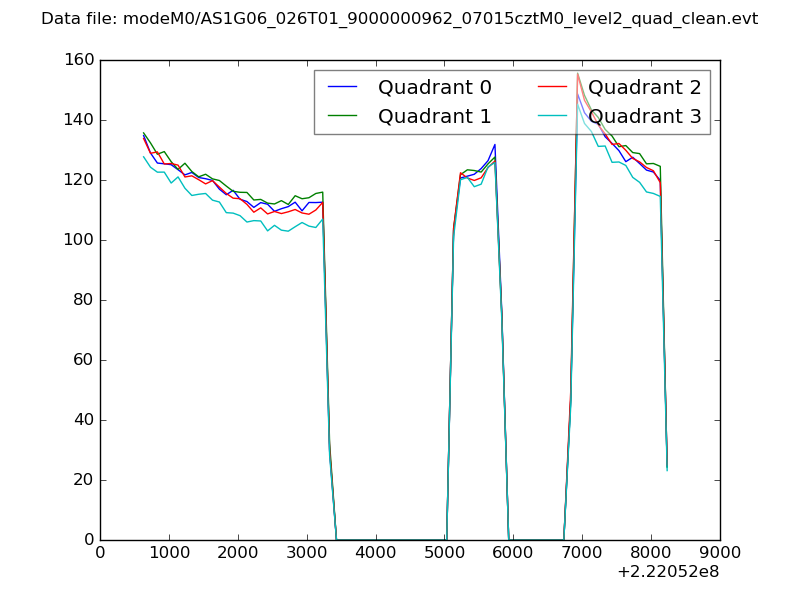 |
|
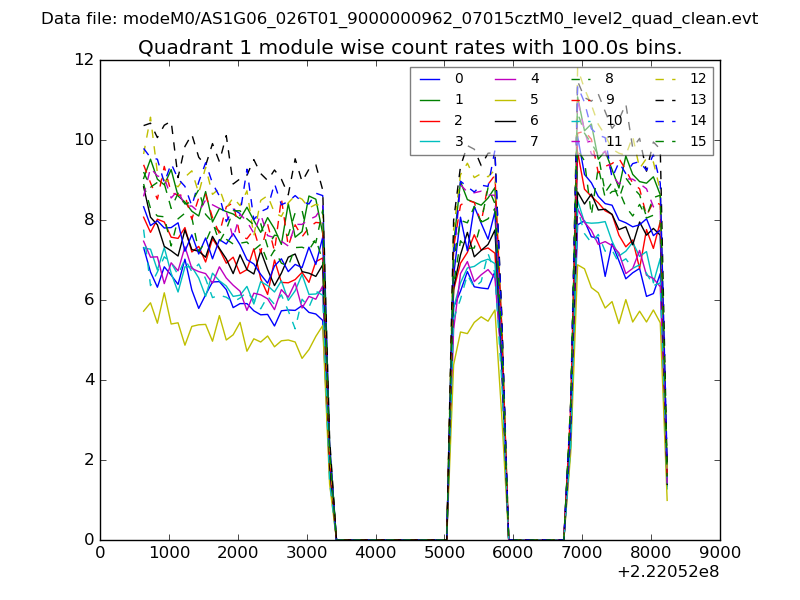
| Module-wise count rates for Quadrant A Data is divided into 100 sec bins |
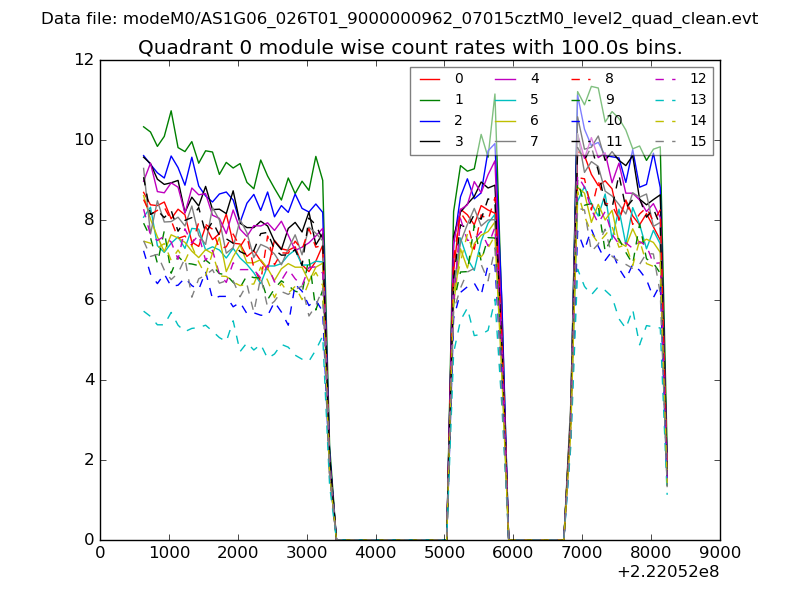 |
 |
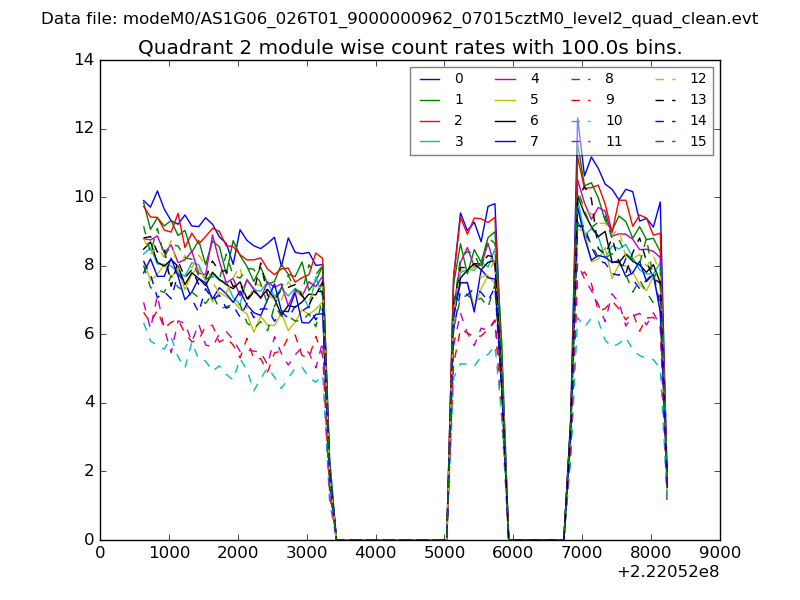
| Module-wise count rates for Quadrant B Data is divided into 100 sec bins |
 |
 |
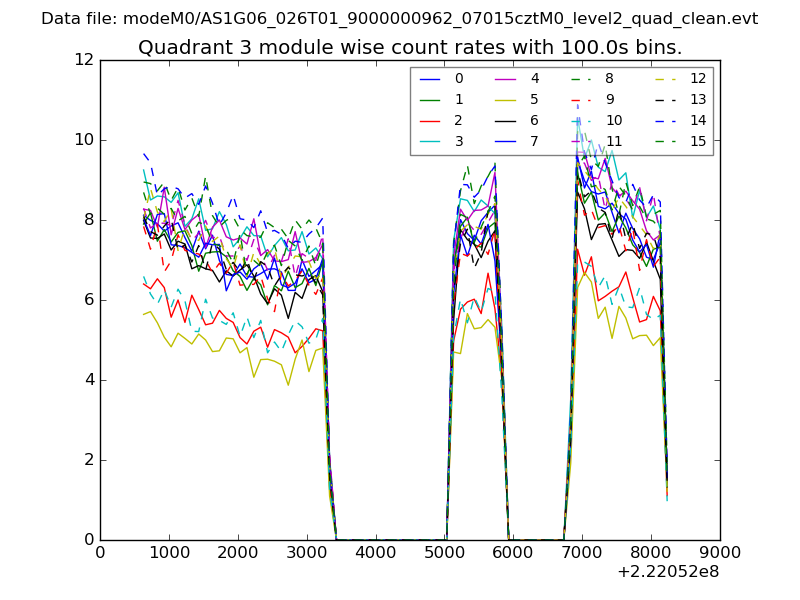
| Module-wise count rates for Quadrant C Data is divided into 100 sec bins |
 |
 |
| Module-wise count rates for Quadrant D Data is divided into 100 sec bins |
 |
 |
| Parameter | Plot |
|---|---|
| CZT HV Monitor |  |
| D_VDD | 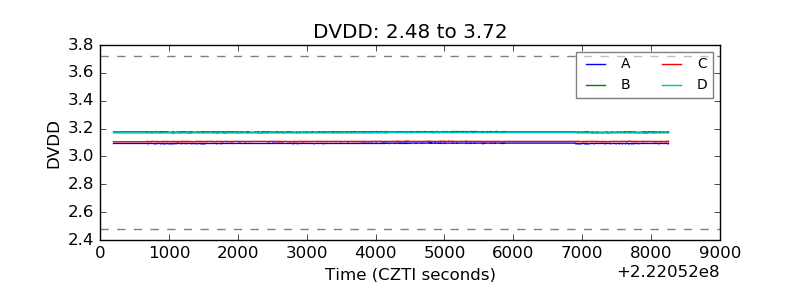 |
| Temperature 1 | 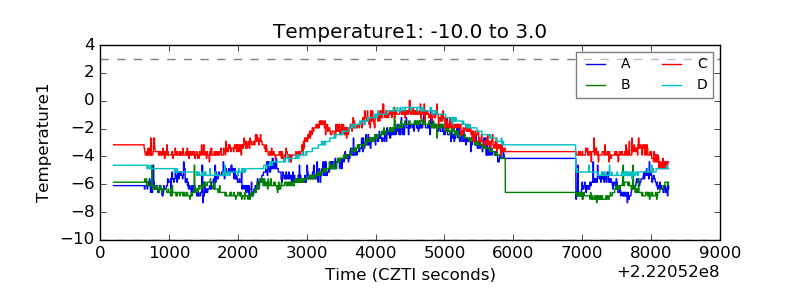 |
| Veto HV Monitor | 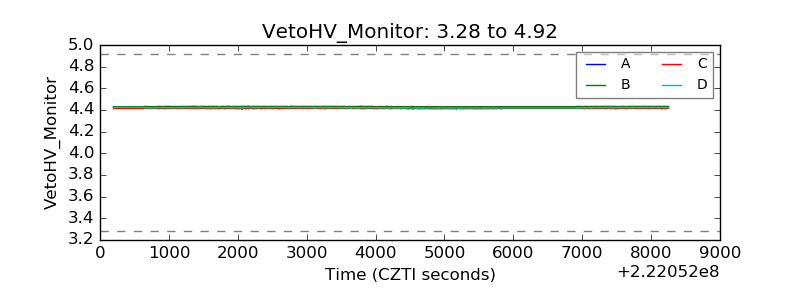 |
| Veto LLD | 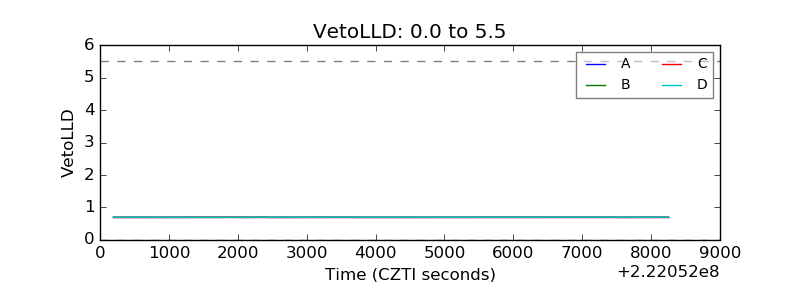 |
| Alpha Counter | 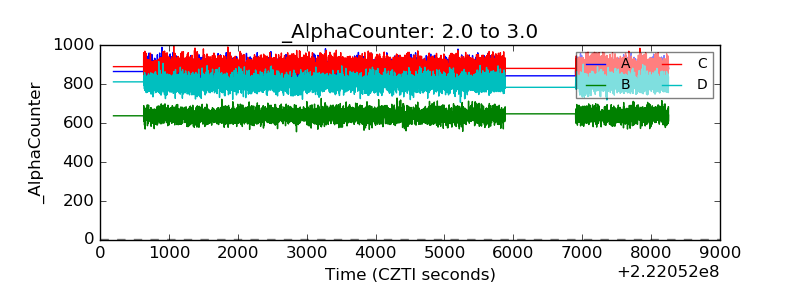 |
| _CPM_Rate | 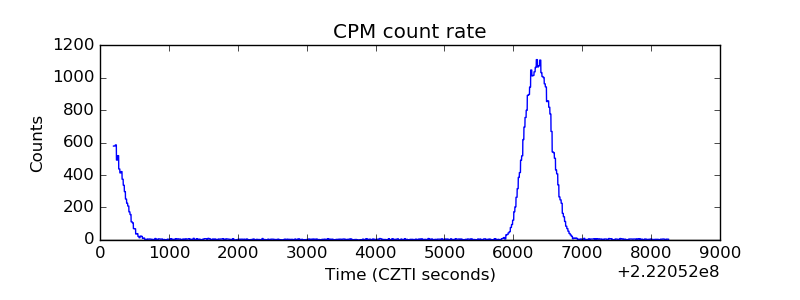 |
| CZT Counter | 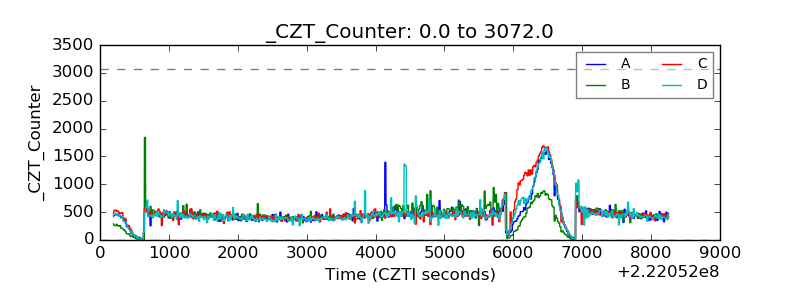 |
| +2.5 Volts monitor | 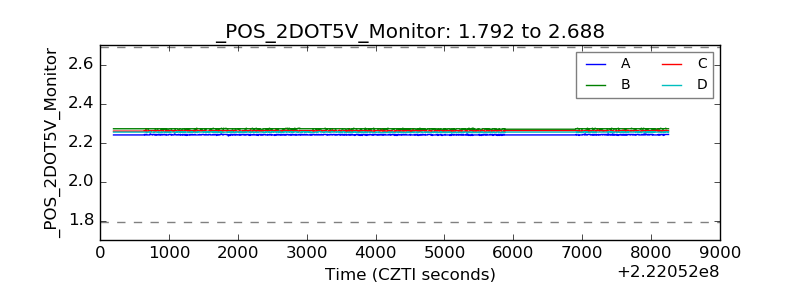 |
| +5 Volts monitor | 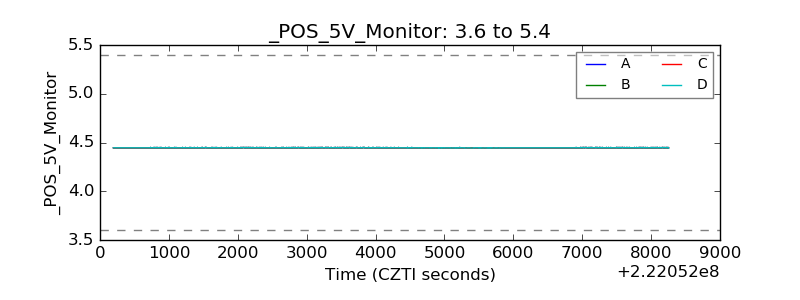 |
| _ROLL_ROT | 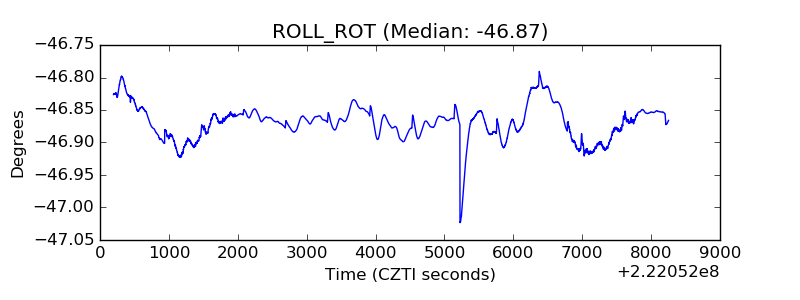 |
| _Roll_DEC | 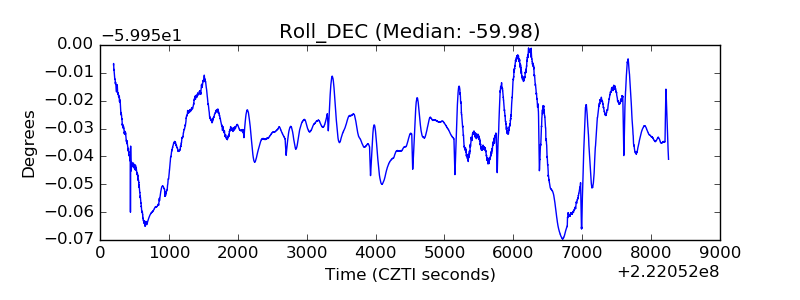 |
| _Roll_RA | 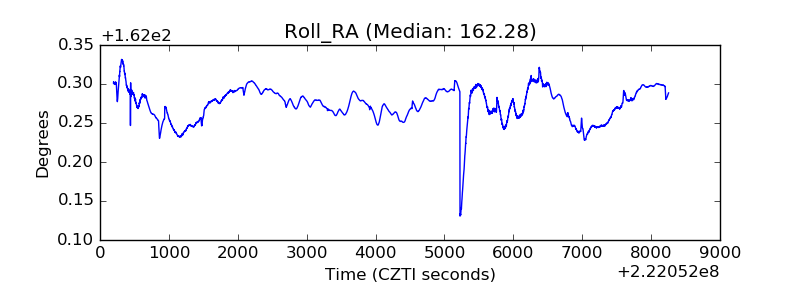 |
| Veto Counter | 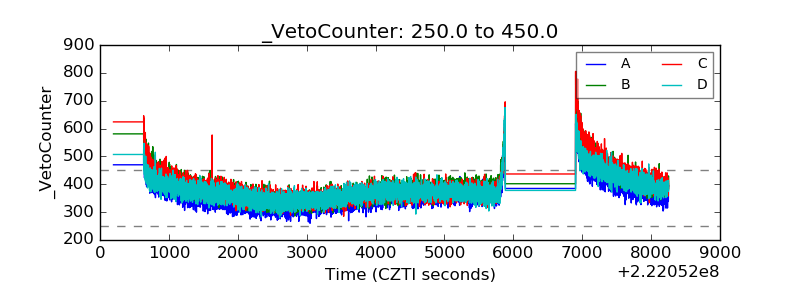 |