| Param | Original file | Final file |
|---|---|---|
| Filename | modeM0/AS1G06_026T01_9000000962_07017cztM0_level2.evt | modeM0/AS1G06_026T01_9000000962_07017cztM0_level2_quad_clean.evt |
| Size (bytes) | 412,295,040 | 94,501,440 |
| Size | 393.2 MB | 90.1 MB |
| Events in quadrant A | 2,957,156 | 604,731 |
| Events in quadrant B | 3,098,665 | 617,844 |
| Events in quadrant C | 2,954,137 | 610,628 |
| Events in quadrant D | 3,038,844 | 580,127 |
| Mode M9 | |||
|---|---|---|---|
| Quadrant | BADHDUFLAG | Total packets | Discarded packets |
| A | 0 | 12 | 0 |
| B | 0 | 12 | 0 |
| C | 0 | 12 | 0 |
| D | 0 | 13 | 0 |
| Mode M0 | |||
|---|---|---|---|
| Quadrant | BADHDUFLAG | Total packets | Discarded packets |
| A | 0 | 13086 | 3 |
| B | 0 | 13352 | 2 |
| C | 0 | 13140 | 2 |
| D | 0 | 13378 | 2 |
| Mode SS | |||
|---|---|---|---|
| Quadrant | BADHDUFLAG | Total packets | Discarded packets |
| A | 0 | 130 | 0 |
| B | 0 | 130 | 0 |
| C | 0 | 130 | 0 |
| D | 0 | 130 | 0 |
| Quadrant | Total seconds | Saturated seconds | Saturation percentage |
|---|---|---|---|
| A | 6432 | 13 | 0.202114% |
| B | 6432 | 20 | 0.310945% |
| C | 6432 | 15 | 0.233209% |
| D | 6432 | 19 | 0.295398% |
Noise dominated data is calculated using 1-second bins in cleaned event files. If a bin has >2000 counts, and if more than 50% of those come from <1% of pixels, then it is considered to be noise-dominated and hence unusable.
| Quadrant | # 1 sec bins | Bins with >0 counts | Bins with >2000 counts | High rate bins dominated by noise | Noise dominated (total time) | Noise dominated (detector-on time) | Marked lightcurve |
|---|---|---|---|---|---|---|---|
| A | 7577 | 6433 | 0 | 0 | 0.00% | 0.00% | 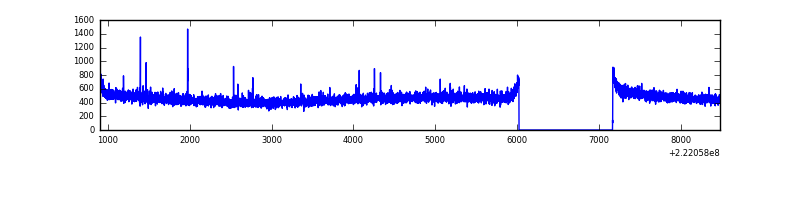 |
| B | 7577 | 6433 | 1 | 1 | 0.01% | 0.02% | 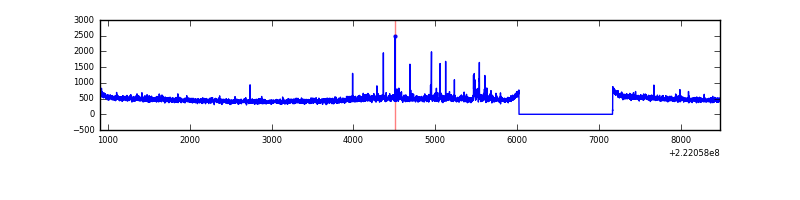 |
| C | 7577 | 6433 | 0 | 0 | 0.00% | 0.00% | 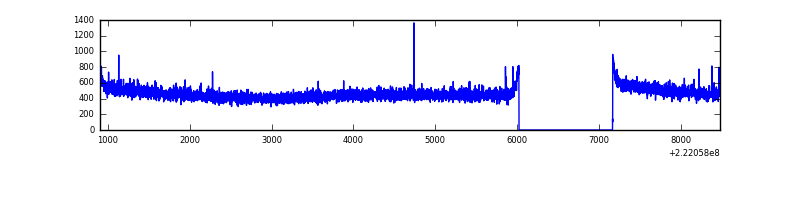 |
| D | 7577 | 6433 | 8 | 8 | 0.11% | 0.12% | 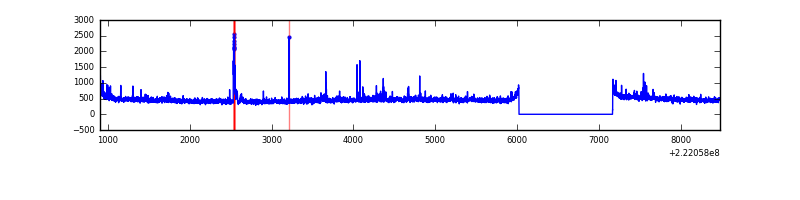 |
Top three noisy pixels from each quadrant. If the there are fewer than three noisy pixels in the level2.evt file, extra rows are filled as -1
| Pixel properties | Quadrant properties | ||||||
|---|---|---|---|---|---|---|---|
| Quadrant | DetID | PixID | Counts | Sigma | Mean | Median | Sigma |
| A | 13 | 14 | 15994 | 98.87 | 760 | 745 | 154.2 |
| A | 13 | 248 | 13402 | 82.06 | 760 | 745 | 154.2 |
| A | 0 | 226 | 7433 | 43.36 | 760 | 745 | 154.2 |
| B | 0 | 214 | 59720 | 404.42 | 770 | 750 | 145.8 |
| B | 0 | 199 | 22480 | 149.03 | 770 | 750 | 145.8 |
| B | 12 | 111 | 14089 | 91.48 | 770 | 750 | 145.8 |
| C | 12 | 4 | 8776 | 46.01 | 754 | 759 | 174.2 |
| C | 13 | 61 | 5832 | 29.12 | 754 | 759 | 174.2 |
| C | 14 | 67 | 2399 | 9.41 | 754 | 759 | 174.2 |
| D | 8 | 195 | 110450 | 600.05 | 748 | 724 | 182.9 |
| D | 2 | 33 | 42187 | 226.74 | 748 | 724 | 182.9 |
| D | 2 | 14 | 34430 | 184.32 | 748 | 724 | 182.9 |
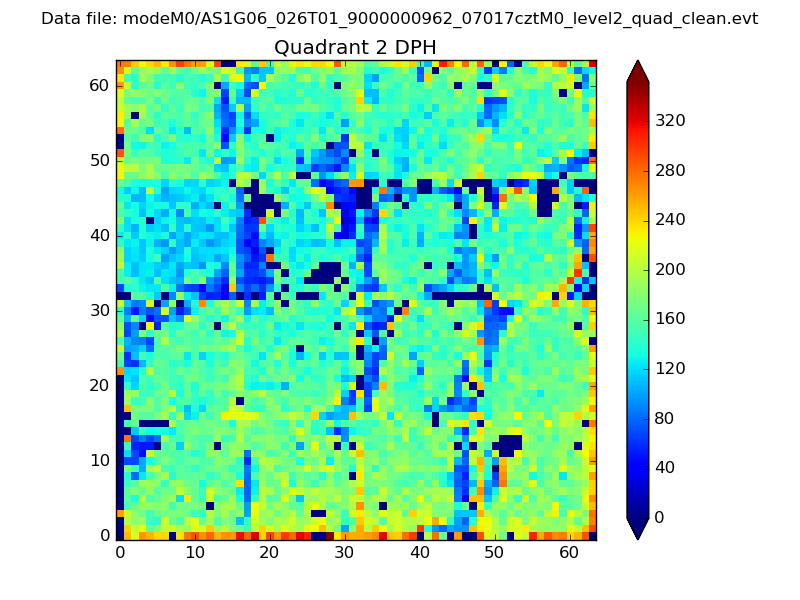
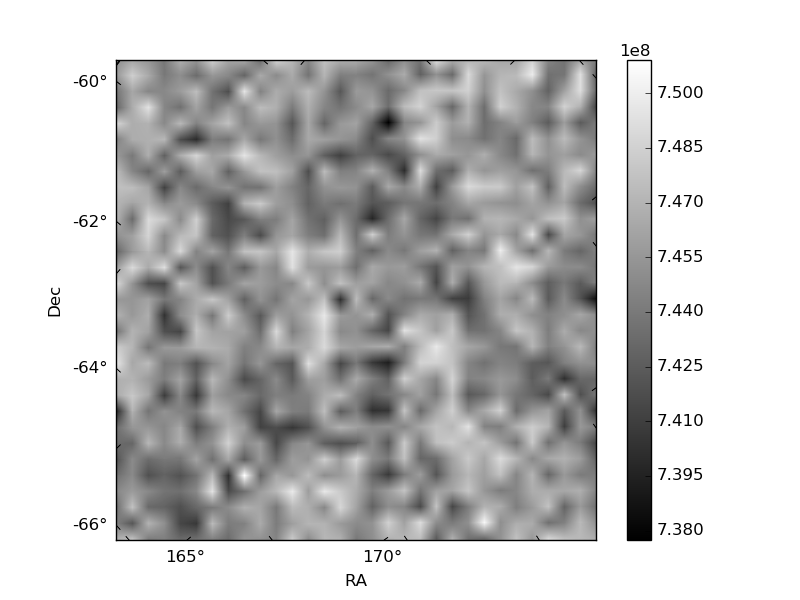
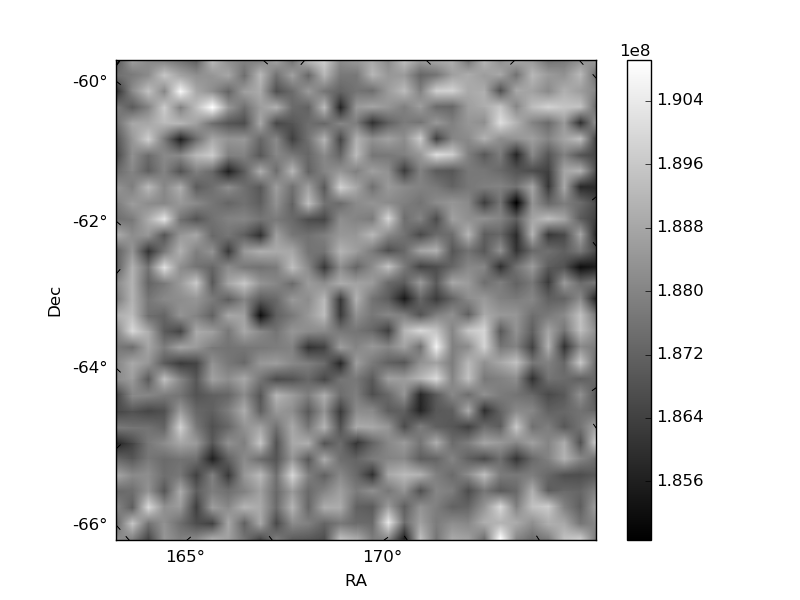
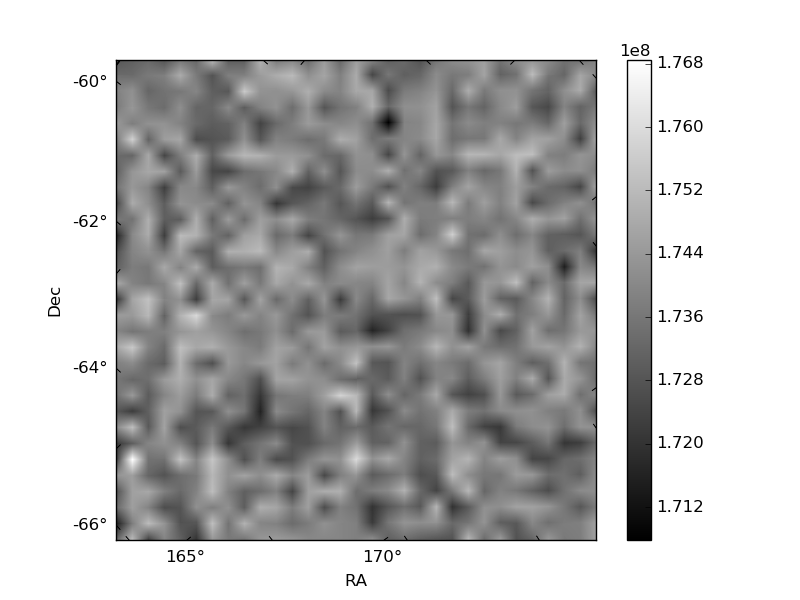
Histogram calculated using DETX and DETY for each event in the final _common_clean file
| Quadrant A | 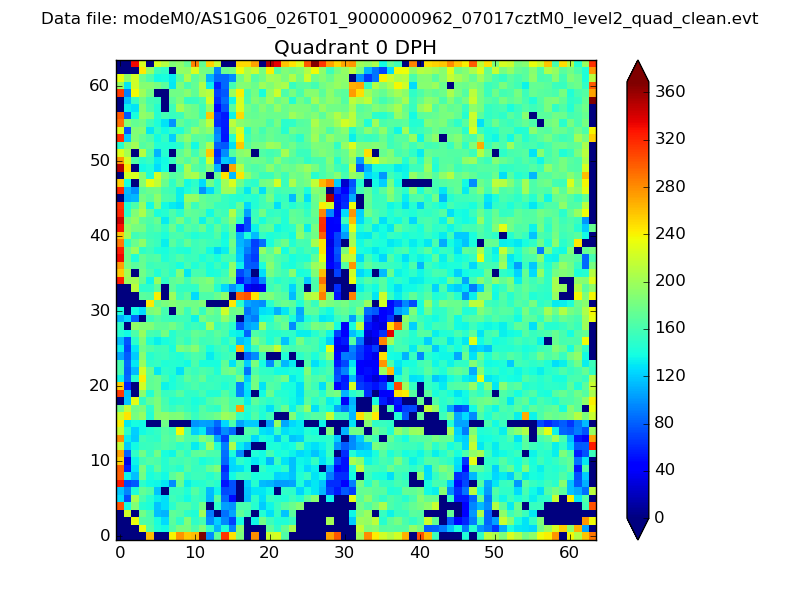 |
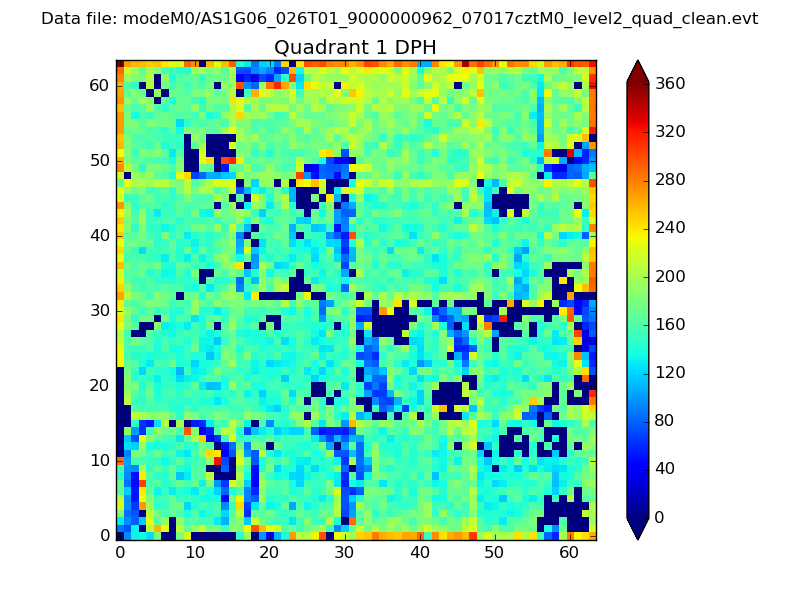 |
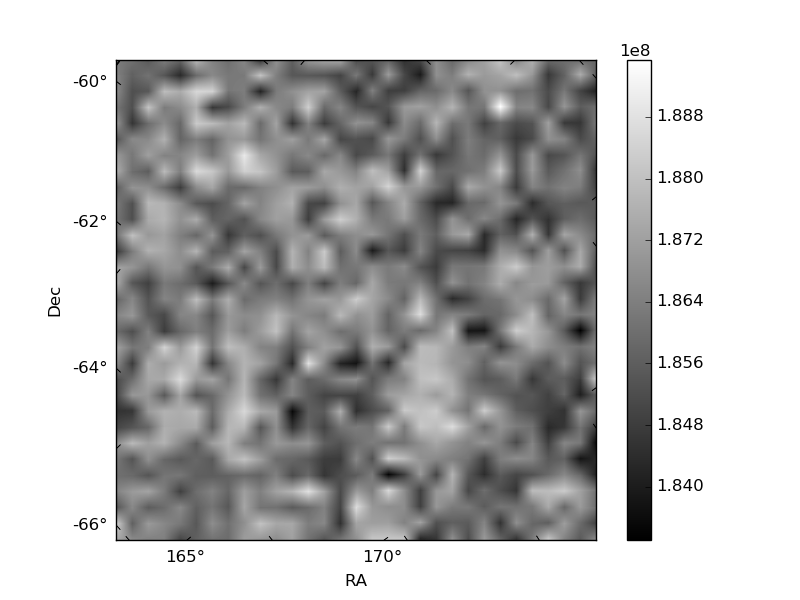
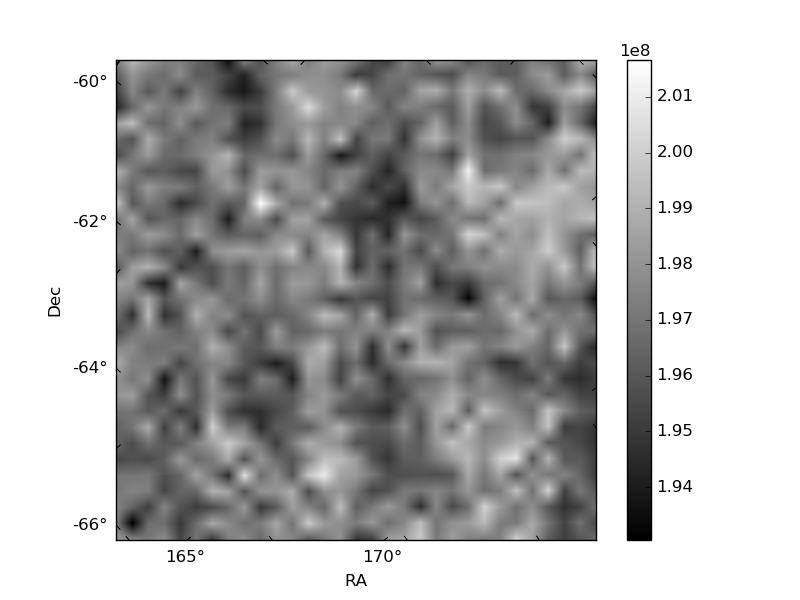
Quadrant B |
|---|---|---|---|
| Quadrant D | 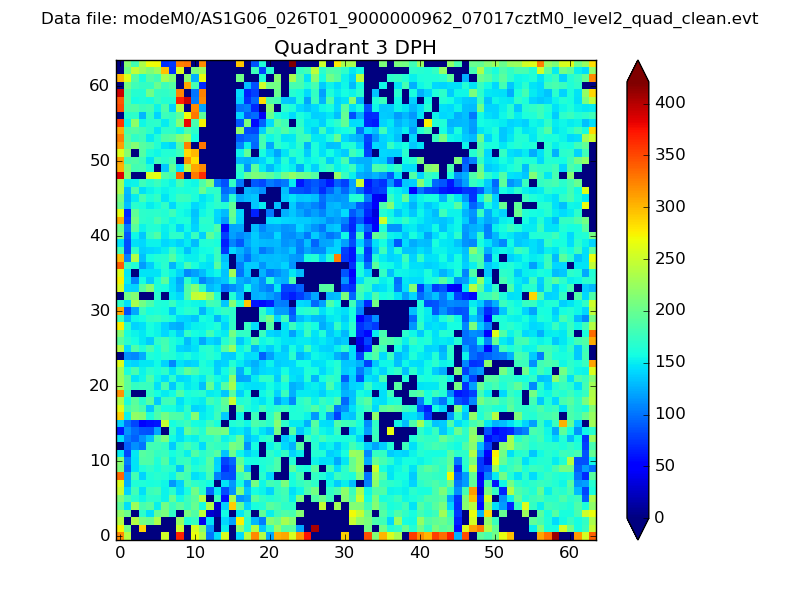 |
 |
Quadrant C |
| Plot type | Count rate plots | Images |
|---|---|---|
| Comparison with Poisson distribution Blue bars denote a histogram of data divided into 1 sec bins. Red curve is a Poisson curve with rate = median count rate of data. |
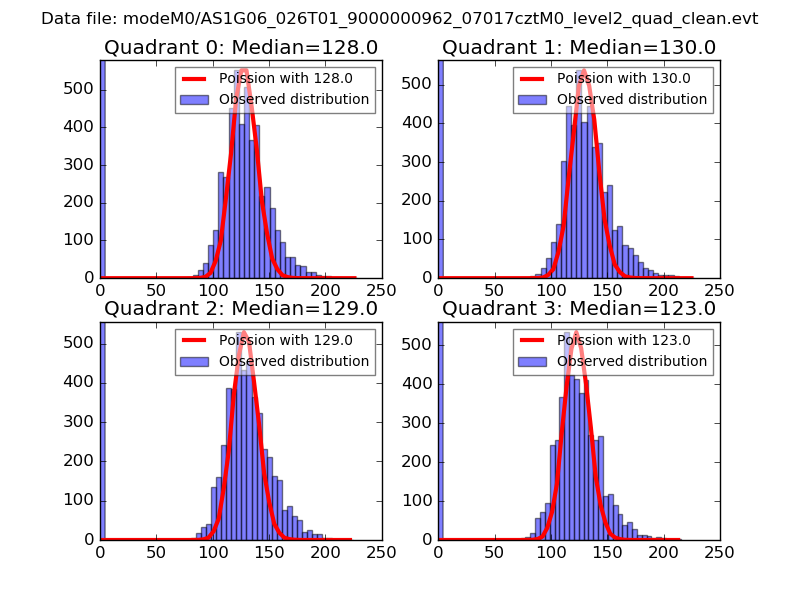 |
 |
| Quadrant-wise count rates Data is divided into 100 sec bins |
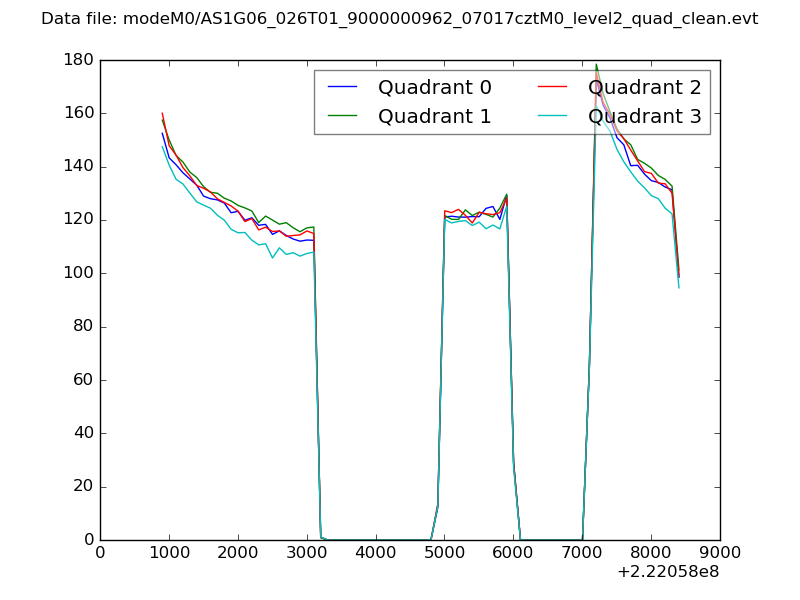 |
|
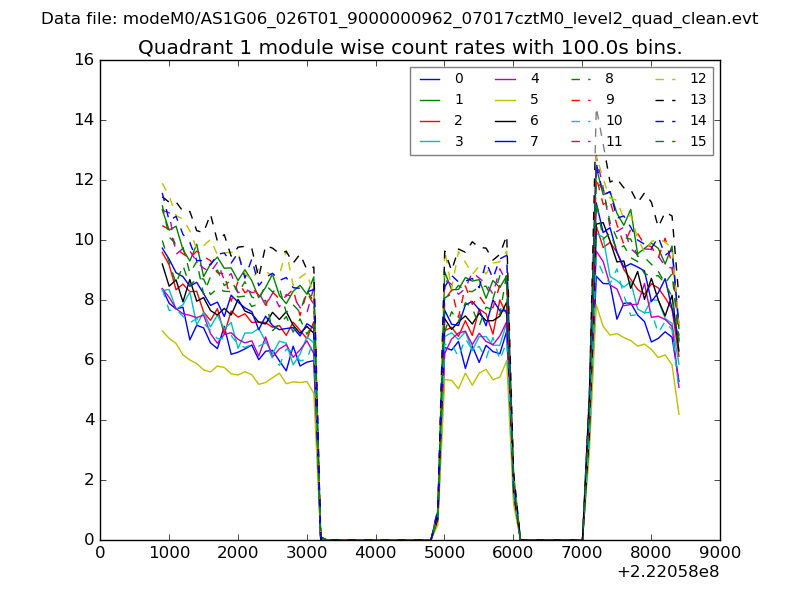
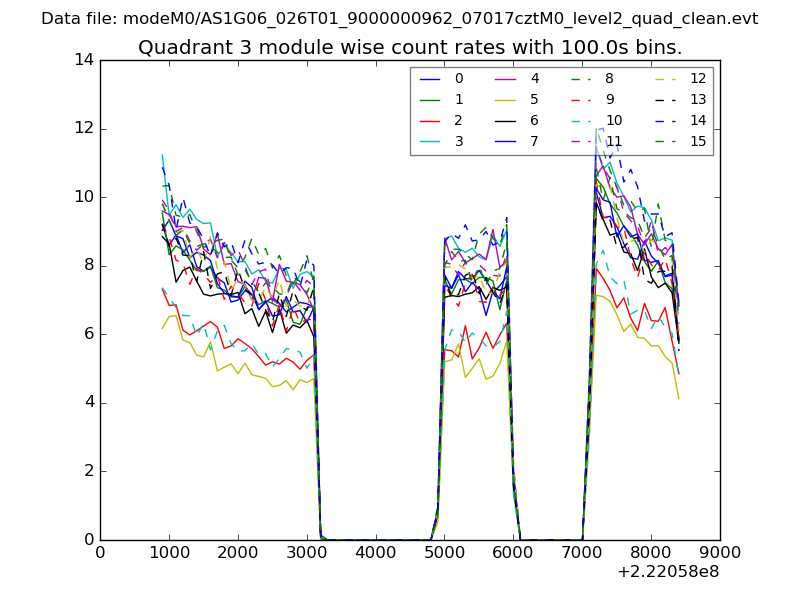
| Module-wise count rates for Quadrant A Data is divided into 100 sec bins |
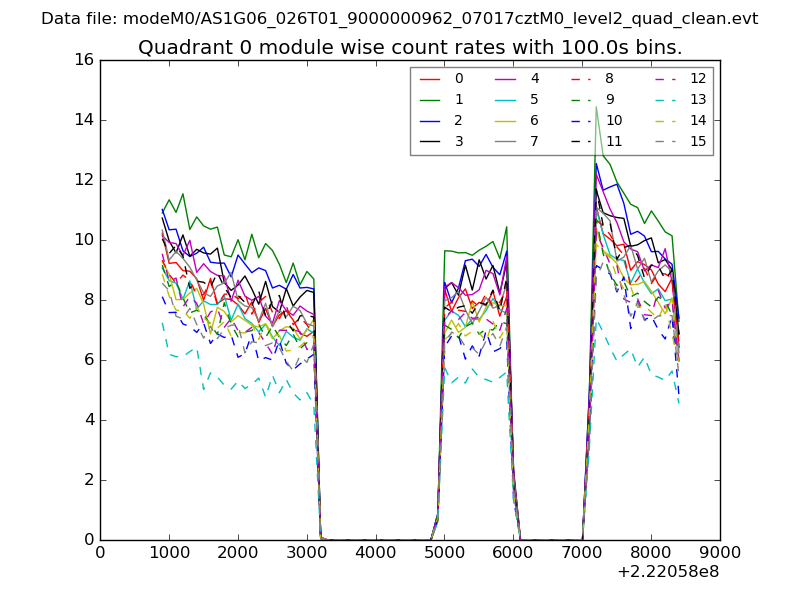 |
 |
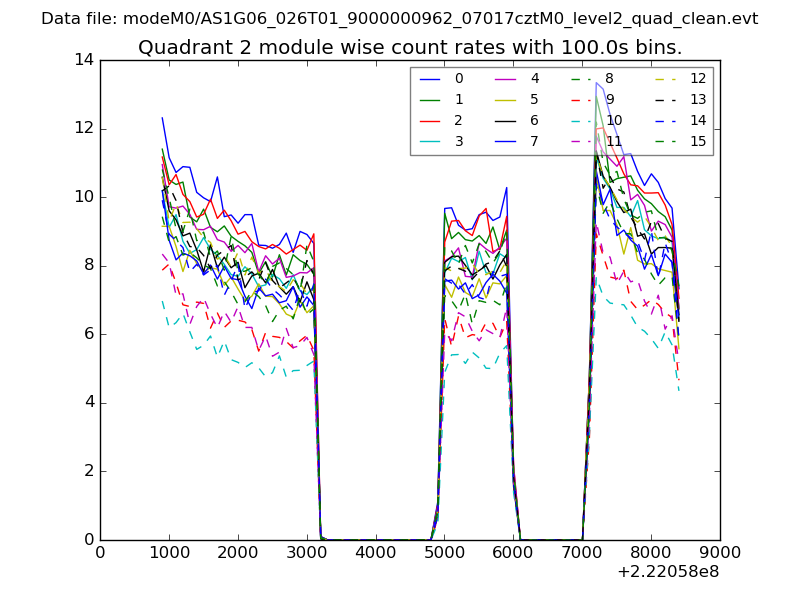
| Module-wise count rates for Quadrant B Data is divided into 100 sec bins |
 |
 |
| Module-wise count rates for Quadrant C Data is divided into 100 sec bins |
 |
 |
| Module-wise count rates for Quadrant D Data is divided into 100 sec bins |
 |
 |
| Parameter | Plot |
|---|---|
| CZT HV Monitor | 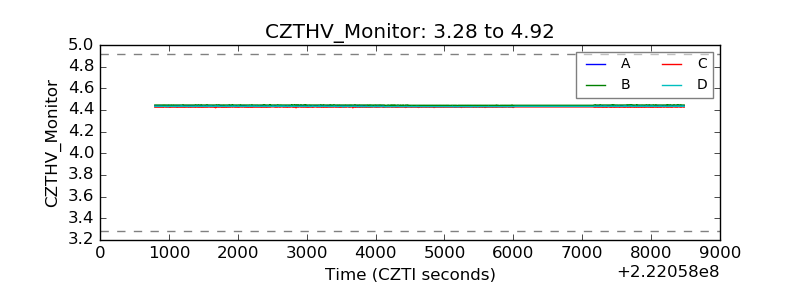 |
| D_VDD | 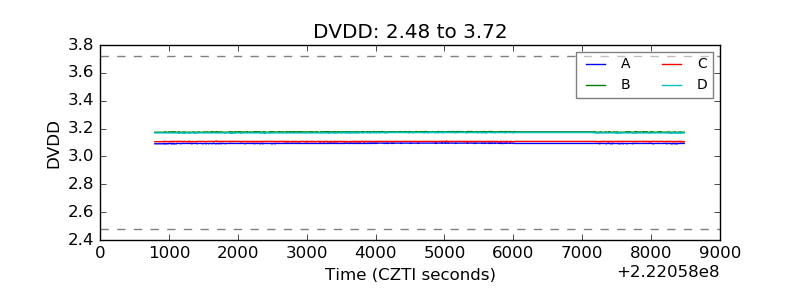 |
| Temperature 1 |  |
| Veto HV Monitor | 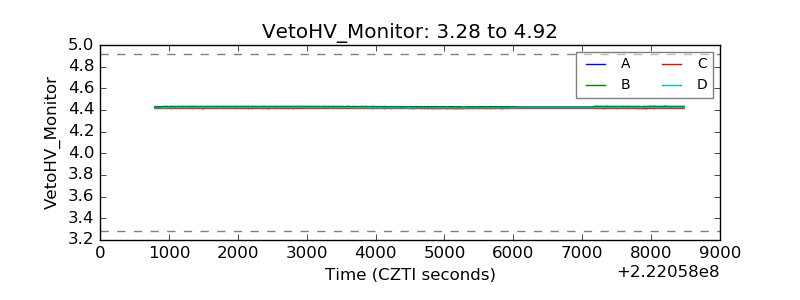 |
| Veto LLD | 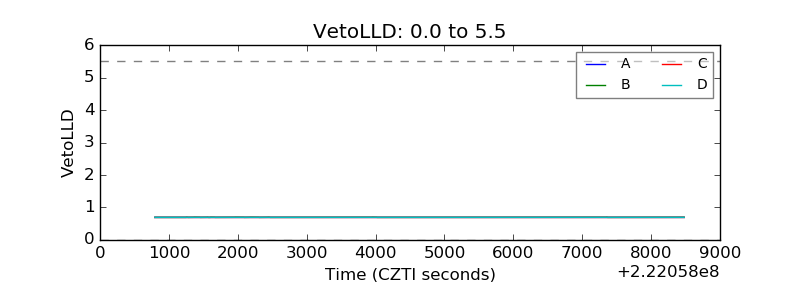 |
| Alpha Counter | 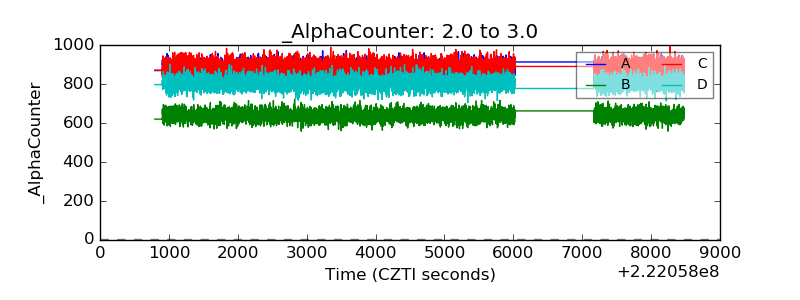 |
| _CPM_Rate | 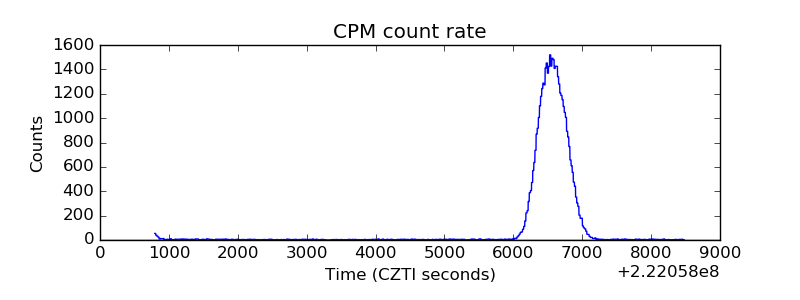 |
| CZT Counter | 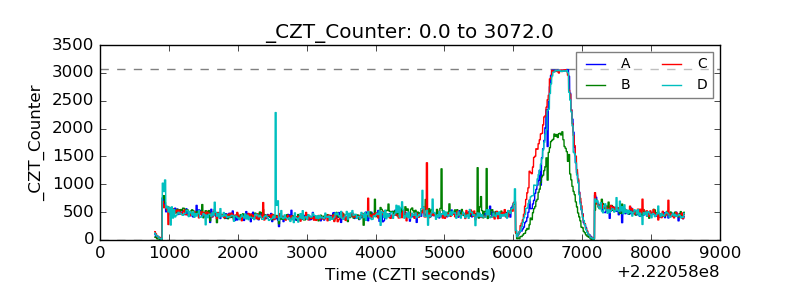 |
| +2.5 Volts monitor | 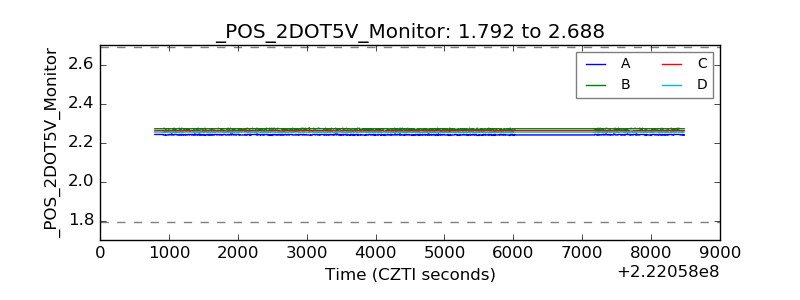 |
| +5 Volts monitor | 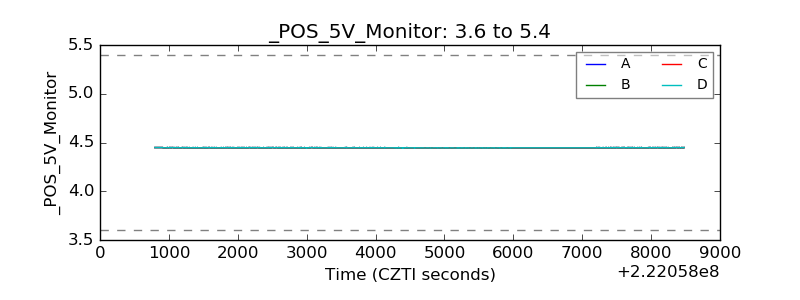 |
| _ROLL_ROT | 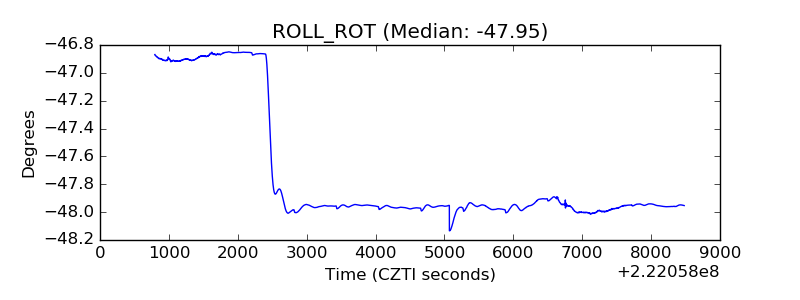 |
| _Roll_DEC | 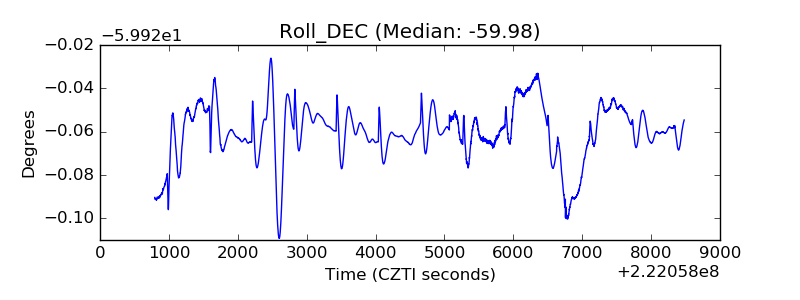 |
| _Roll_RA | 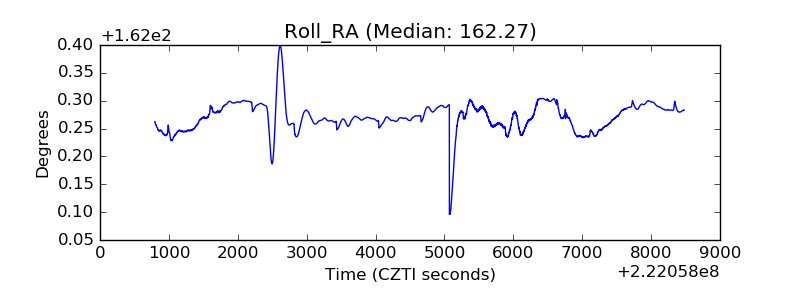 |
| Veto Counter | 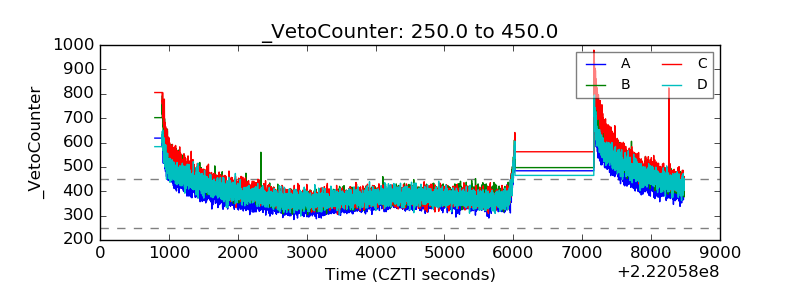 |