| Param | Original file | Final file |
|---|---|---|
| Filename | modeM0/AS1G06_026T01_9000000962_07018cztM0_level2.evt | modeM0/AS1G06_026T01_9000000962_07018cztM0_level2_quad_clean.evt |
| Size (bytes) | 431,501,760 | 98,167,680 |
| Size | 411.5 MB | 93.6 MB |
| Events in quadrant A | 3,018,967 | 634,598 |
| Events in quadrant B | 3,159,041 | 648,622 |
| Events in quadrant C | 3,033,452 | 640,582 |
| Events in quadrant D | 3,424,588 | 605,885 |
| Mode M9 | |||
|---|---|---|---|
| Quadrant | BADHDUFLAG | Total packets | Discarded packets |
| A | 0 | 12 | 0 |
| B | 0 | 12 | 0 |
| C | 0 | 12 | 0 |
| D | 0 | 13 | 0 |
| Mode M0 | |||
|---|---|---|---|
| Quadrant | BADHDUFLAG | Total packets | Discarded packets |
| A | 0 | 13062 | 3 |
| B | 0 | 13343 | 2 |
| C | 0 | 13159 | 2 |
| D | 0 | 14224 | 2 |
| Mode SS | |||
|---|---|---|---|
| Quadrant | BADHDUFLAG | Total packets | Discarded packets |
| A | 0 | 130 | 0 |
| B | 0 | 130 | 0 |
| C | 0 | 130 | 0 |
| D | 0 | 130 | 0 |
| Quadrant | Total seconds | Saturated seconds | Saturation percentage |
|---|---|---|---|
| A | 6349 | 50 | 0.787526% |
| B | 6349 | 48 | 0.756025% |
| C | 6349 | 56 | 0.882029% |
| D | 6349 | 99 | 1.559301% |
Noise dominated data is calculated using 1-second bins in cleaned event files. If a bin has >2000 counts, and if more than 50% of those come from <1% of pixels, then it is considered to be noise-dominated and hence unusable.
| Quadrant | # 1 sec bins | Bins with >0 counts | Bins with >2000 counts | High rate bins dominated by noise | Noise dominated (total time) | Noise dominated (detector-on time) | Marked lightcurve |
|---|---|---|---|---|---|---|---|
| A | 7554 | 6350 | 0 | 0 | 0.00% | 0.00% | 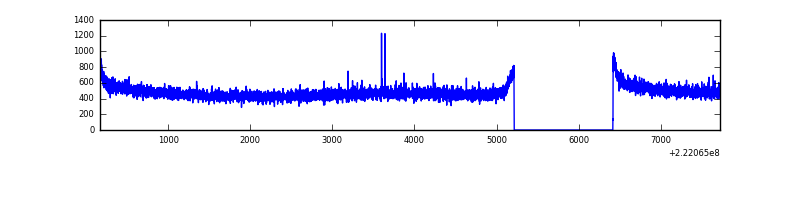 |
| B | 7554 | 6350 | 2 | 2 | 0.03% | 0.03% | 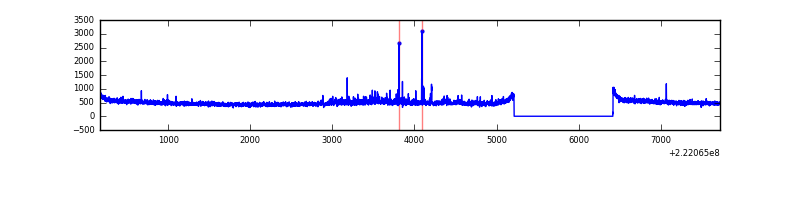 |
| C | 7554 | 6350 | 0 | 0 | 0.00% | 0.00% | 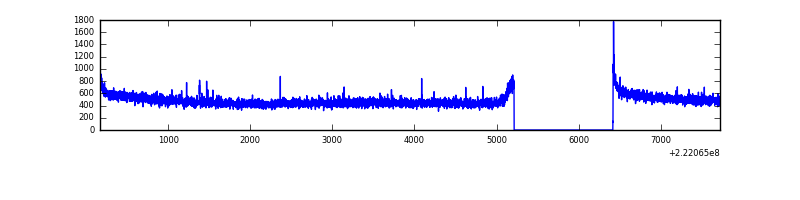 |
| D | 7554 | 6350 | 41 | 41 | 0.54% | 0.65% | 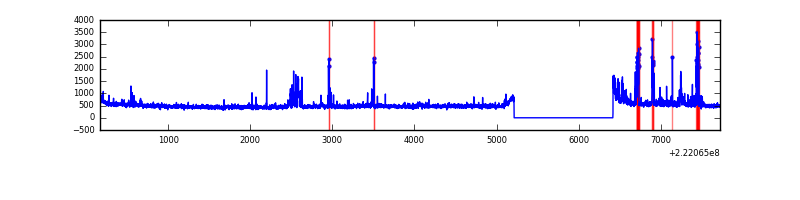 |
Top three noisy pixels from each quadrant. If the there are fewer than three noisy pixels in the level2.evt file, extra rows are filled as -1
| Pixel properties | Quadrant properties | ||||||
|---|---|---|---|---|---|---|---|
| Quadrant | DetID | PixID | Counts | Sigma | Mean | Median | Sigma |
| A | 13 | 14 | 15805 | 95.52 | 779 | 761 | 157.5 |
| A | 0 | 226 | 7677 | 43.91 | 779 | 761 | 157.5 |
| A | 12 | 194 | 7131 | 40.44 | 779 | 761 | 157.5 |
| B | 0 | 214 | 84710 | 575.91 | 787 | 769 | 145.8 |
| B | 12 | 111 | 14123 | 91.62 | 787 | 769 | 145.8 |
| B | 11 | 111 | 11053 | 70.56 | 787 | 769 | 145.8 |
| C | 12 | 4 | 7255 | 36.42 | 775 | 778 | 177.9 |
| C | 13 | 61 | 6096 | 29.9 | 775 | 778 | 177.9 |
| C | 3 | 202 | 2098 | 7.42 | 775 | 778 | 177.9 |
| D | 8 | 195 | 147126 | 781.77 | 767 | 743 | 187.2 |
| D | 12 | 233 | 123490 | 655.54 | 767 | 743 | 187.2 |
| D | 9 | 68 | 106894 | 566.9 | 767 | 743 | 187.2 |
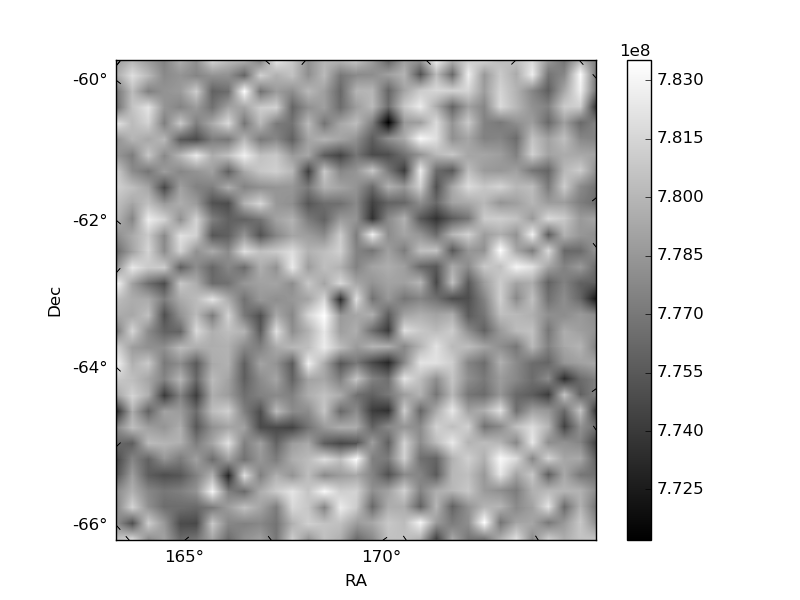
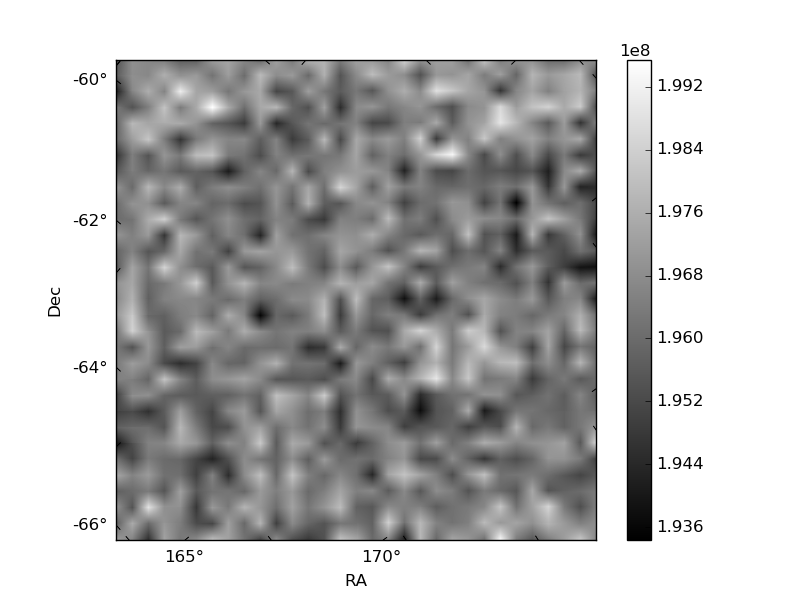
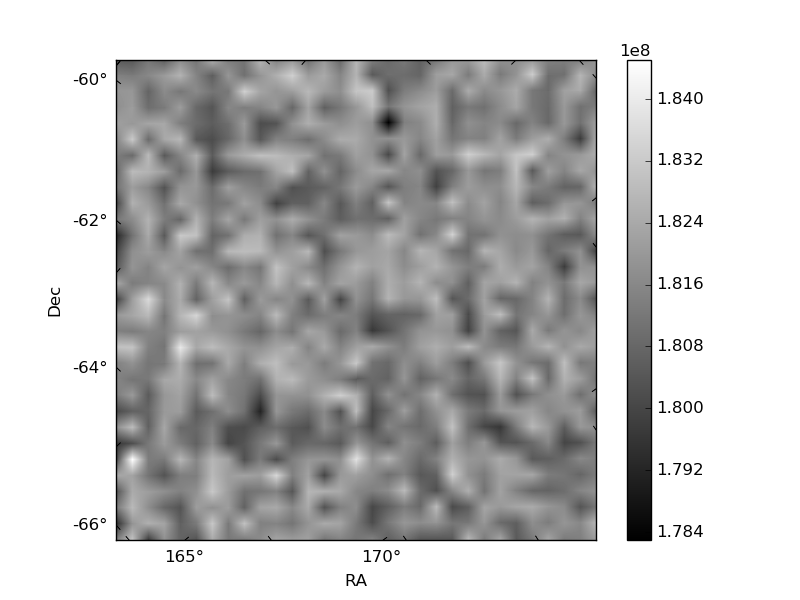
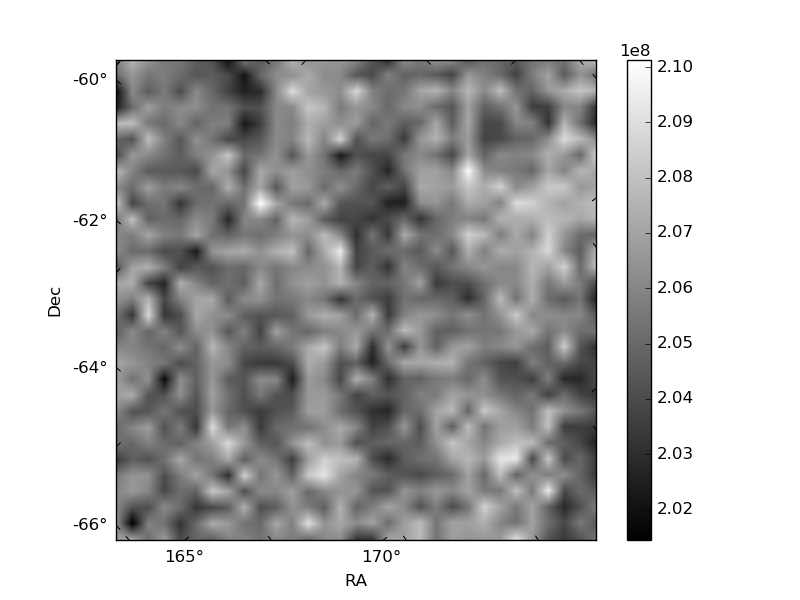
Histogram calculated using DETX and DETY for each event in the final _common_clean file
| Quadrant A | 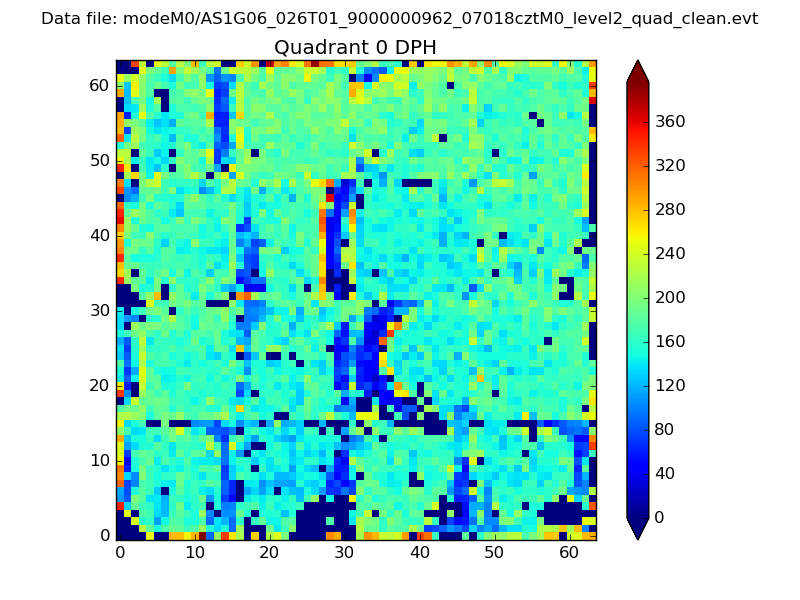 |
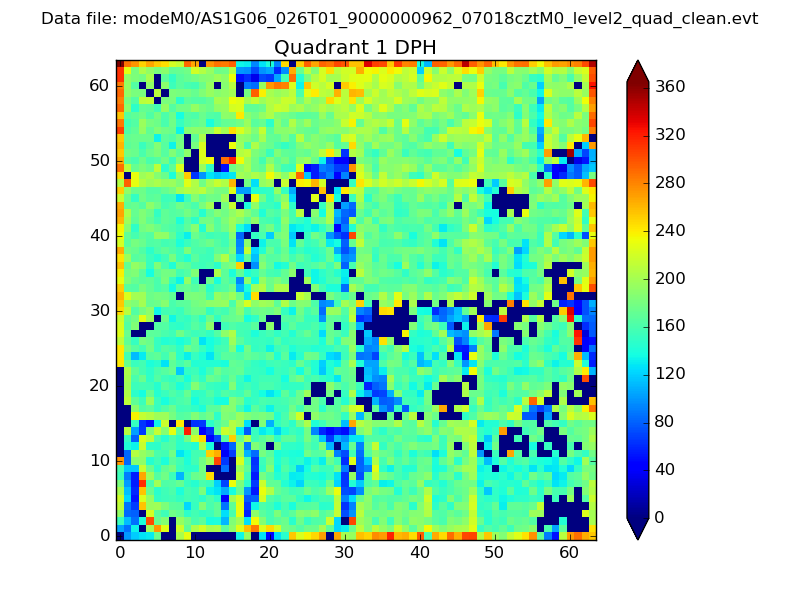 |
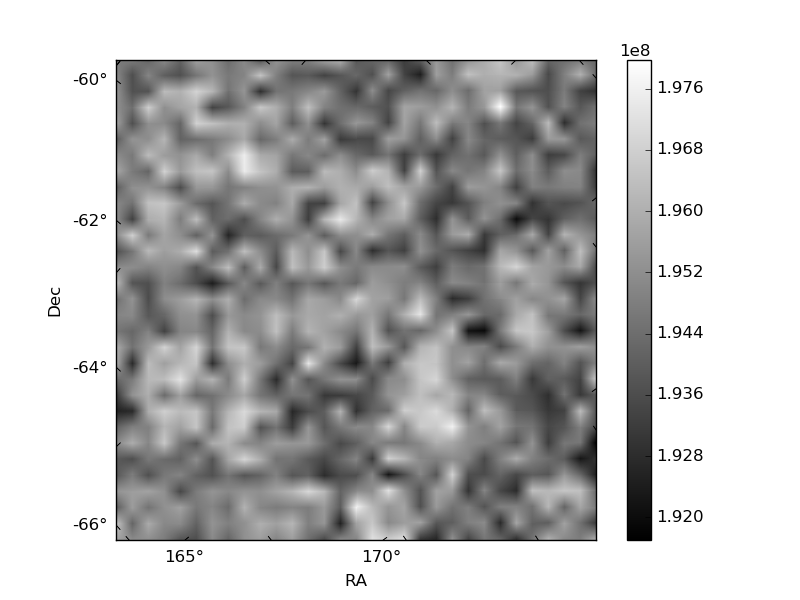
Quadrant B |
|---|---|---|---|
| Quadrant D | 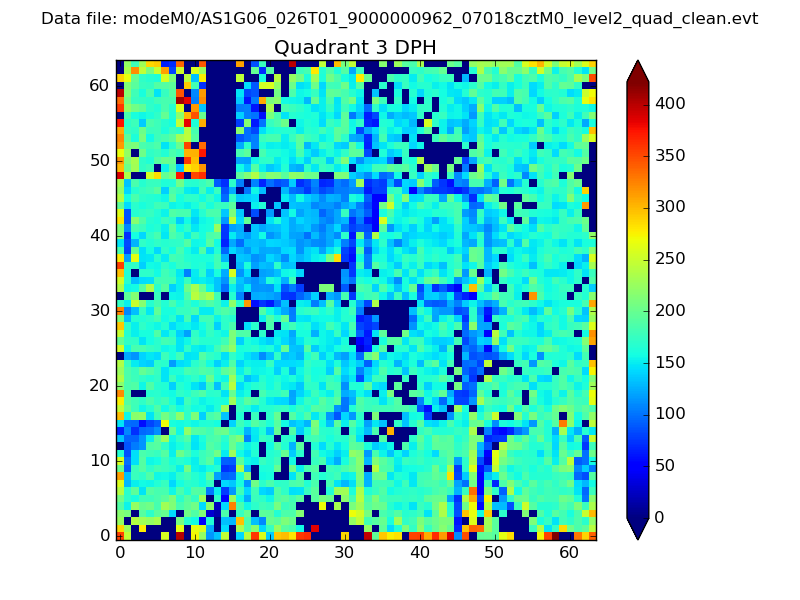 |
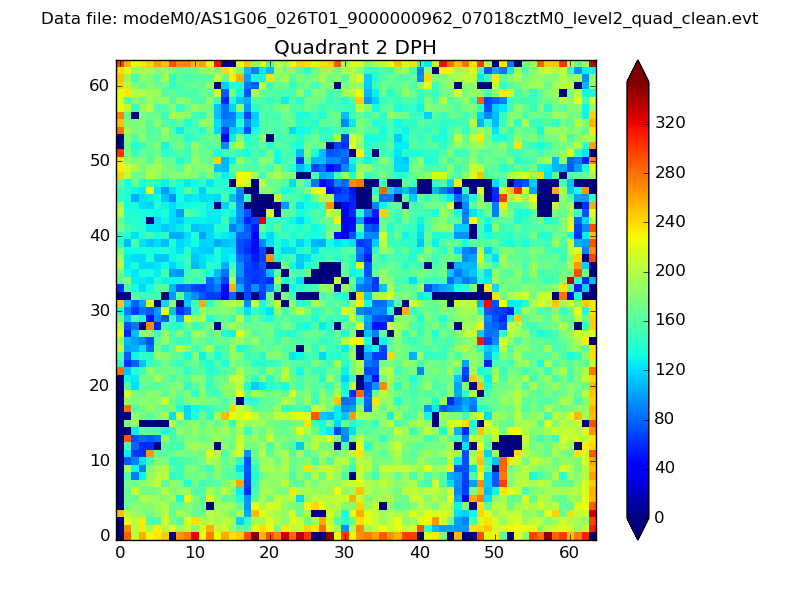 |
Quadrant C |
| Plot type | Count rate plots | Images |
|---|---|---|
| Comparison with Poisson distribution Blue bars denote a histogram of data divided into 1 sec bins. Red curve is a Poisson curve with rate = median count rate of data. |
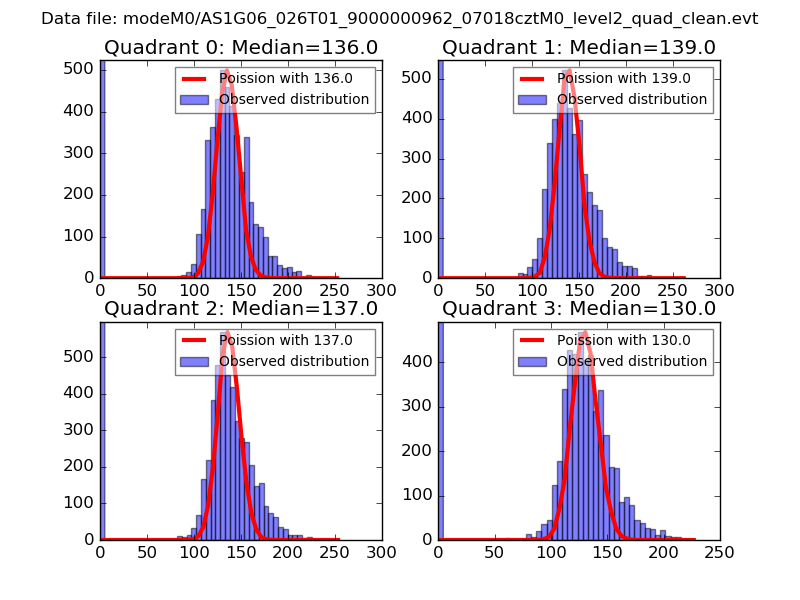 |
 |
| Quadrant-wise count rates Data is divided into 100 sec bins |
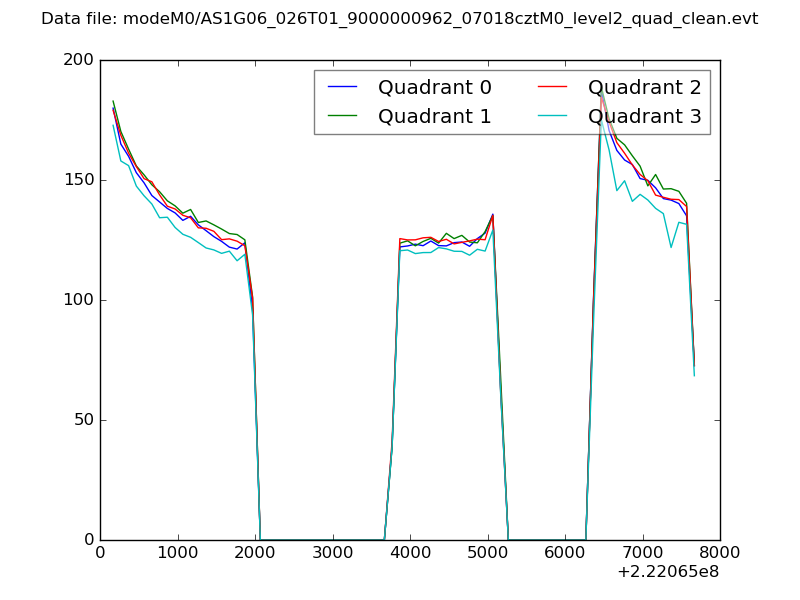 |
|
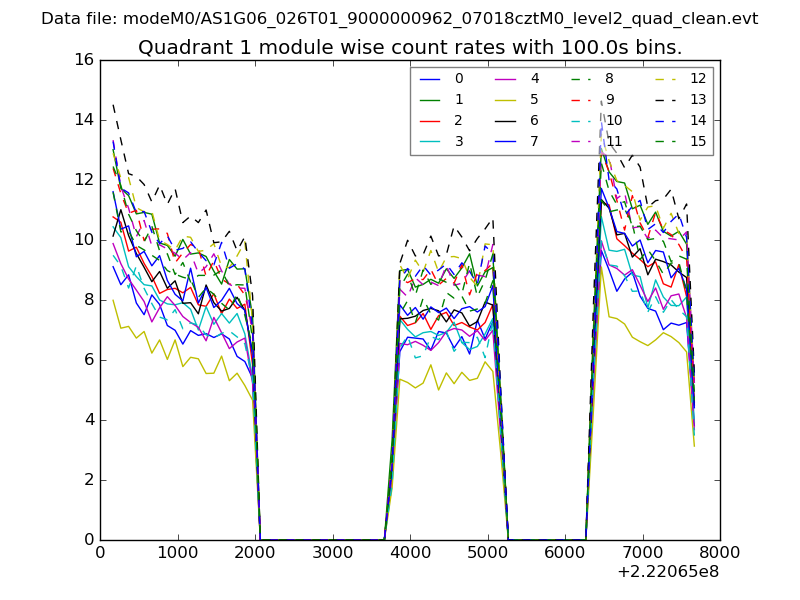
| Module-wise count rates for Quadrant A Data is divided into 100 sec bins |
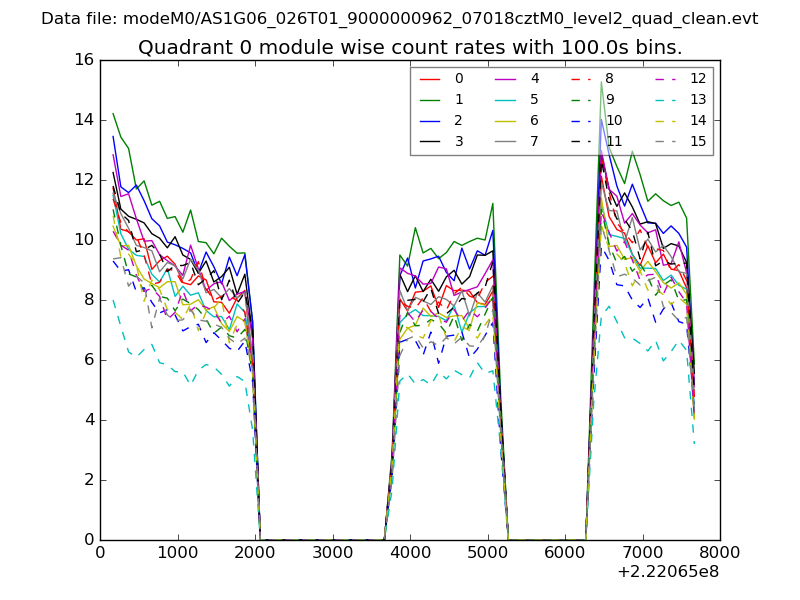 |
 |
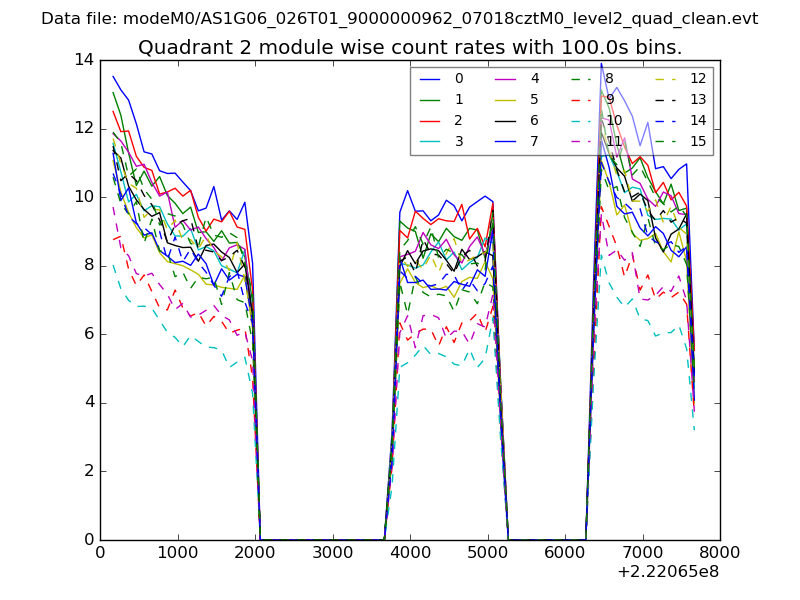
| Module-wise count rates for Quadrant B Data is divided into 100 sec bins |
 |
 |
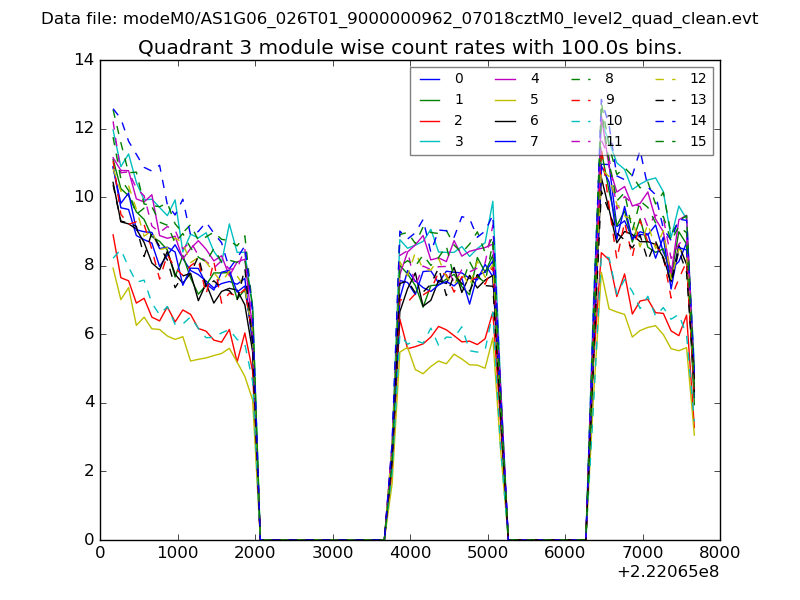
| Module-wise count rates for Quadrant C Data is divided into 100 sec bins |
 |
 |
| Module-wise count rates for Quadrant D Data is divided into 100 sec bins |
 |
 |
| Parameter | Plot |
|---|---|
| CZT HV Monitor | 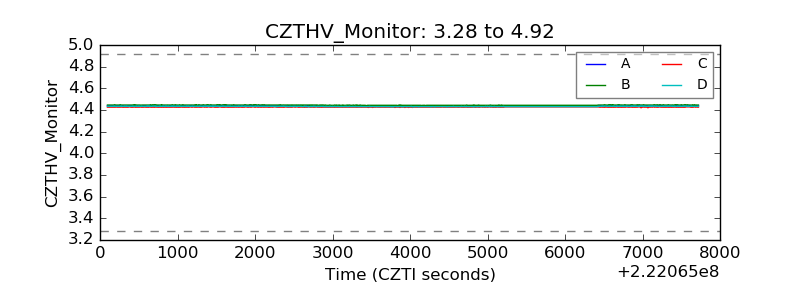 |
| D_VDD | 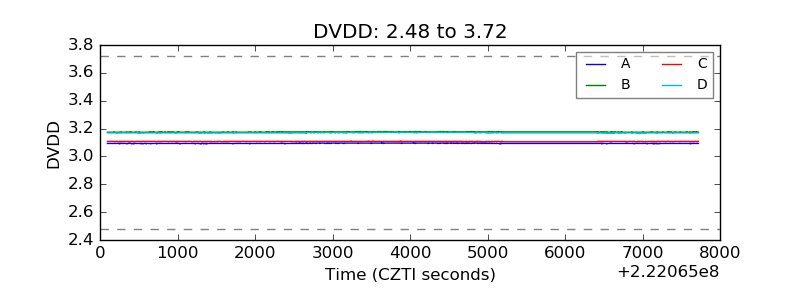 |
| Temperature 1 | 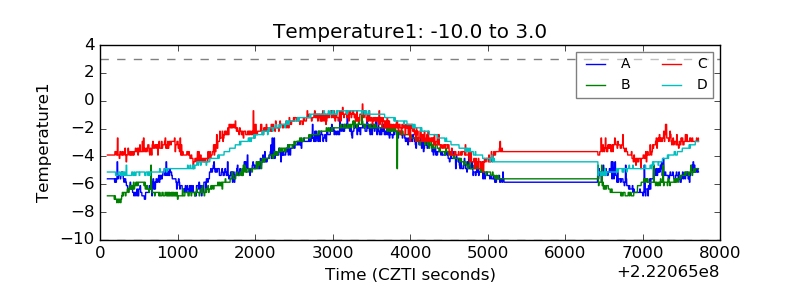 |
| Veto HV Monitor | 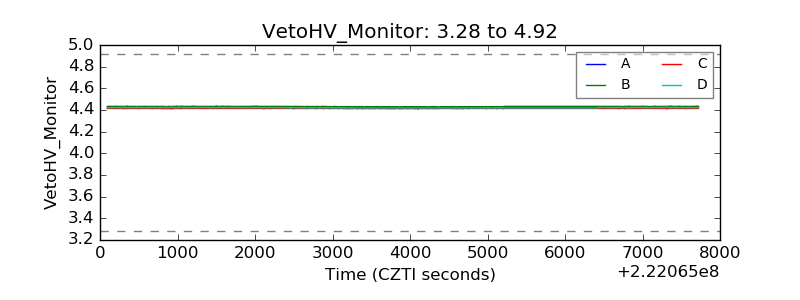 |
| Veto LLD | 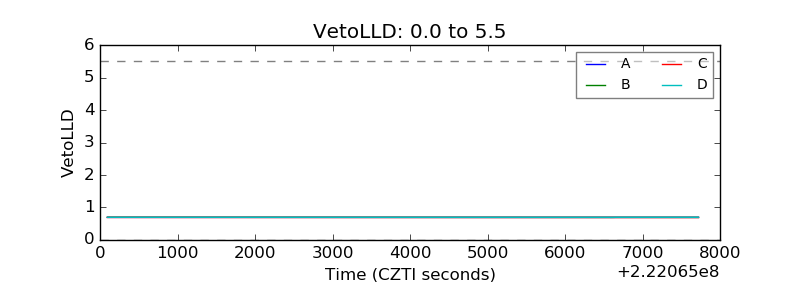 |
| Alpha Counter | 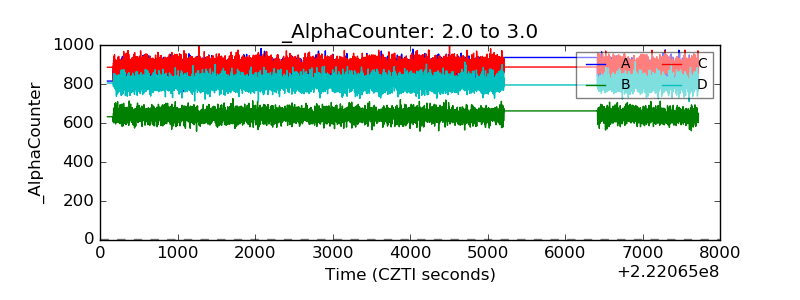 |
| _CPM_Rate | 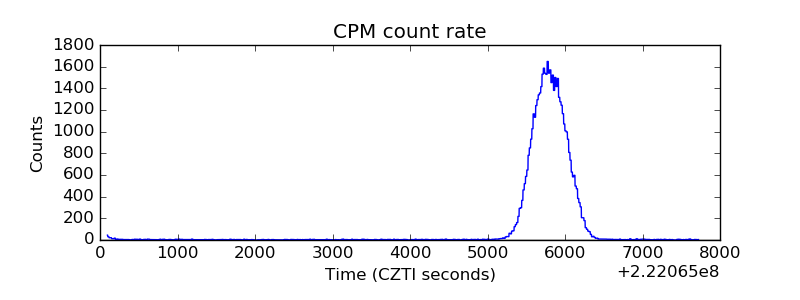 |
| CZT Counter | 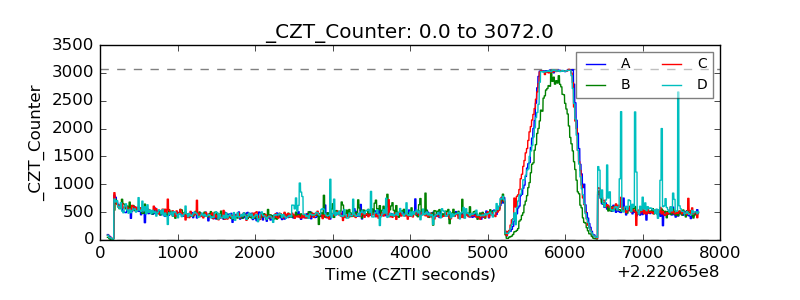 |
| +2.5 Volts monitor | 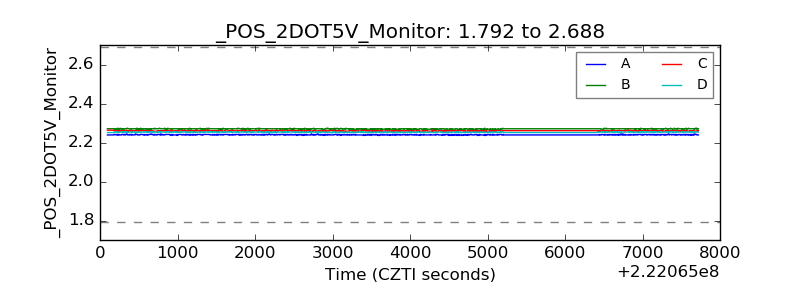 |
| +5 Volts monitor |  |
| _ROLL_ROT |  |
| _Roll_DEC | 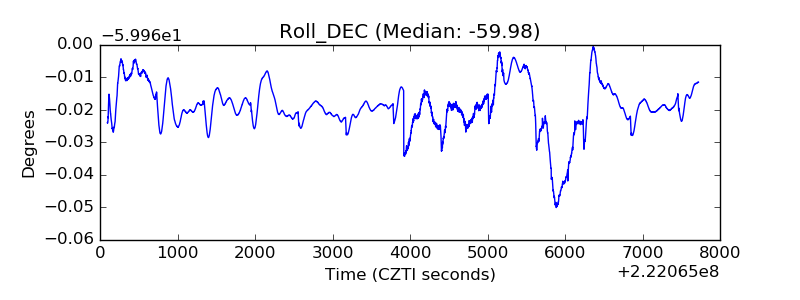 |
| _Roll_RA | 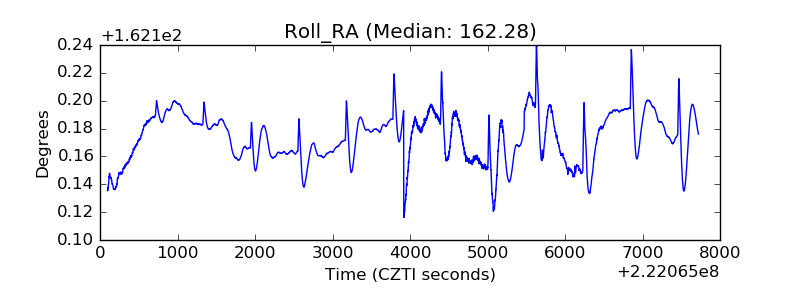 |
| Veto Counter | 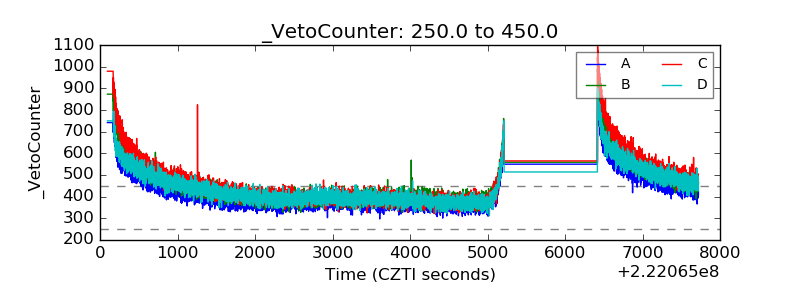 |