| Param | Original file | Final file |
|---|---|---|
| Filename | modeM0/AS1G06_026T01_9000000962_07020cztM0_level2.evt | modeM0/AS1G06_026T01_9000000962_07020cztM0_level2_quad_clean.evt |
| Size (bytes) | 396,872,640 | 74,681,280 |
| Size | 378.5 MB | 71.2 MB |
| Events in quadrant A | 2,813,399 | 467,837 |
| Events in quadrant B | 2,981,493 | 473,414 |
| Events in quadrant C | 2,778,355 | 466,515 |
| Events in quadrant D | 3,047,091 | 443,845 |
| Mode M9 | |||
|---|---|---|---|
| Quadrant | BADHDUFLAG | Total packets | Discarded packets |
| A | 0 | 13 | 0 |
| B | 0 | 13 | 0 |
| C | 0 | 13 | 0 |
| D | 0 | 13 | 0 |
| Mode M0 | |||
|---|---|---|---|
| Quadrant | BADHDUFLAG | Total packets | Discarded packets |
| A | 0 | 12041 | 2 |
| B | 0 | 12393 | 1 |
| C | 0 | 12017 | 1 |
| D | 0 | 12489 | 1 |
| Mode SS | |||
|---|---|---|---|
| Quadrant | BADHDUFLAG | Total packets | Discarded packets |
| A | 0 | 118 | 0 |
| B | 0 | 118 | 0 |
| C | 0 | 118 | 0 |
| D | 0 | 118 | 0 |
| Quadrant | Total seconds | Saturated seconds | Saturation percentage |
|---|---|---|---|
| A | 5868 | 86 | 1.465576% |
| B | 5868 | 87 | 1.482618% |
| C | 5868 | 72 | 1.226994% |
| D | 5868 | 91 | 1.550784% |
Noise dominated data is calculated using 1-second bins in cleaned event files. If a bin has >2000 counts, and if more than 50% of those come from <1% of pixels, then it is considered to be noise-dominated and hence unusable.
| Quadrant | # 1 sec bins | Bins with >0 counts | Bins with >2000 counts | High rate bins dominated by noise | Noise dominated (total time) | Noise dominated (detector-on time) | Marked lightcurve |
|---|---|---|---|---|---|---|---|
| A | 7138 | 5869 | 0 | 0 | 0.00% | 0.00% | 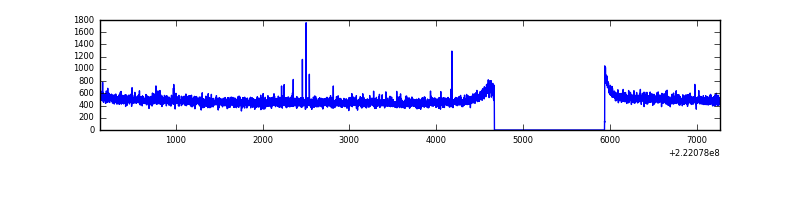 |
| B | 7138 | 5869 | 7 | 7 | 0.10% | 0.12% | 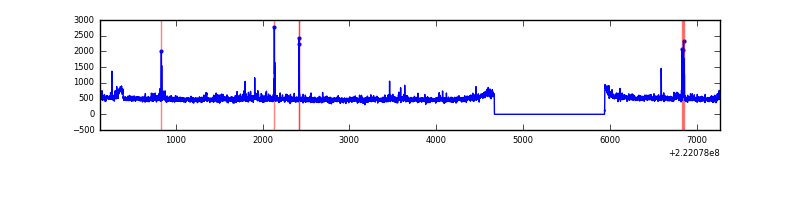 |
| C | 7138 | 5869 | 0 | 0 | 0.00% | 0.00% | 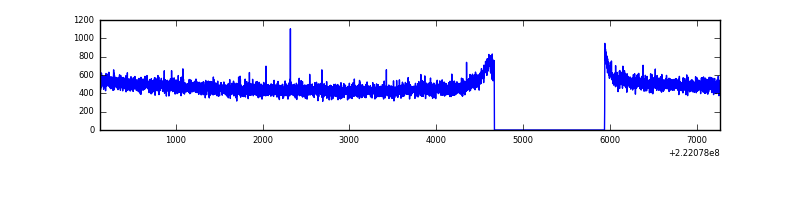 |
| D | 7138 | 5869 | 11 | 11 | 0.15% | 0.19% | 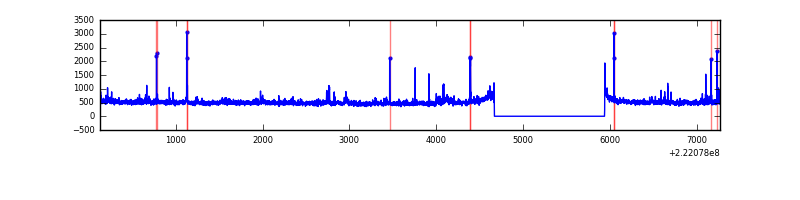 |
Top three noisy pixels from each quadrant. If the there are fewer than three noisy pixels in the level2.evt file, extra rows are filled as -1
| Pixel properties | Quadrant properties | ||||||
|---|---|---|---|---|---|---|---|
| Quadrant | DetID | PixID | Counts | Sigma | Mean | Median | Sigma |
| A | 0 | 226 | 7203 | 44.7 | 727 | 714 | 145.2 |
| A | 12 | 194 | 6715 | 41.34 | 727 | 714 | 145.2 |
| A | 4 | 2 | 6419 | 39.3 | 727 | 714 | 145.2 |
| B | 0 | 214 | 54885 | 398.45 | 727 | 712 | 136.0 |
| B | 4 | 173 | 47313 | 342.76 | 727 | 712 | 136.0 |
| B | 4 | 81 | 20064 | 142.34 | 727 | 712 | 136.0 |
| C | 13 | 61 | 5496 | 29.31 | 711 | 715 | 163.1 |
| C | 10 | 22 | 3094 | 14.59 | 711 | 715 | 163.1 |
| C | 3 | 202 | 1781 | 6.53 | 711 | 715 | 163.1 |
| D | 8 | 195 | 141400 | 816.31 | 710 | 686 | 172.4 |
| D | 1 | 239 | 82820 | 476.48 | 710 | 686 | 172.4 |
| D | 12 | 221 | 53156 | 304.39 | 710 | 686 | 172.4 |
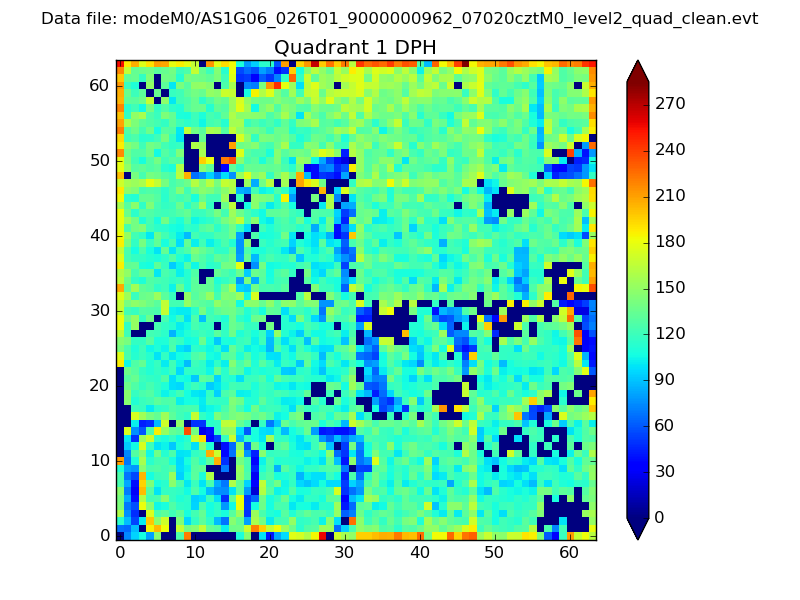
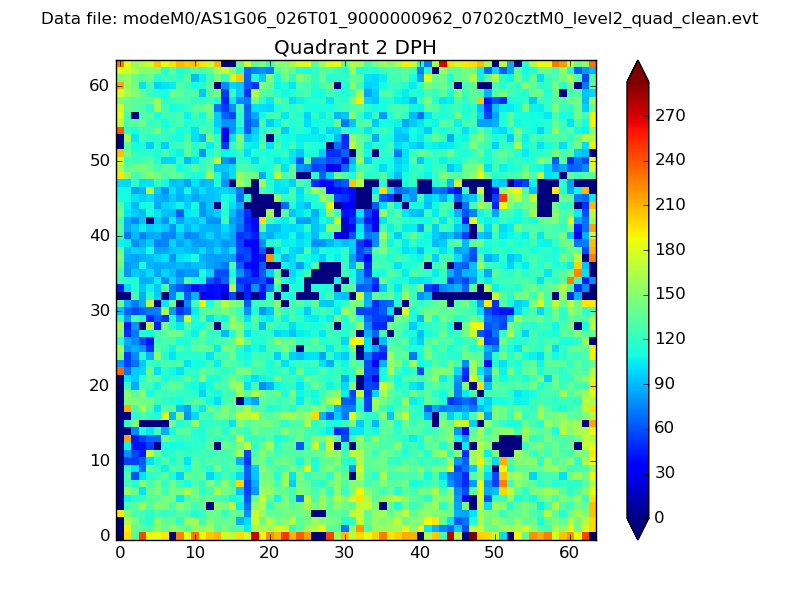
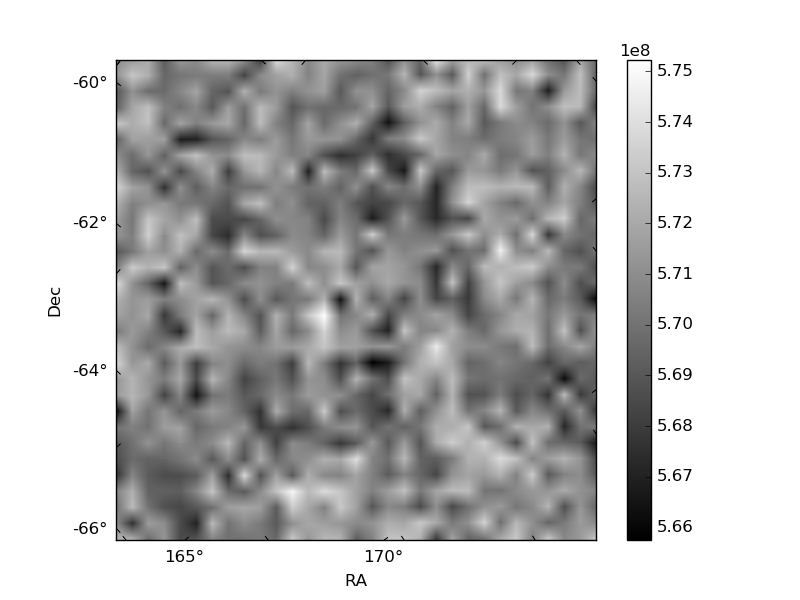
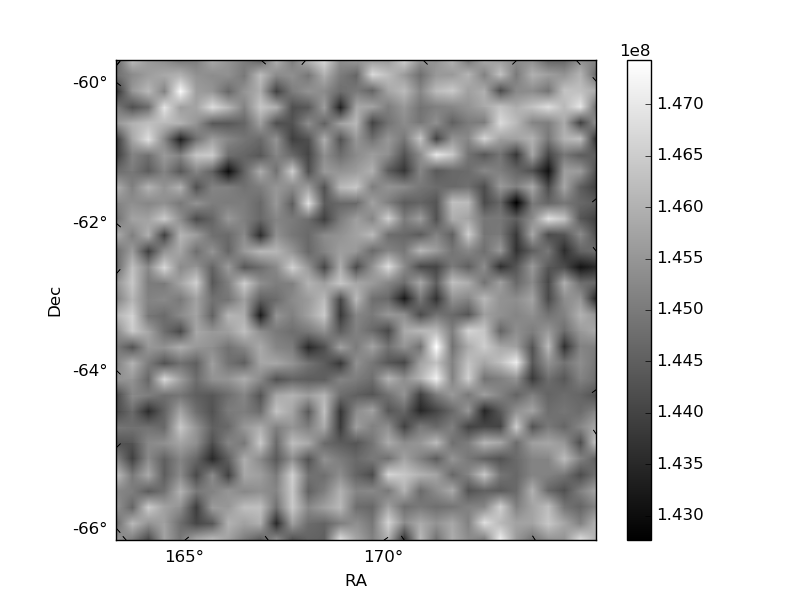
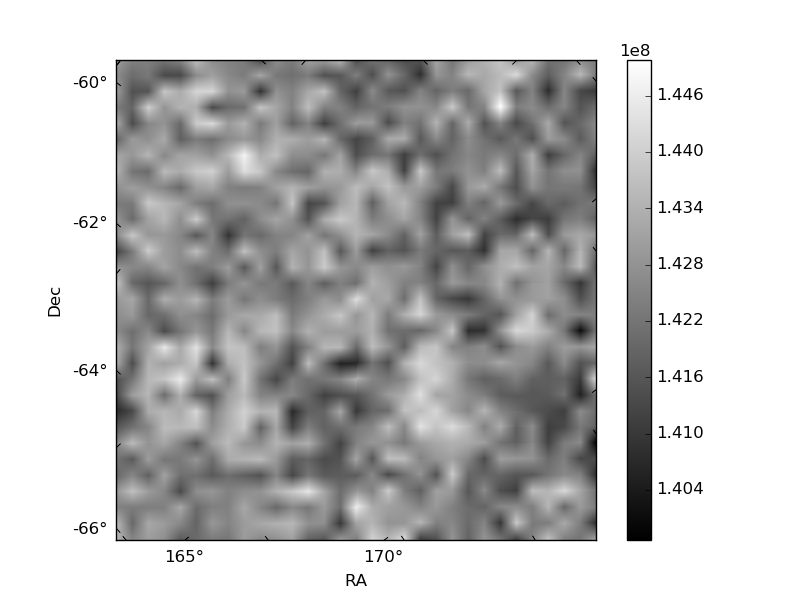
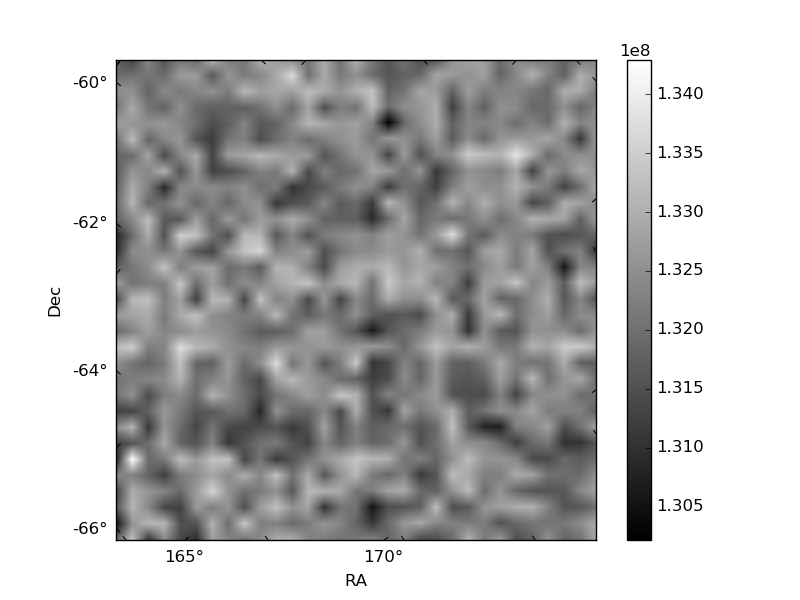
Histogram calculated using DETX and DETY for each event in the final _common_clean file
| Quadrant A |  |
 |
Quadrant B |
|---|---|---|---|
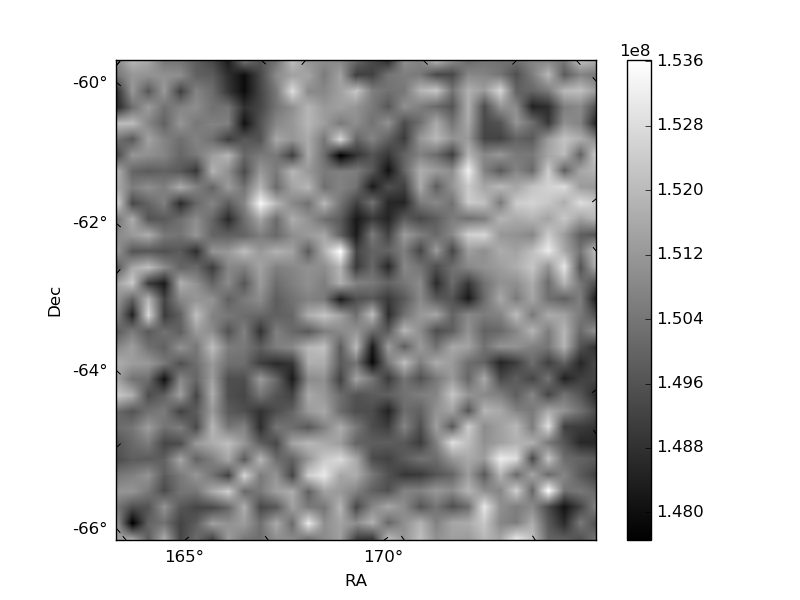
| Quadrant D | 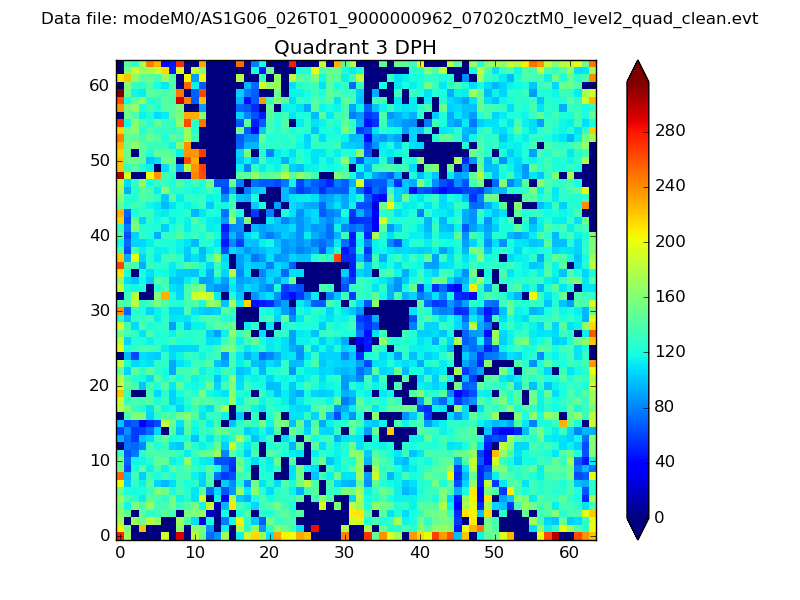 |
 |
Quadrant C |
| Plot type | Count rate plots | Images |
|---|---|---|
| Comparison with Poisson distribution Blue bars denote a histogram of data divided into 1 sec bins. Red curve is a Poisson curve with rate = median count rate of data. |
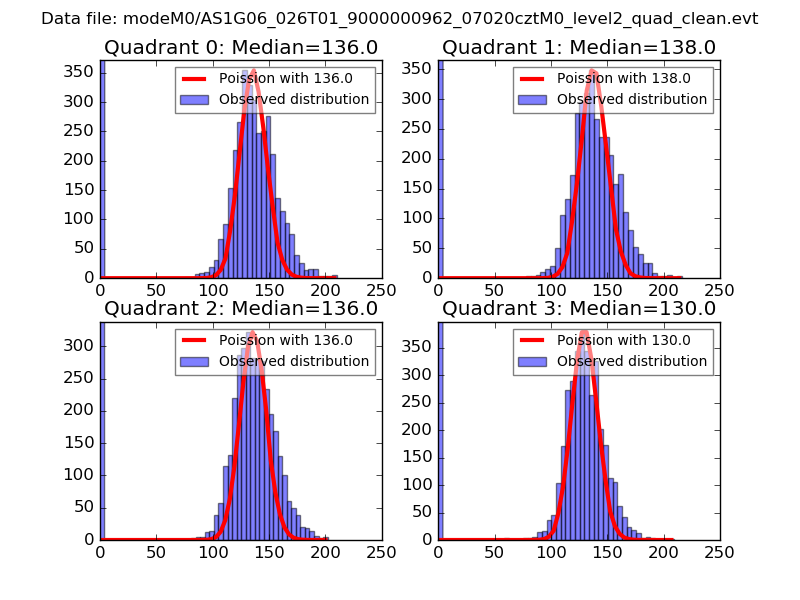 |
 |
| Quadrant-wise count rates Data is divided into 100 sec bins |
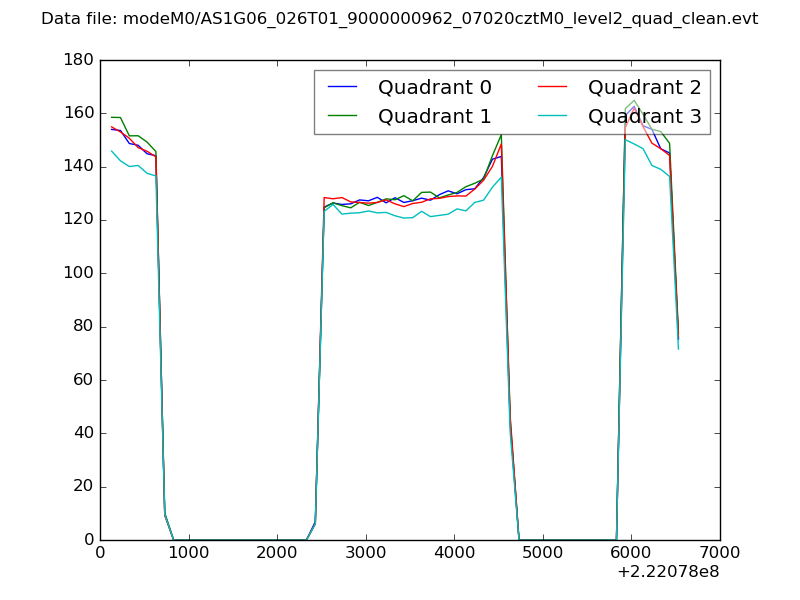 |
|
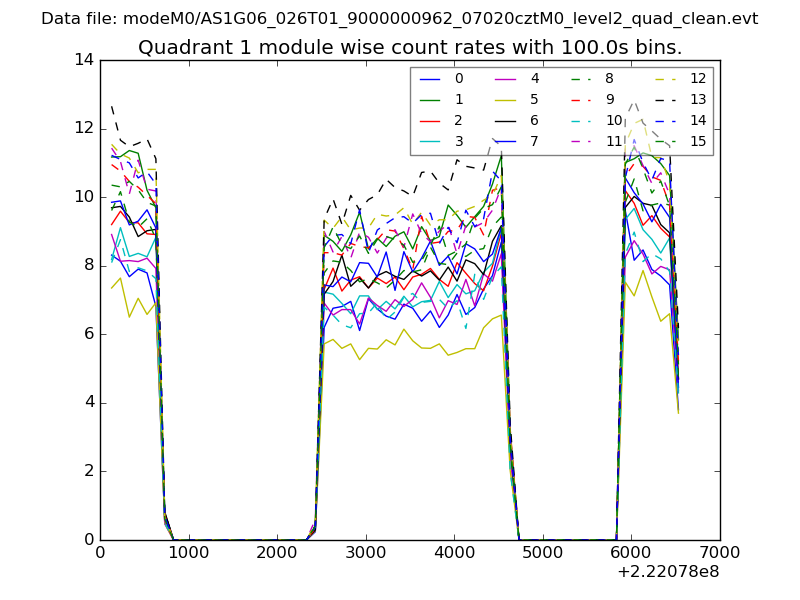
| Module-wise count rates for Quadrant A Data is divided into 100 sec bins |
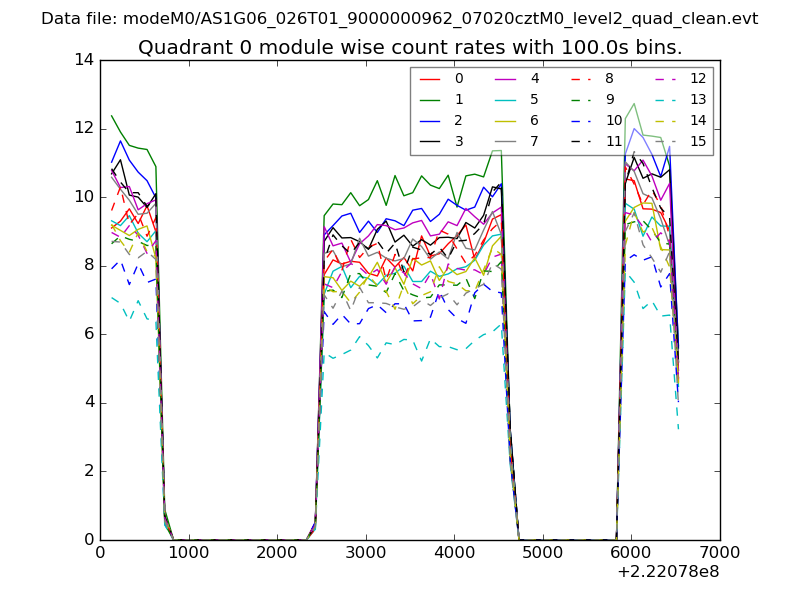 |
 |
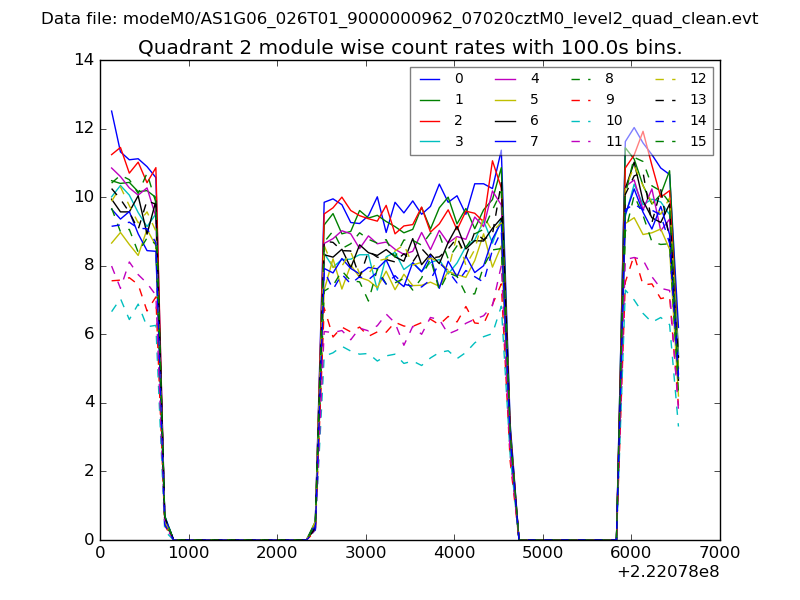
| Module-wise count rates for Quadrant B Data is divided into 100 sec bins |
 |
 |
| Module-wise count rates for Quadrant C Data is divided into 100 sec bins |
 |
 |
| Module-wise count rates for Quadrant D Data is divided into 100 sec bins |
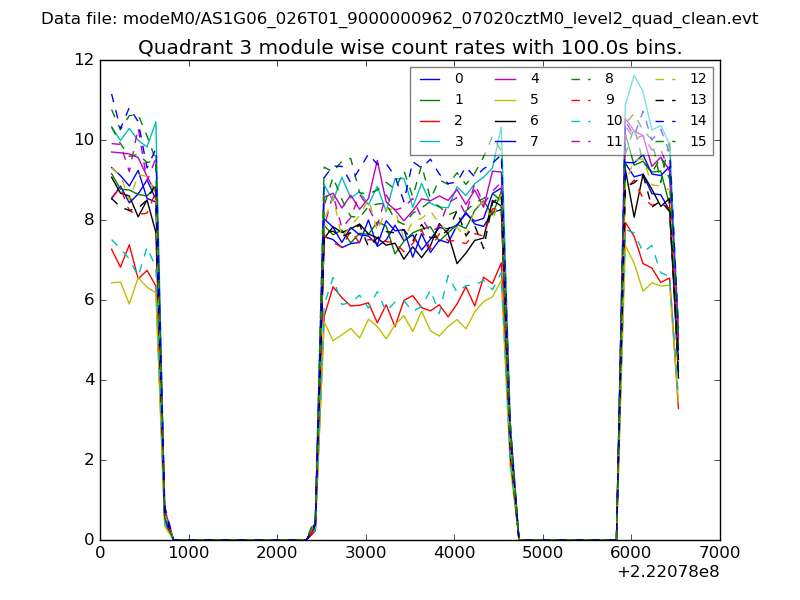 |
 |
| Parameter | Plot |
|---|---|
| CZT HV Monitor | 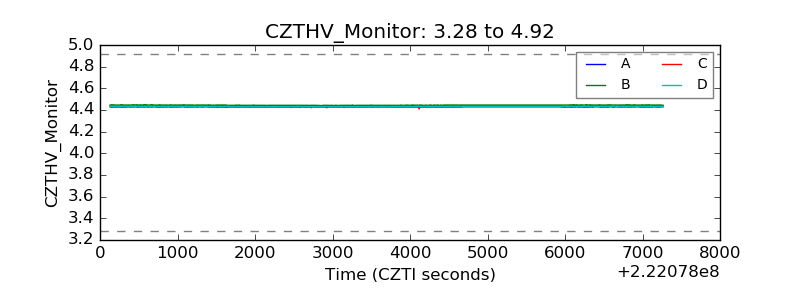 |
| D_VDD | 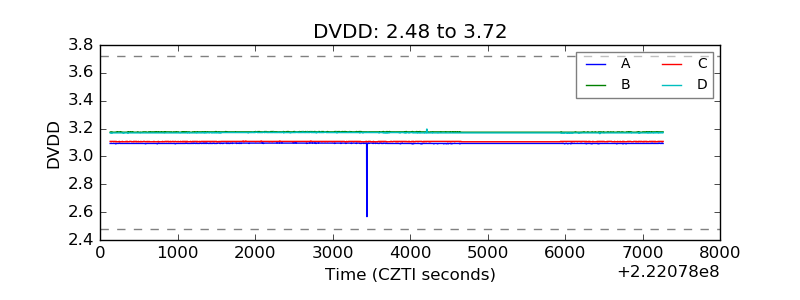 |
| Temperature 1 | 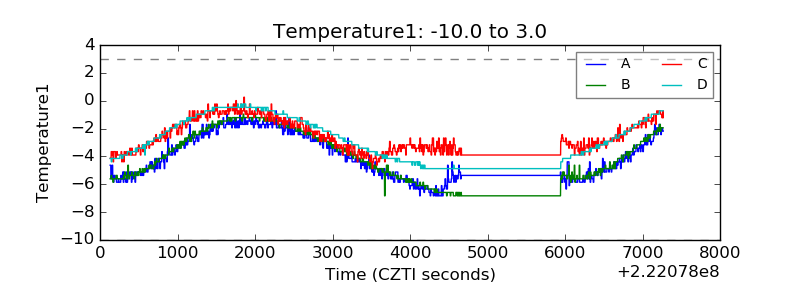 |
| Veto HV Monitor | 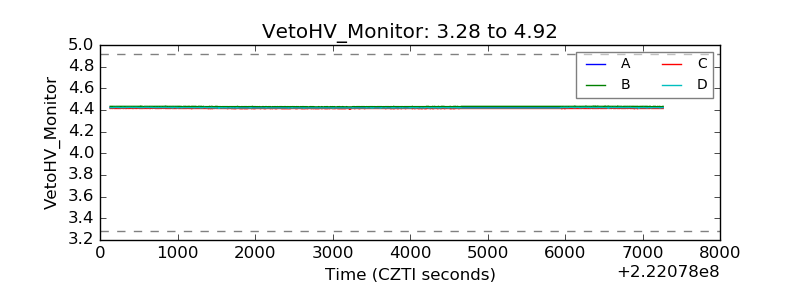 |
| Veto LLD | 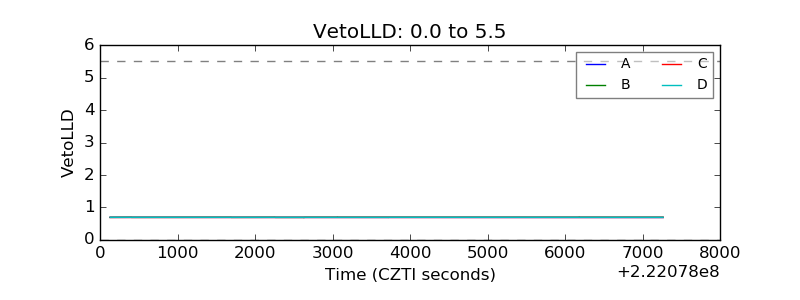 |
| Alpha Counter | 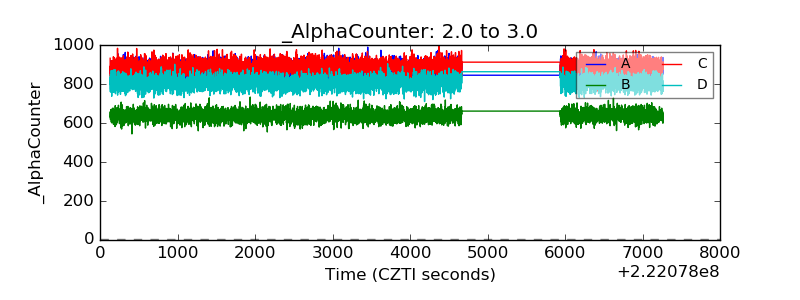 |
| _CPM_Rate |  |
| CZT Counter | 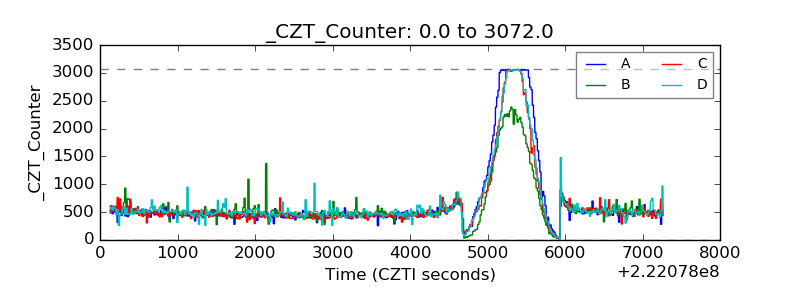 |
| +2.5 Volts monitor |  |
| +5 Volts monitor |  |
| _ROLL_ROT | 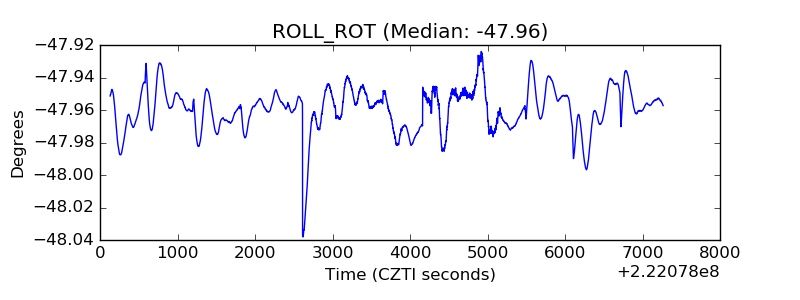 |
| _Roll_DEC | 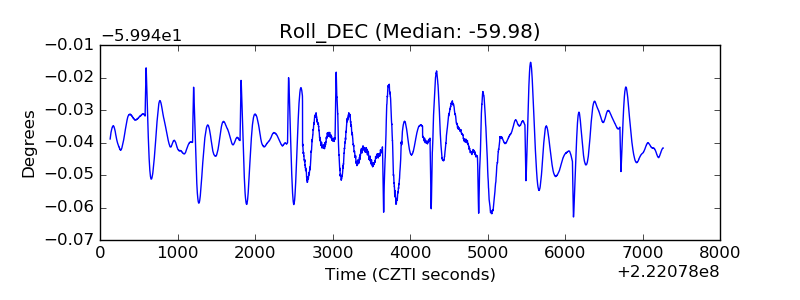 |
| _Roll_RA | 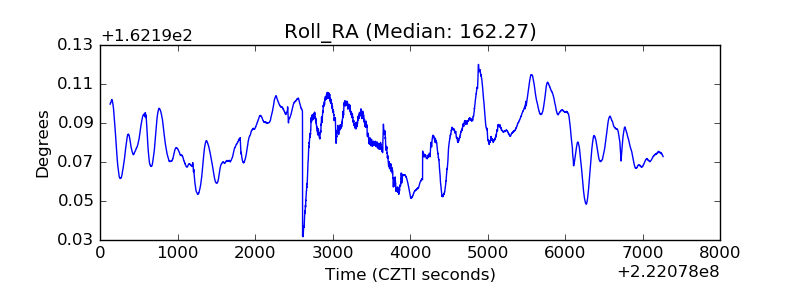 |
| Veto Counter |  |