| Param | Original file | Final file |
|---|---|---|
| Filename | modeM0/AS1G06_026T01_9000000962_07023cztM0_level2.evt | modeM0/AS1G06_026T01_9000000962_07023cztM0_level2_quad_clean.evt |
| Size (bytes) | 486,233,280 | 85,904,640 |
| Size | 463.7 MB | 81.9 MB |
| Events in quadrant A | 3,355,330 | 527,456 |
| Events in quadrant B | 3,572,067 | 530,995 |
| Events in quadrant C | 3,304,495 | 524,535 |
| Events in quadrant D | 3,995,868 | 508,603 |
| Mode M9 | |||
|---|---|---|---|
| Quadrant | BADHDUFLAG | Total packets | Discarded packets |
| A | 0 | 7 | 0 |
| B | 0 | 7 | 0 |
| C | 0 | 7 | 0 |
| D | 0 | 8 | 0 |
| Mode M0 | |||
|---|---|---|---|
| Quadrant | BADHDUFLAG | Total packets | Discarded packets |
| A | 0 | 15118 | 3 |
| B | 0 | 15512 | 2 |
| C | 0 | 15113 | 2 |
| D | 0 | 16765 | 2 |
| Mode SS | |||
|---|---|---|---|
| Quadrant | BADHDUFLAG | Total packets | Discarded packets |
| A | 0 | 146 | 0 |
| B | 0 | 146 | 0 |
| C | 0 | 146 | 0 |
| D | 0 | 146 | 0 |
| Quadrant | Total seconds | Saturated seconds | Saturation percentage |
|---|---|---|---|
| A | 7332 | 126 | 1.718494% |
| B | 7332 | 130 | 1.773050% |
| C | 7332 | 76 | 1.036552% |
| D | 7332 | 201 | 2.741408% |
Noise dominated data is calculated using 1-second bins in cleaned event files. If a bin has >2000 counts, and if more than 50% of those come from <1% of pixels, then it is considered to be noise-dominated and hence unusable.
| Quadrant | # 1 sec bins | Bins with >0 counts | Bins with >2000 counts | High rate bins dominated by noise | Noise dominated (total time) | Noise dominated (detector-on time) | Marked lightcurve |
|---|---|---|---|---|---|---|---|
| A | 7882 | 7333 | 0 | 0 | 0.00% | 0.00% | 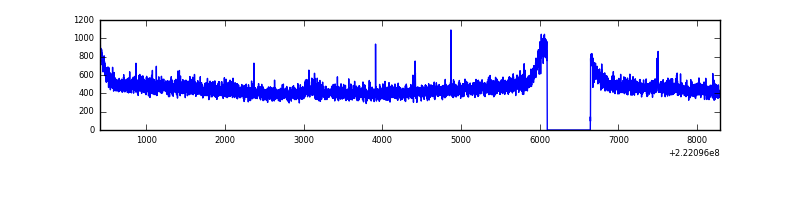 |
| B | 7882 | 7333 | 1 | 1 | 0.01% | 0.01% | 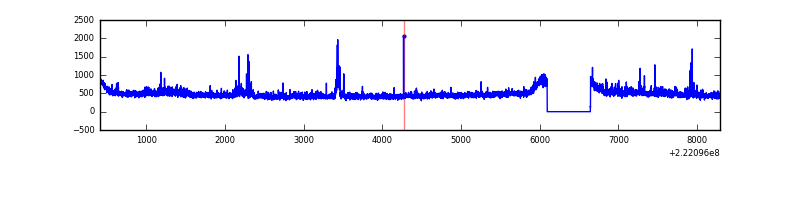 |
| C | 7882 | 7333 | 0 | 0 | 0.00% | 0.00% | 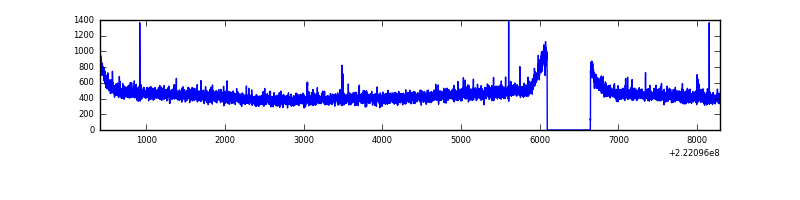 |
| D | 7882 | 7333 | 105 | 105 | 1.33% | 1.43% | 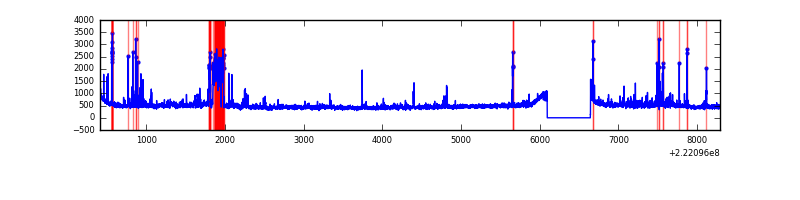 |
Top three noisy pixels from each quadrant. If the there are fewer than three noisy pixels in the level2.evt file, extra rows are filled as -1
| Pixel properties | Quadrant properties | ||||||
|---|---|---|---|---|---|---|---|
| Quadrant | DetID | PixID | Counts | Sigma | Mean | Median | Sigma |
| A | 15 | 234 | 12823 | 67.78 | 864 | 842 | 176.8 |
| A | 0 | 226 | 8310 | 42.25 | 864 | 842 | 176.8 |
| A | 13 | 14 | 8309 | 42.24 | 864 | 842 | 176.8 |
| B | 0 | 214 | 108043 | 649.45 | 867 | 844 | 165.1 |
| B | 0 | 228 | 35958 | 212.73 | 867 | 844 | 165.1 |
| B | 4 | 173 | 19626 | 113.79 | 867 | 844 | 165.1 |
| C | 12 | 4 | 9915 | 46.44 | 842 | 843 | 195.4 |
| C | 13 | 61 | 6691 | 29.94 | 842 | 843 | 195.4 |
| C | 10 | 22 | 3251 | 12.33 | 842 | 843 | 195.4 |
| D | 1 | 18 | 262544 | 1287.19 | 840 | 813 | 203.3 |
| D | 8 | 195 | 223546 | 1095.4 | 840 | 813 | 203.3 |
| D | 2 | 136 | 153189 | 749.39 | 840 | 813 | 203.3 |
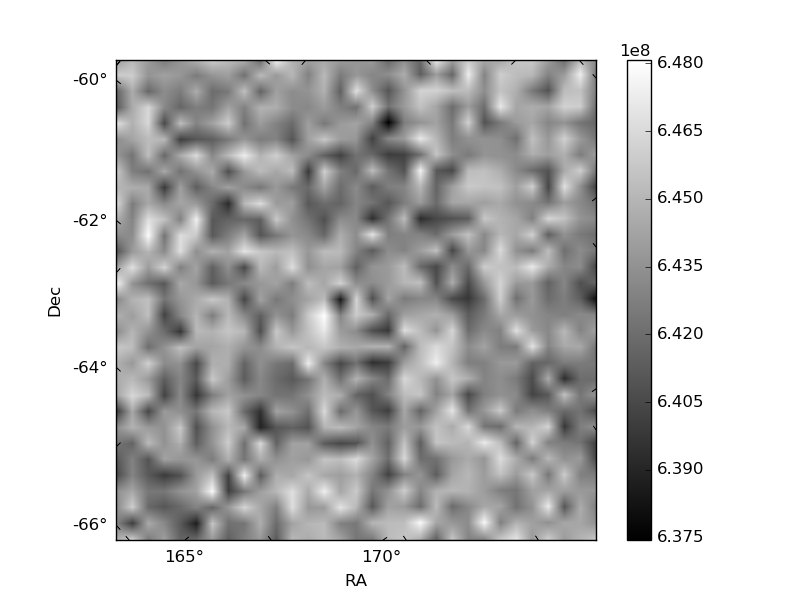
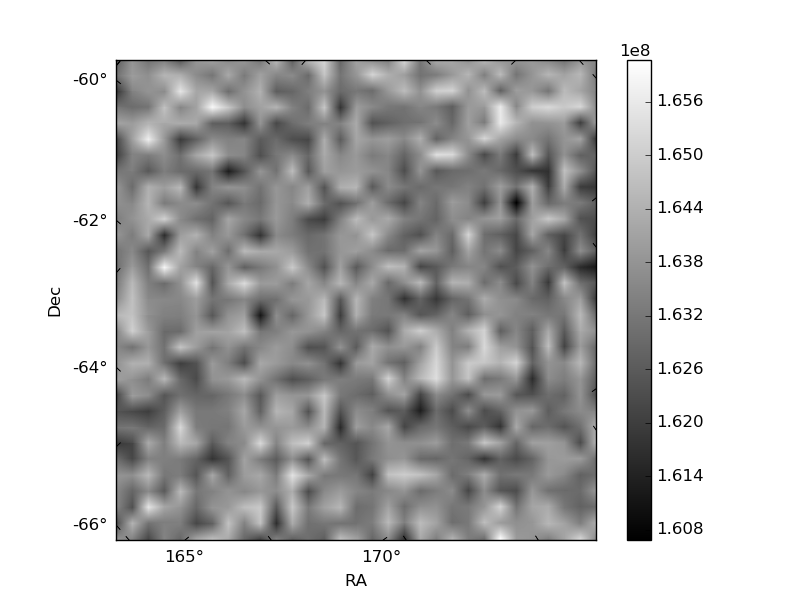
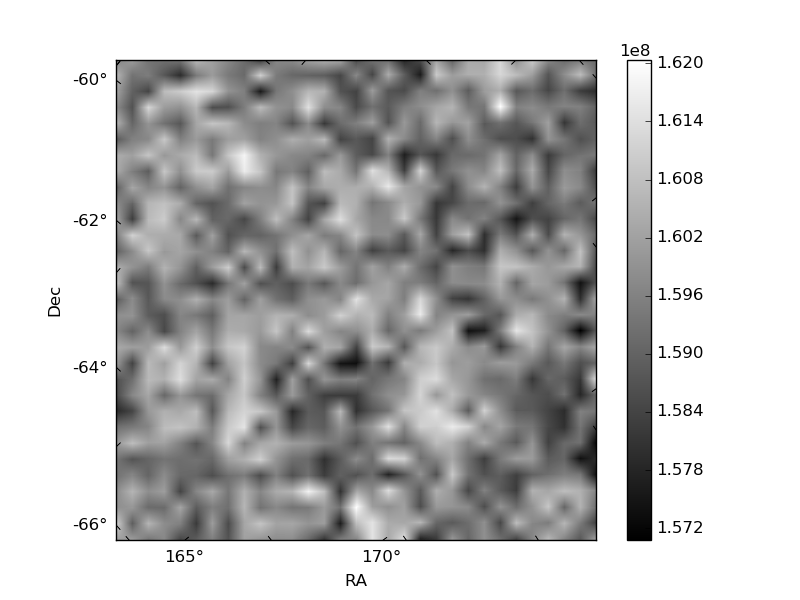
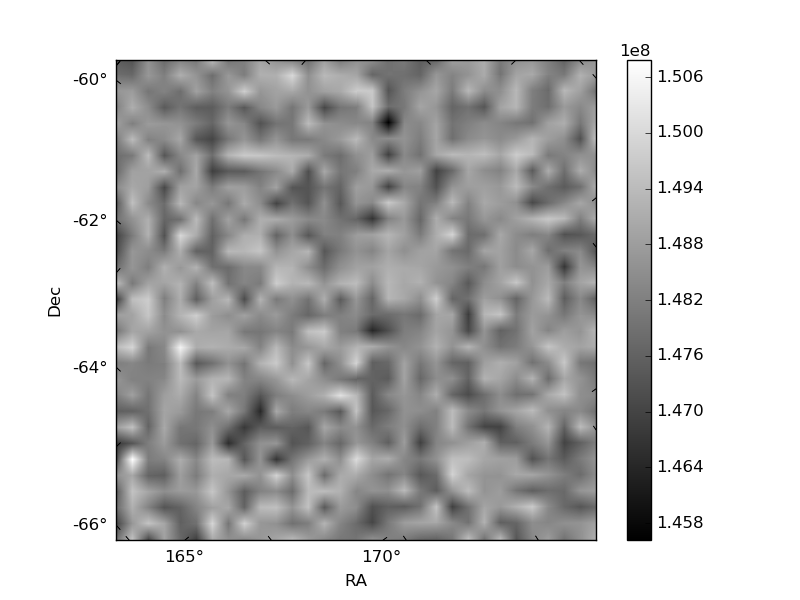
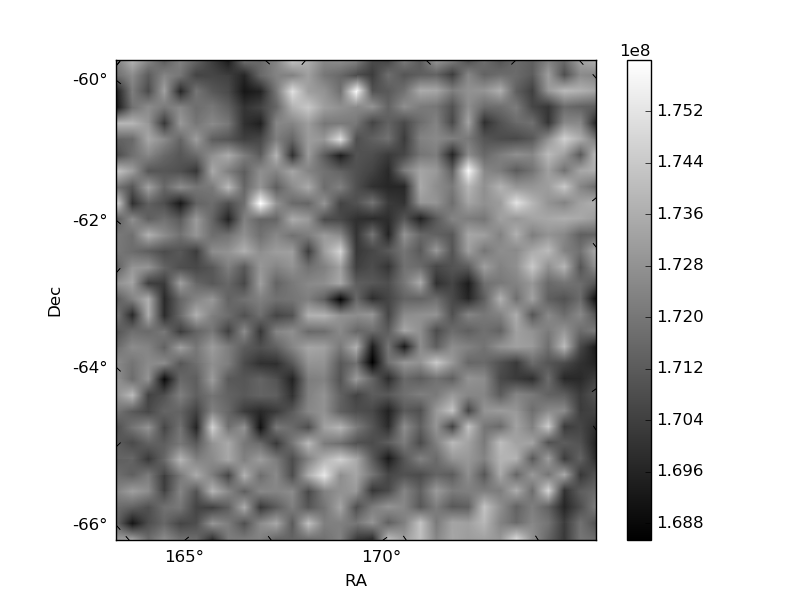
Histogram calculated using DETX and DETY for each event in the final _common_clean file
| Quadrant A | 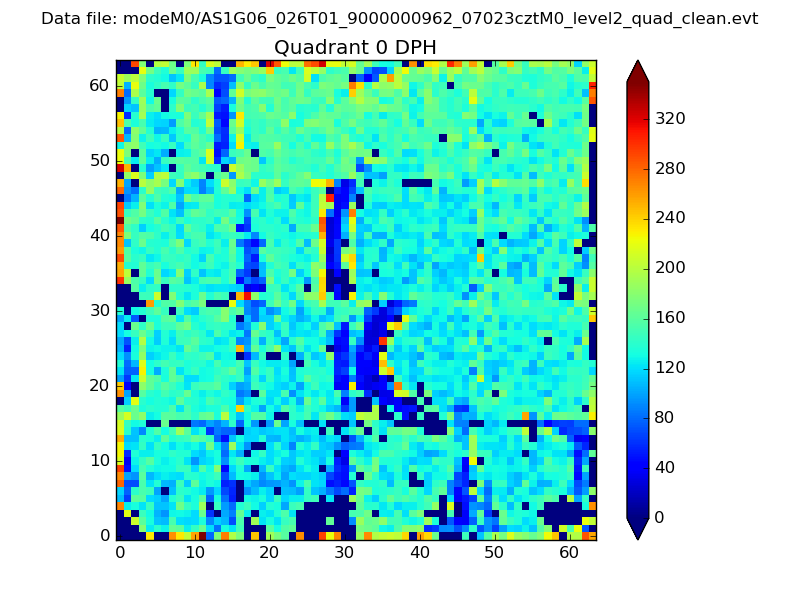 |
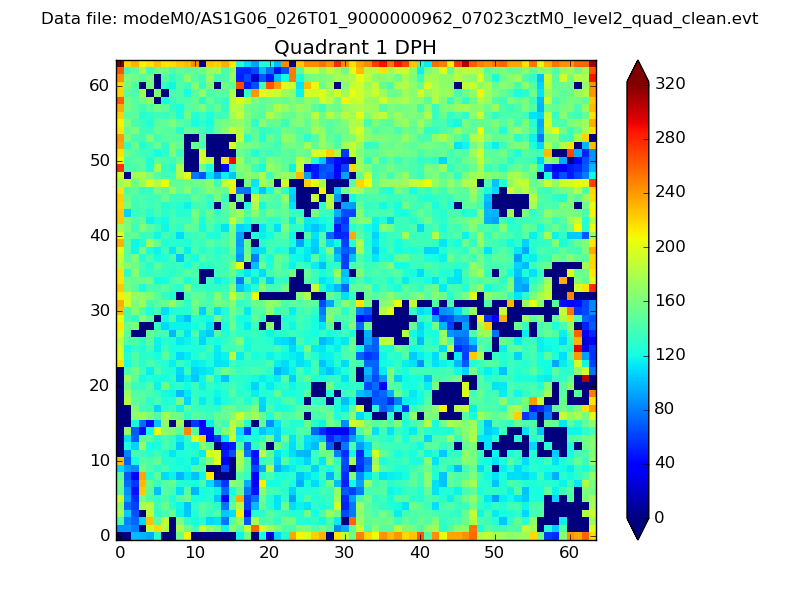 |
Quadrant B |
|---|---|---|---|
| Quadrant D | 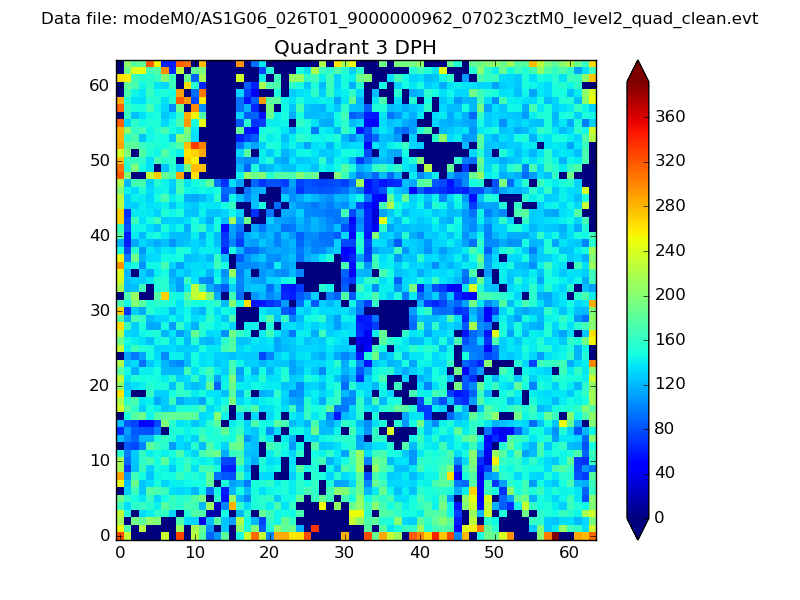 |
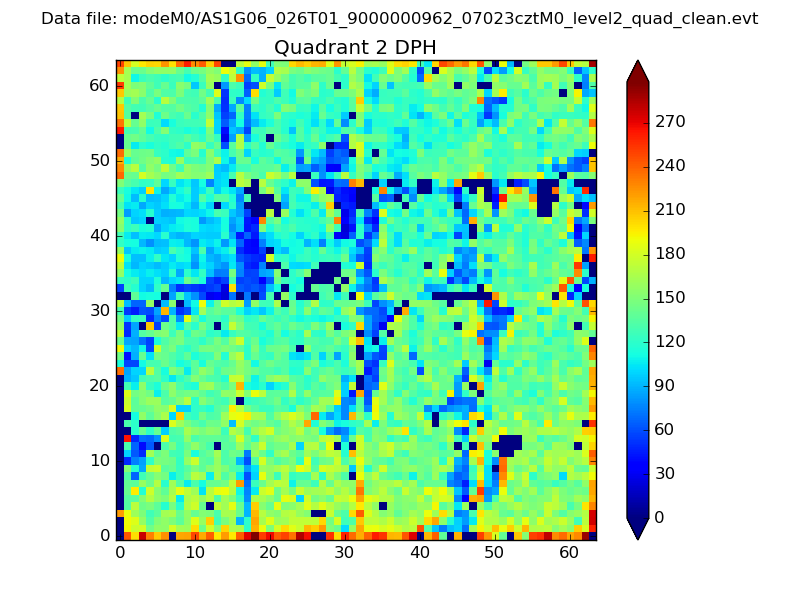 |
Quadrant C |
| Plot type | Count rate plots | Images |
|---|---|---|
| Comparison with Poisson distribution Blue bars denote a histogram of data divided into 1 sec bins. Red curve is a Poisson curve with rate = median count rate of data. |
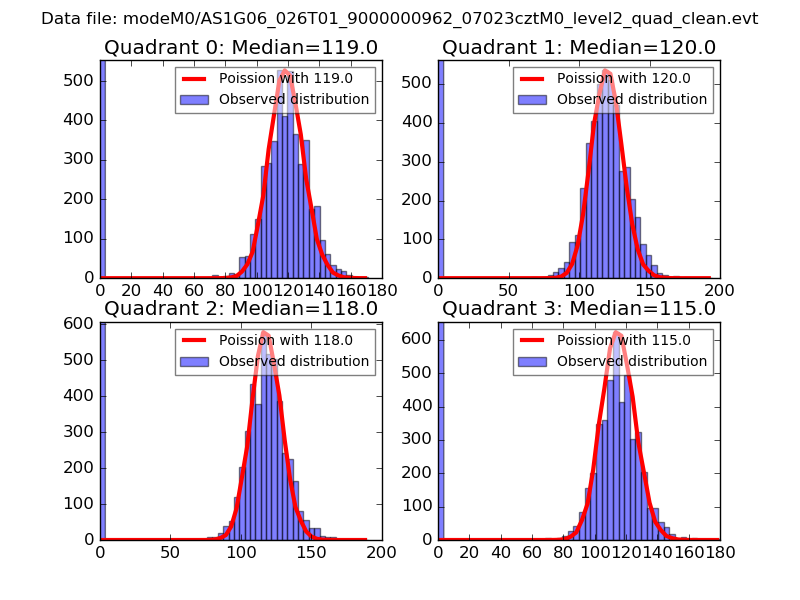 |
 |
| Quadrant-wise count rates Data is divided into 100 sec bins |
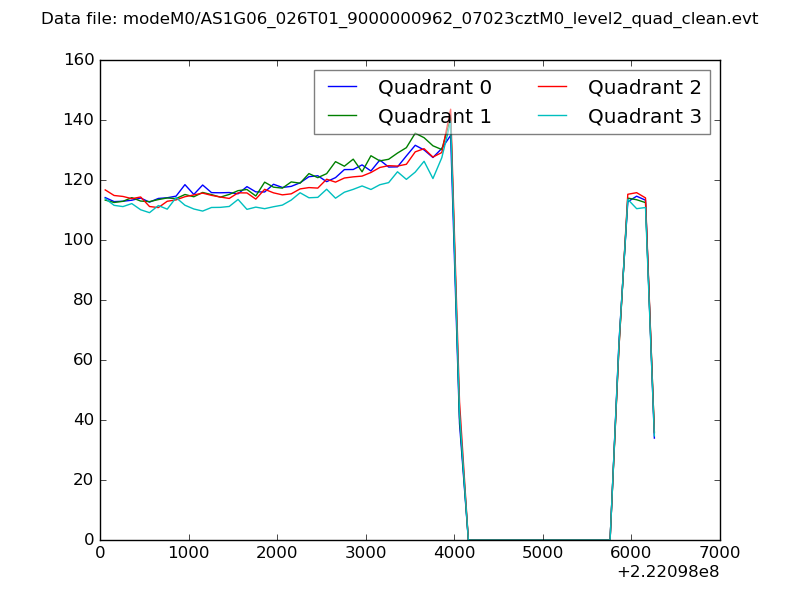 |
|
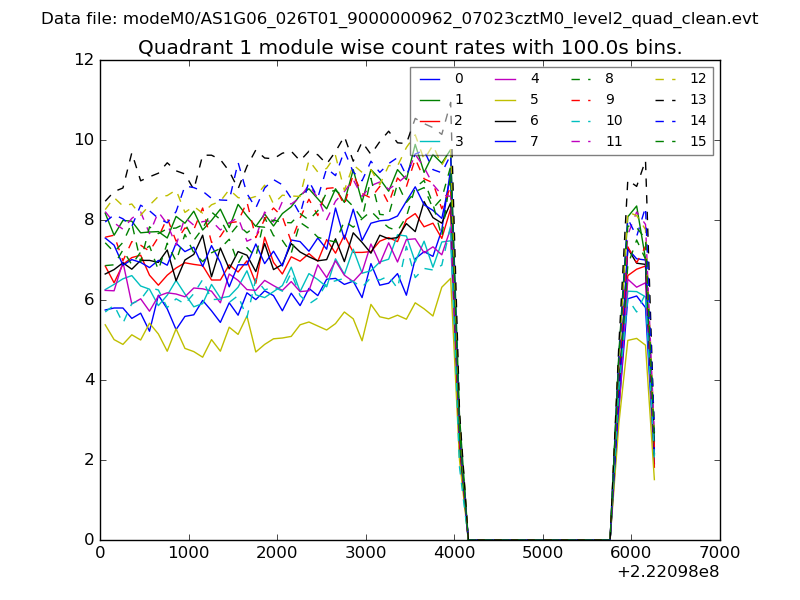
| Module-wise count rates for Quadrant A Data is divided into 100 sec bins |
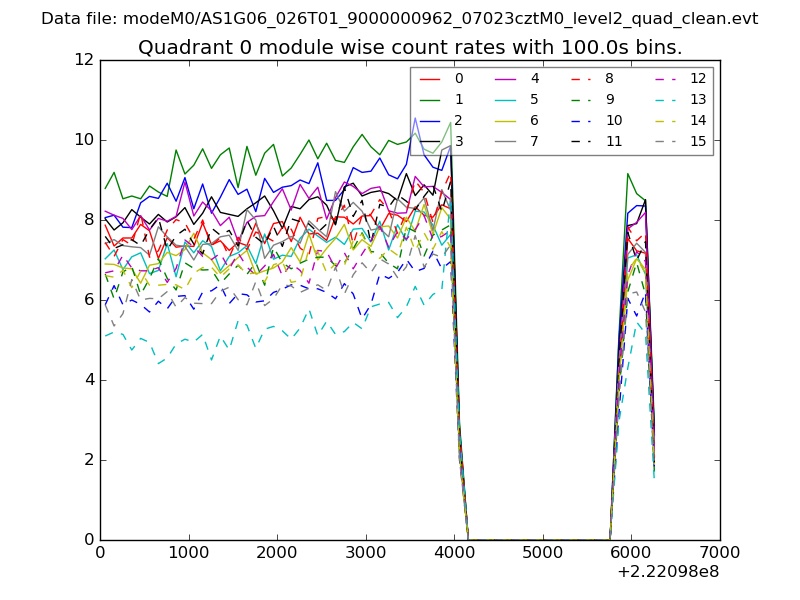 |
 |
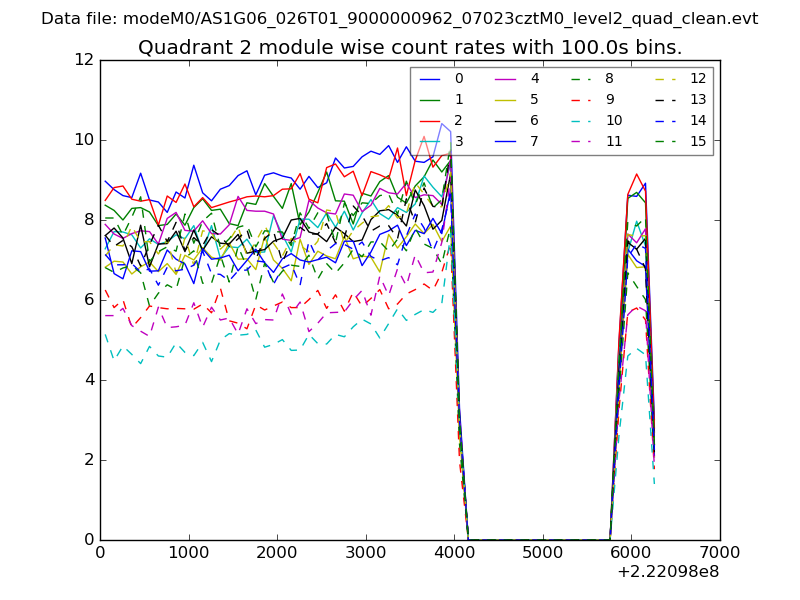
| Module-wise count rates for Quadrant B Data is divided into 100 sec bins |
 |
 |
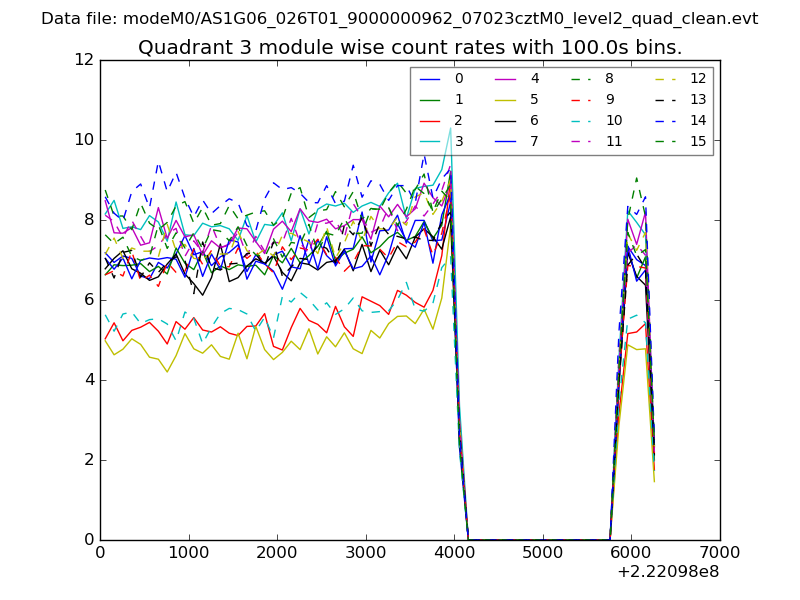
| Module-wise count rates for Quadrant C Data is divided into 100 sec bins |
 |
 |
| Module-wise count rates for Quadrant D Data is divided into 100 sec bins |
 |
 |
| Parameter | Plot |
|---|---|
| CZT HV Monitor | 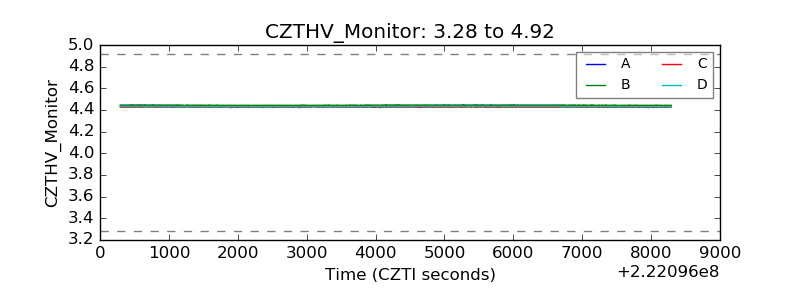 |
| D_VDD | 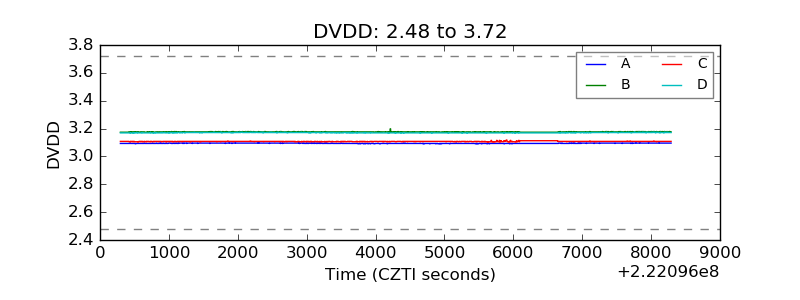 |
| Temperature 1 | 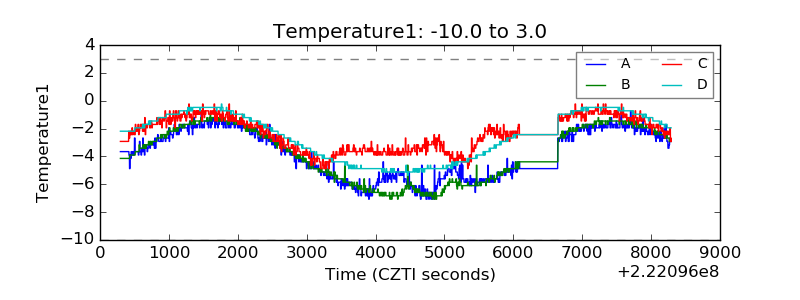 |
| Veto HV Monitor | 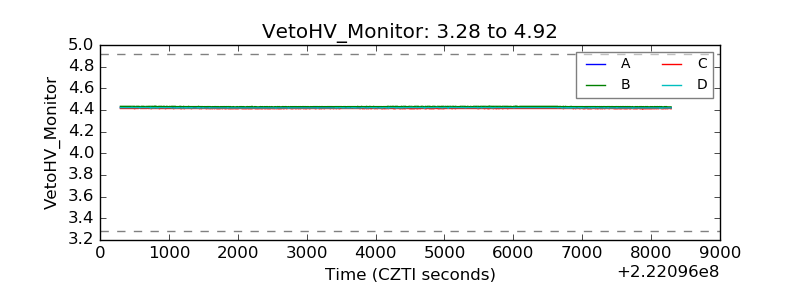 |
| Veto LLD | 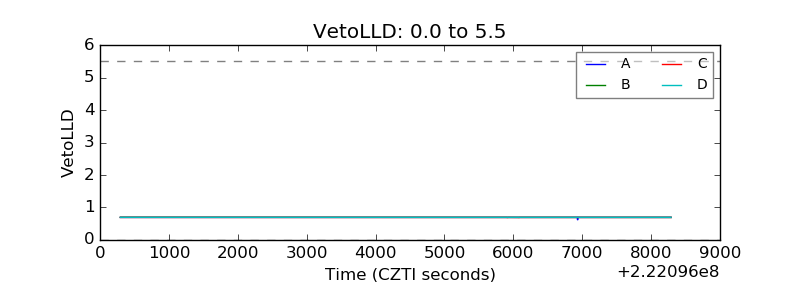 |
| Alpha Counter | 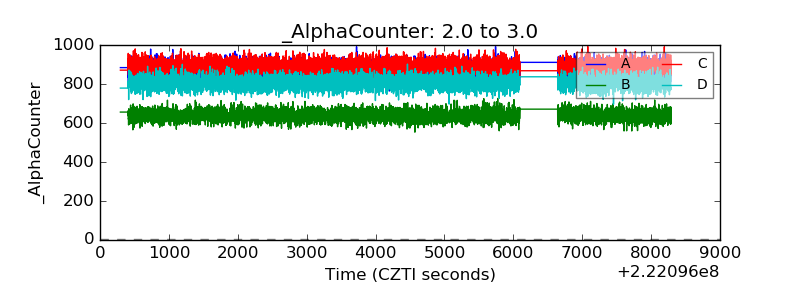 |
| _CPM_Rate | 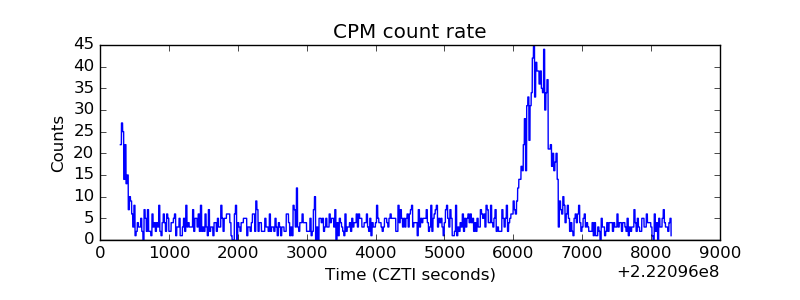 |
| CZT Counter | 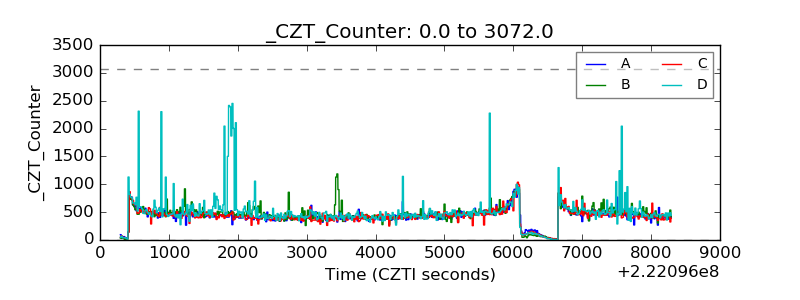 |
| +2.5 Volts monitor | 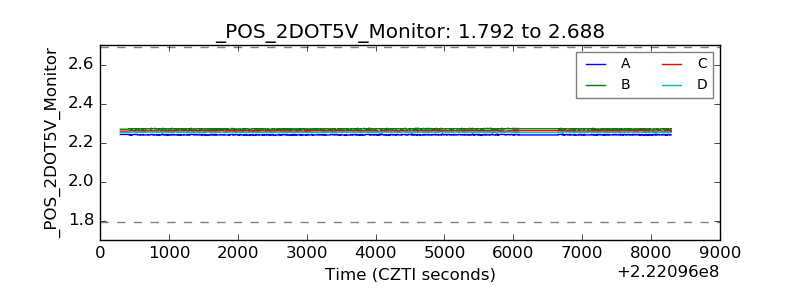 |
| +5 Volts monitor |  |
| _ROLL_ROT | 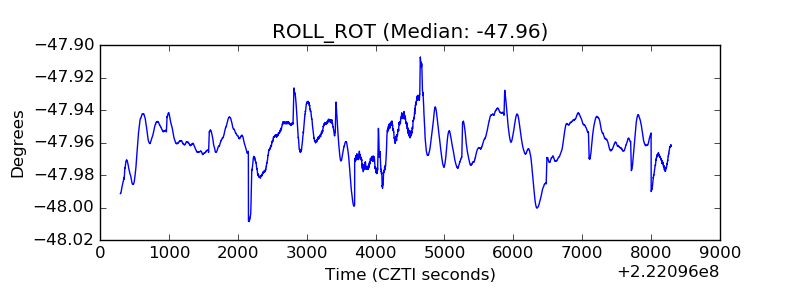 |
| _Roll_DEC | 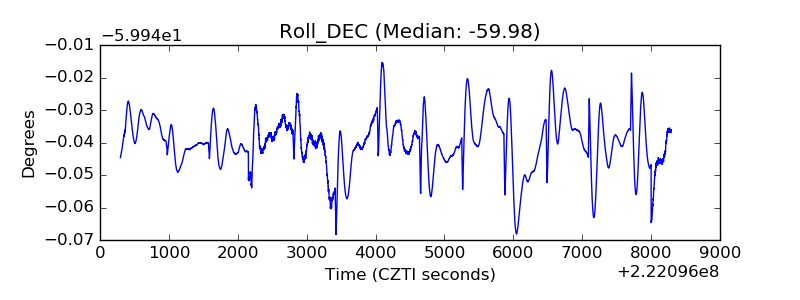 |
| _Roll_RA | 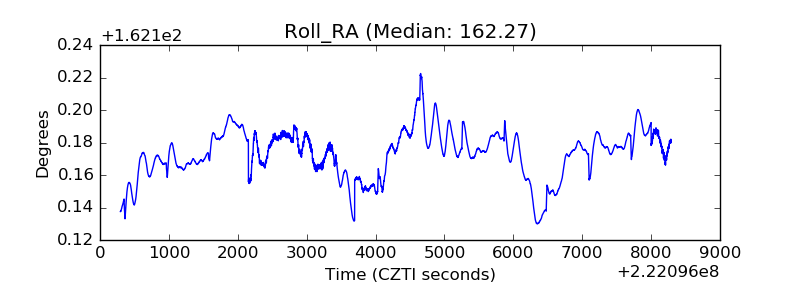 |
| Veto Counter | 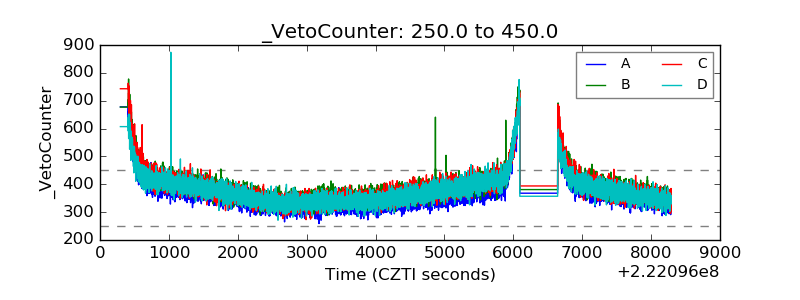 |