| Param | Original file | Final file |
|---|---|---|
| Filename | modeM0/AS1G06_026T01_9000000962_07024cztM0_level2.evt | modeM0/AS1G06_026T01_9000000962_07024cztM0_level2_quad_clean.evt |
| Size (bytes) | 530,285,760 | 92,341,440 |
| Size | 505.7 MB | 88.1 MB |
| Events in quadrant A | 3,433,505 | 575,781 |
| Events in quadrant B | 3,592,299 | 578,569 |
| Events in quadrant C | 3,397,025 | 569,488 |
| Events in quadrant D | 5,117,558 | 540,619 |
| Mode M9 | |||
|---|---|---|---|
| Quadrant | BADHDUFLAG | Total packets | Discarded packets |
| A | 0 | 3 | 0 |
| B | 0 | 3 | 0 |
| C | 0 | 3 | 0 |
| D | 0 | 3 | 0 |
| Mode M0 | |||
|---|---|---|---|
| Quadrant | BADHDUFLAG | Total packets | Discarded packets |
| A | 0 | 15667 | 2 |
| B | 0 | 15953 | 1 |
| C | 0 | 15653 | 1 |
| D | 0 | 20403 | 1 |
| Mode SS | |||
|---|---|---|---|
| Quadrant | BADHDUFLAG | Total packets | Discarded packets |
| A | 0 | 154 | 0 |
| B | 0 | 154 | 0 |
| C | 0 | 154 | 0 |
| D | 0 | 154 | 0 |
| Quadrant | Total seconds | Saturated seconds | Saturation percentage |
|---|---|---|---|
| A | 7648 | 102 | 1.333682% |
| B | 7648 | 110 | 1.438285% |
| C | 7648 | 47 | 0.614540% |
| D | 7648 | 511 | 6.681485% |
Noise dominated data is calculated using 1-second bins in cleaned event files. If a bin has >2000 counts, and if more than 50% of those come from <1% of pixels, then it is considered to be noise-dominated and hence unusable.
| Quadrant | # 1 sec bins | Bins with >0 counts | Bins with >2000 counts | High rate bins dominated by noise | Noise dominated (total time) | Noise dominated (detector-on time) | Marked lightcurve |
|---|---|---|---|---|---|---|---|
| A | 7913 | 7650 | 0 | 0 | 0.00% | 0.00% | 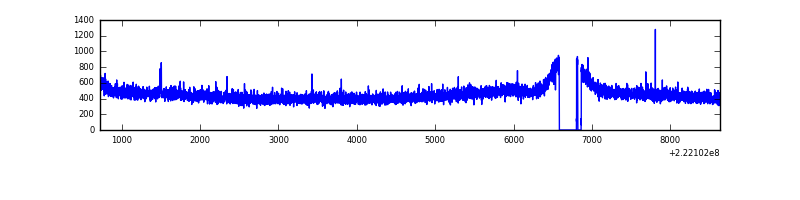 |
| B | 7913 | 7650 | 1 | 1 | 0.01% | 0.01% | 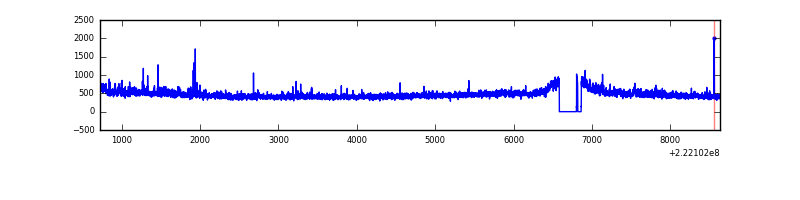 |
| C | 7913 | 7650 | 0 | 0 | 0.00% | 0.00% | 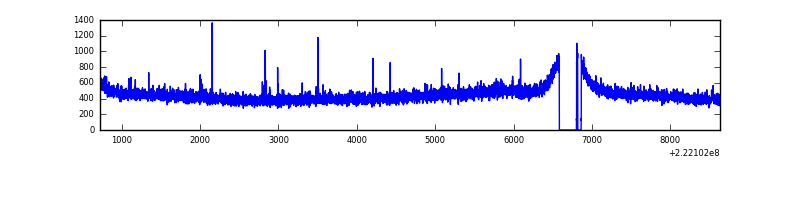 |
| D | 7913 | 7650 | 377 | 377 | 4.76% | 4.93% | 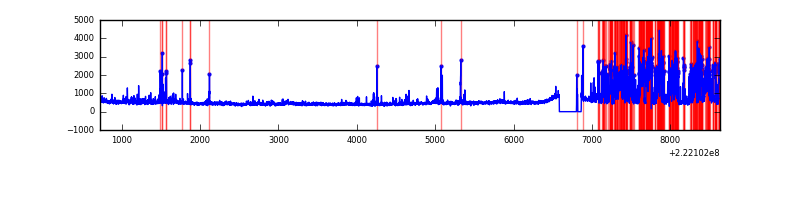 |
Top three noisy pixels from each quadrant. If the there are fewer than three noisy pixels in the level2.evt file, extra rows are filled as -1
| Pixel properties | Quadrant properties | ||||||
|---|---|---|---|---|---|---|---|
| Quadrant | DetID | PixID | Counts | Sigma | Mean | Median | Sigma |
| A | 0 | 226 | 8466 | 41.62 | 888 | 865 | 182.6 |
| A | 12 | 194 | 8005 | 39.1 | 888 | 865 | 182.6 |
| A | 15 | 234 | 7397 | 35.77 | 888 | 865 | 182.6 |
| B | 0 | 214 | 81267 | 474.98 | 891 | 870 | 169.3 |
| B | 4 | 173 | 17508 | 98.3 | 891 | 870 | 169.3 |
| B | 12 | 111 | 16171 | 90.4 | 891 | 870 | 169.3 |
| C | 12 | 4 | 12608 | 59.14 | 861 | 862 | 198.6 |
| C | 1 | 16 | 11274 | 52.43 | 861 | 862 | 198.6 |
| C | 13 | 61 | 6692 | 29.35 | 861 | 862 | 198.6 |
| D | 2 | 216 | 1384842 | 6691.35 | 844 | 816 | 206.8 |
| D | 8 | 195 | 227184 | 1094.42 | 844 | 816 | 206.8 |
| D | 2 | 136 | 177134 | 852.44 | 844 | 816 | 206.8 |
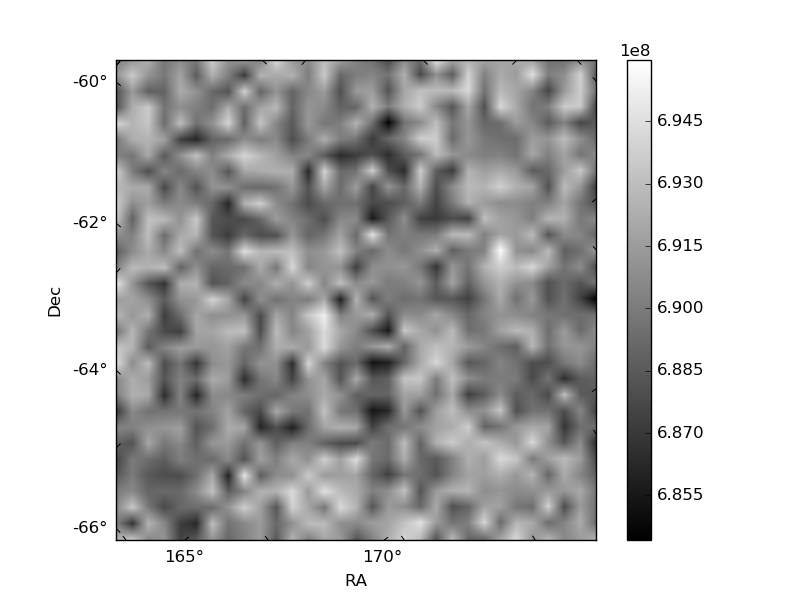
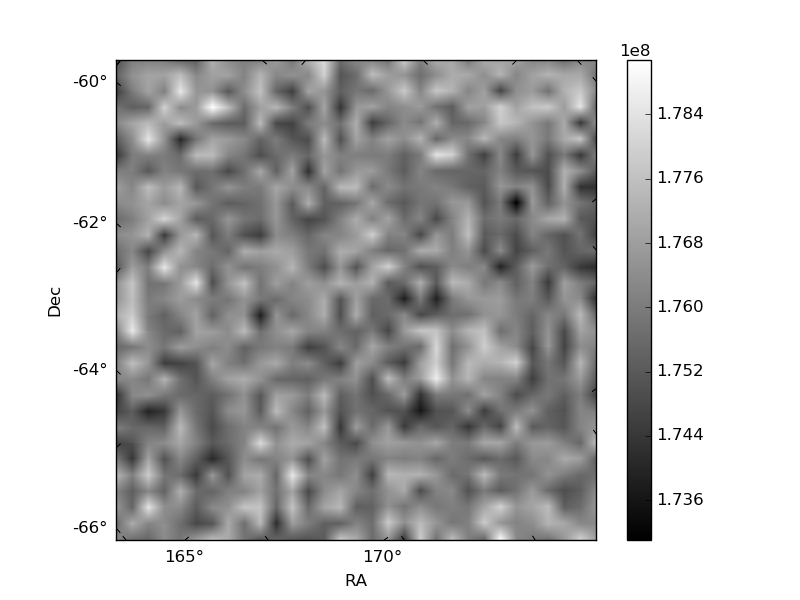
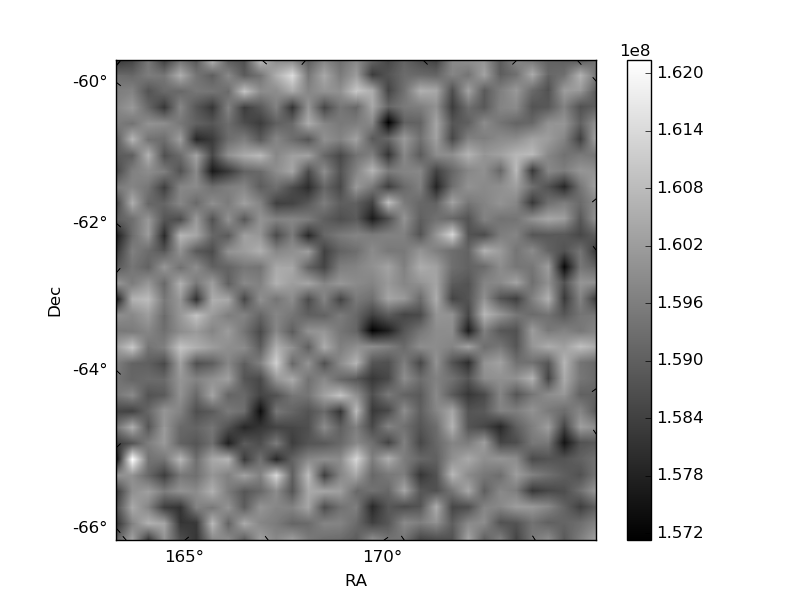
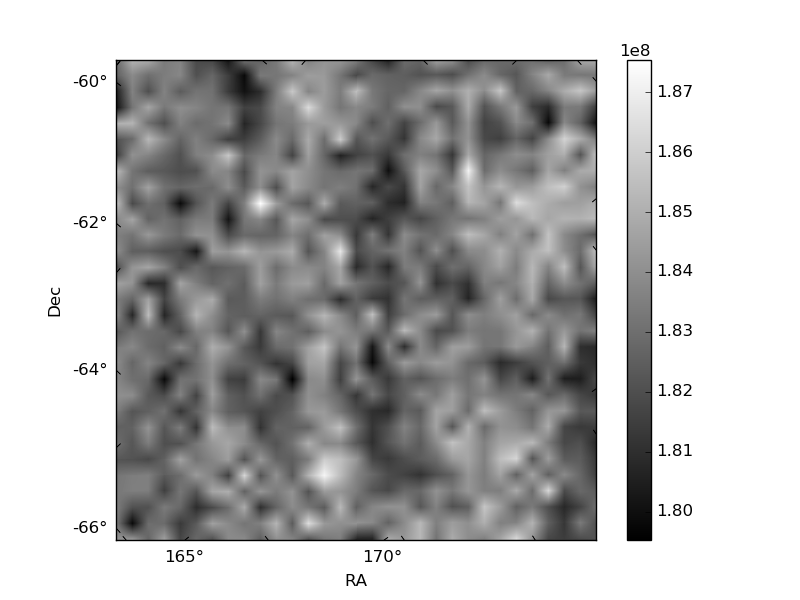
Histogram calculated using DETX and DETY for each event in the final _common_clean file
| Quadrant A | 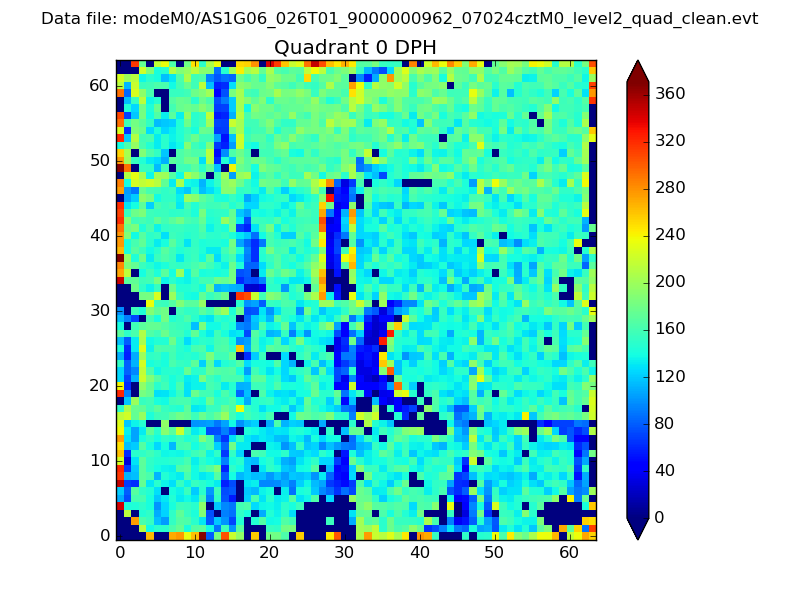 |
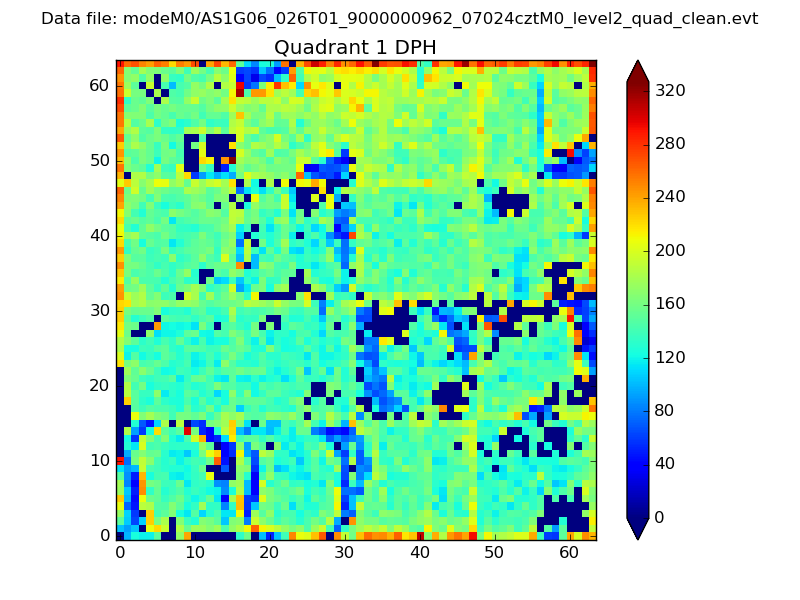 |
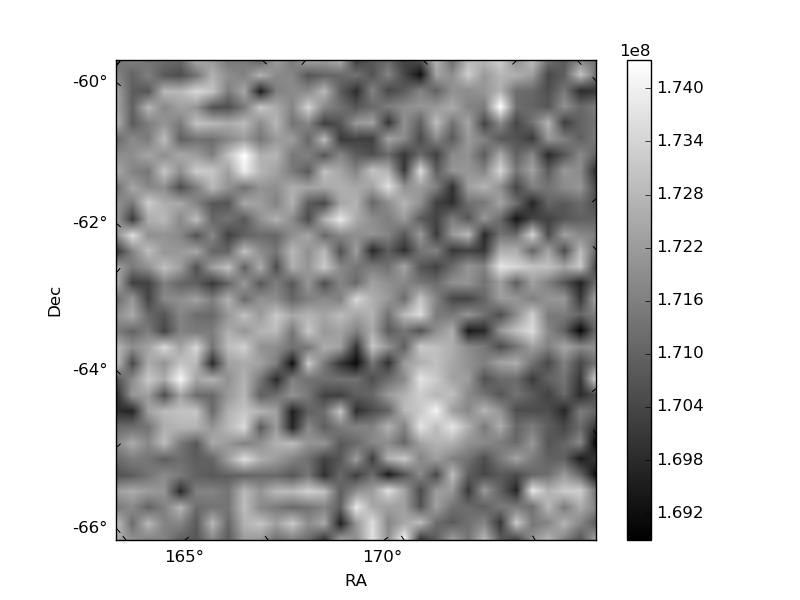
Quadrant B |
|---|---|---|---|
| Quadrant D | 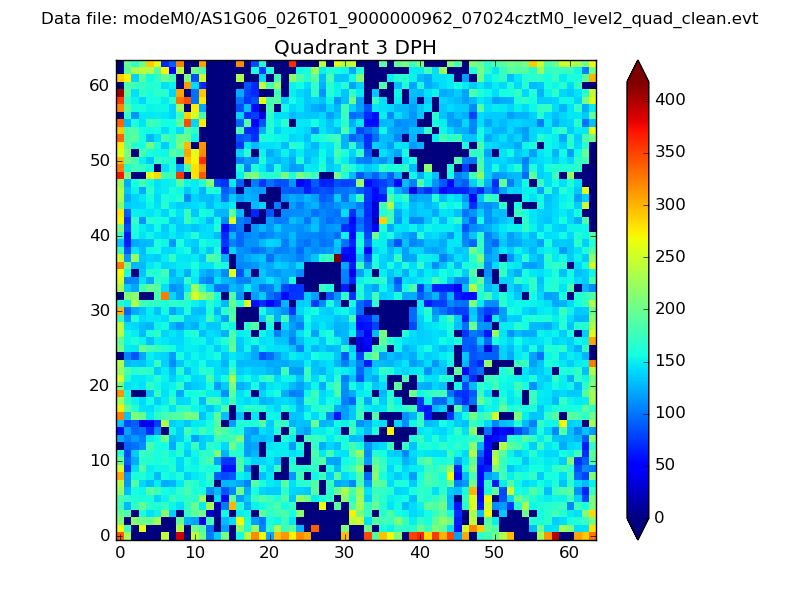 |
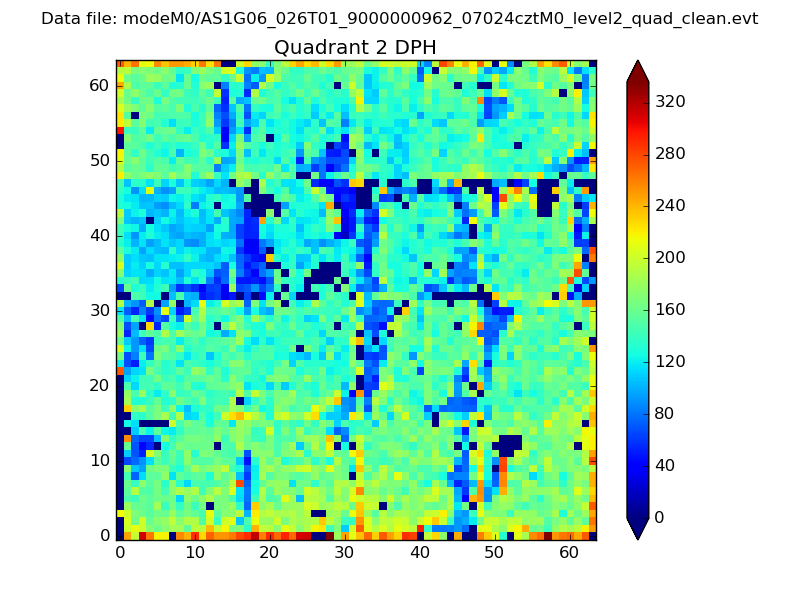 |
Quadrant C |
| Plot type | Count rate plots | Images |
|---|---|---|
| Comparison with Poisson distribution Blue bars denote a histogram of data divided into 1 sec bins. Red curve is a Poisson curve with rate = median count rate of data. |
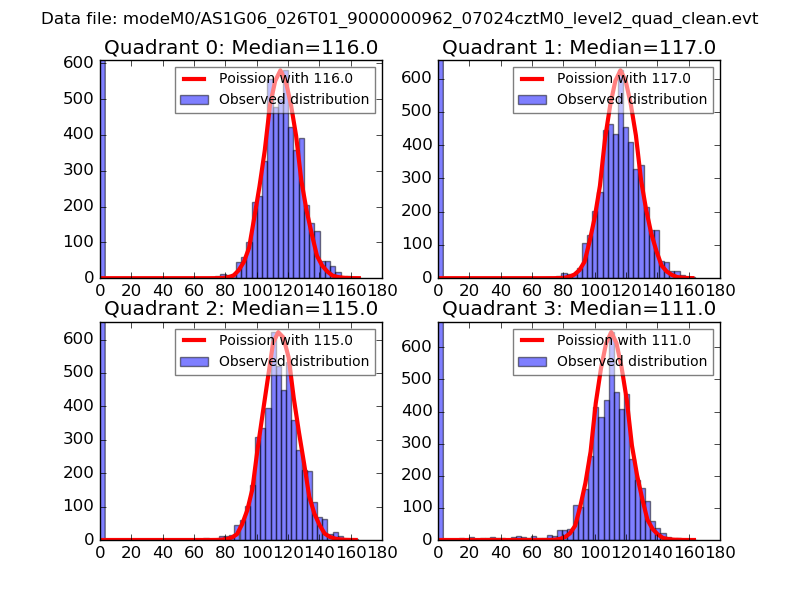 |
 |
| Quadrant-wise count rates Data is divided into 100 sec bins |
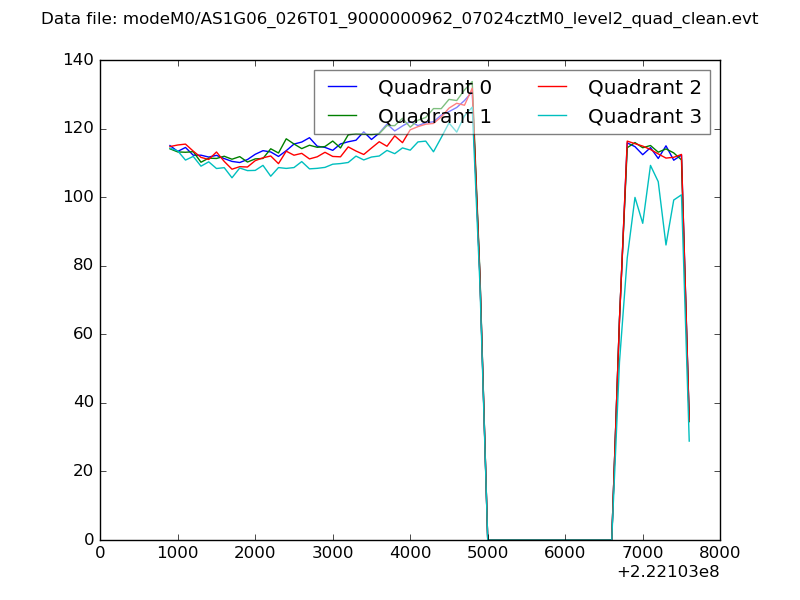 |
|
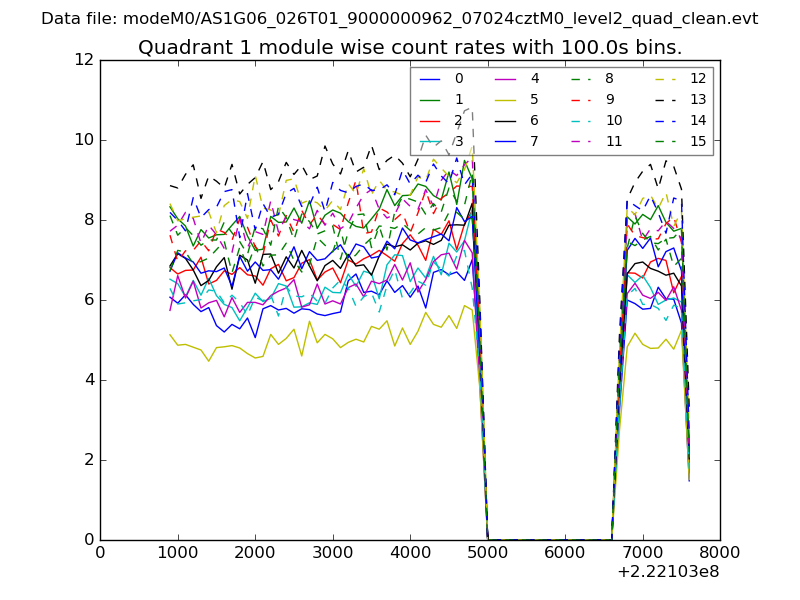
| Module-wise count rates for Quadrant A Data is divided into 100 sec bins |
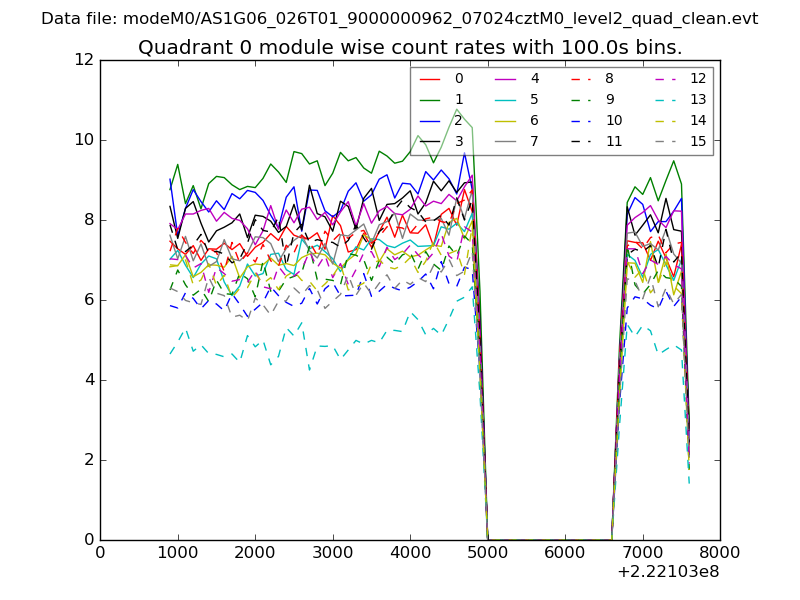 |
 |
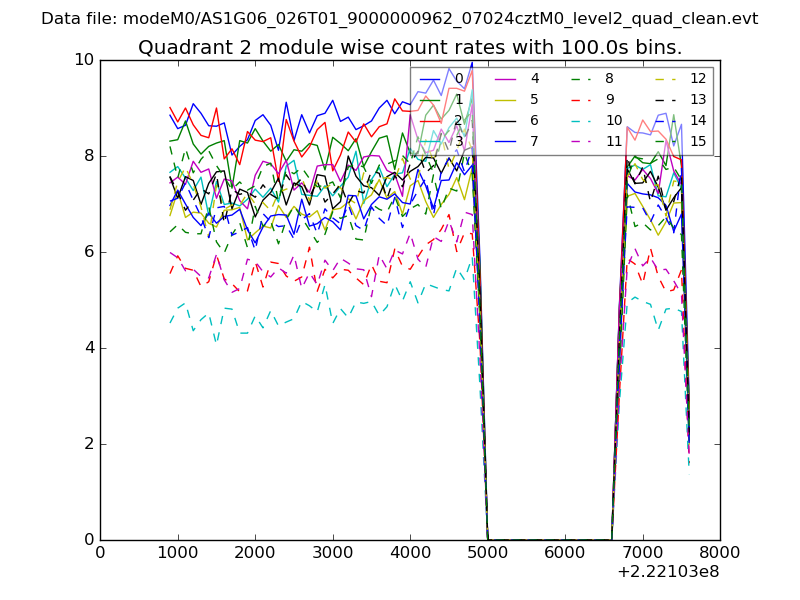
| Module-wise count rates for Quadrant B Data is divided into 100 sec bins |
 |
 |
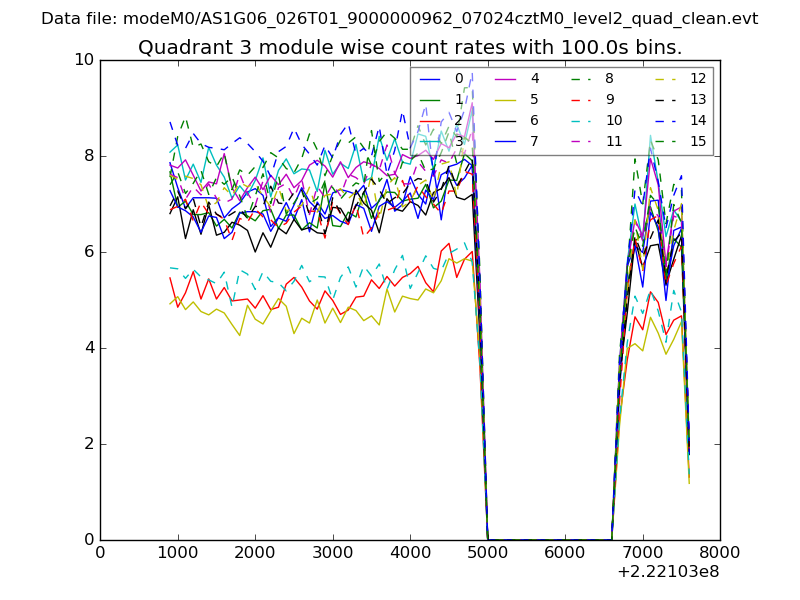
| Module-wise count rates for Quadrant C Data is divided into 100 sec bins |
 |
 |
| Module-wise count rates for Quadrant D Data is divided into 100 sec bins |
 |
 |
| Parameter | Plot |
|---|---|
| CZT HV Monitor | 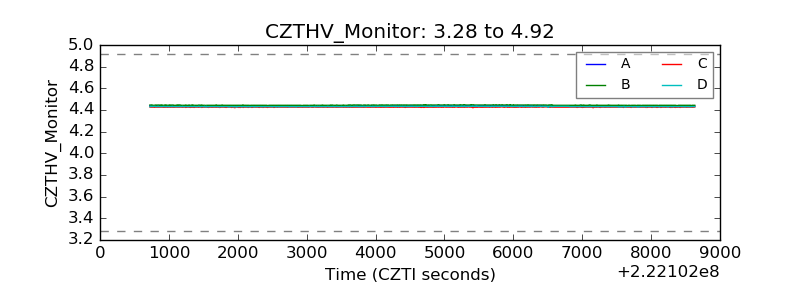 |
| D_VDD | 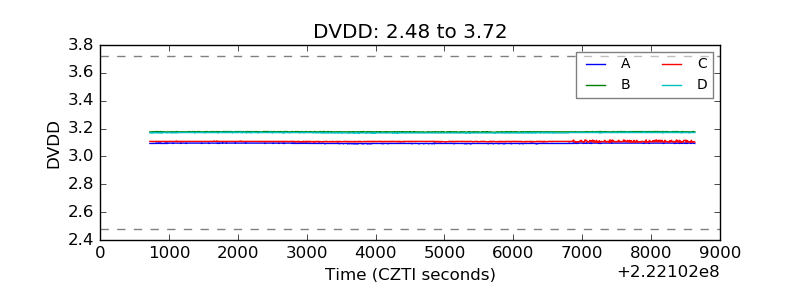 |
| Temperature 1 | 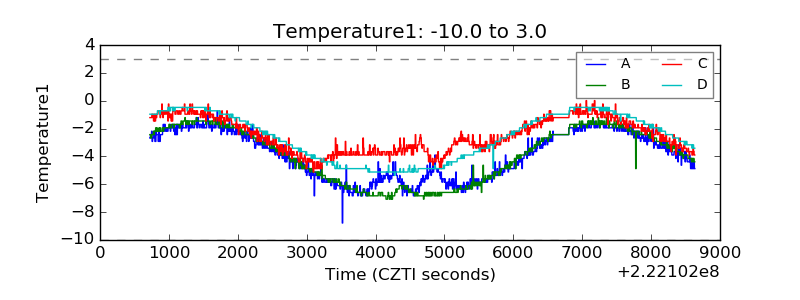 |
| Veto HV Monitor | 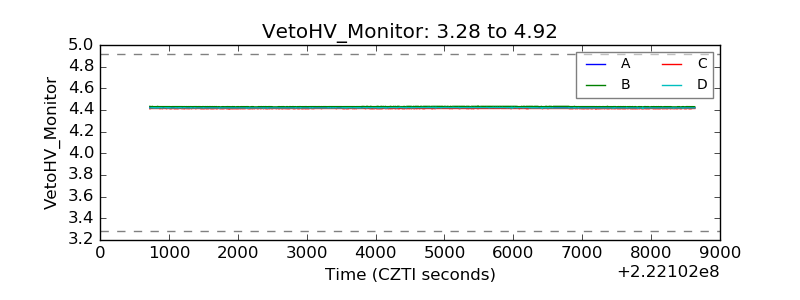 |
| Veto LLD | 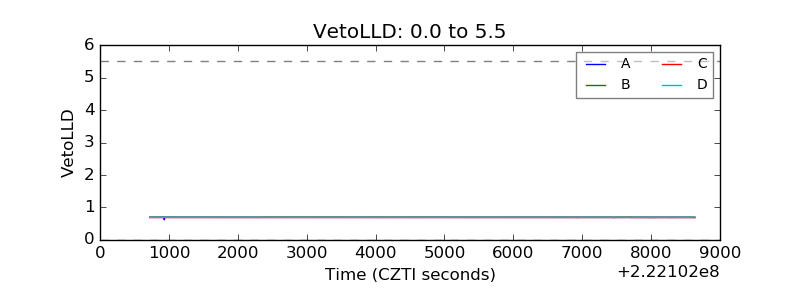 |
| Alpha Counter | 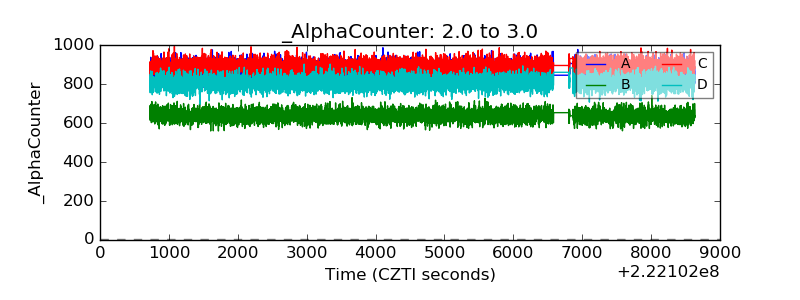 |
| _CPM_Rate | 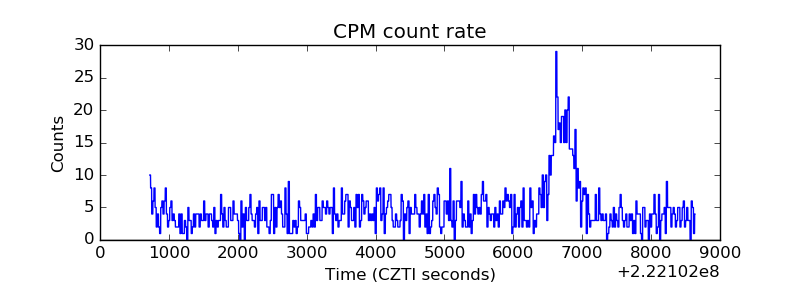 |
| CZT Counter | 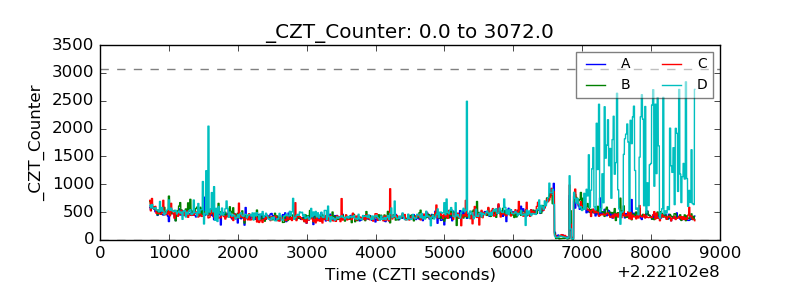 |
| +2.5 Volts monitor |  |
| +5 Volts monitor |  |
| _ROLL_ROT | 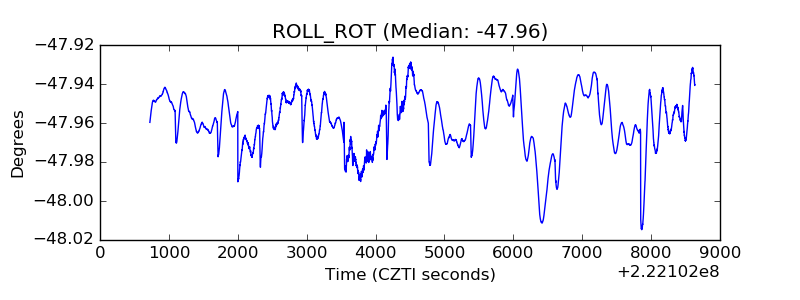 |
| _Roll_DEC | 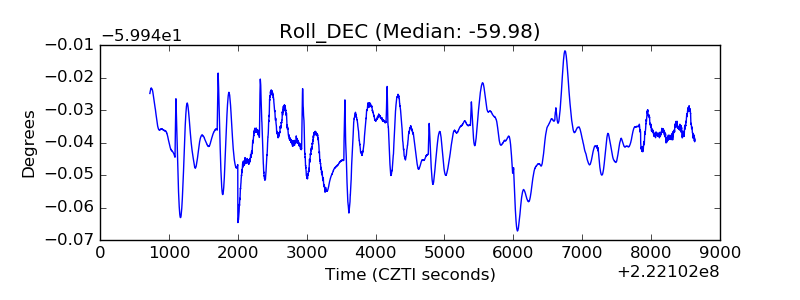 |
| _Roll_RA | 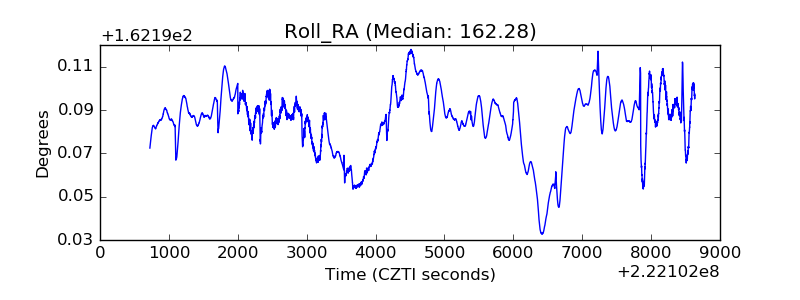 |
| Veto Counter | 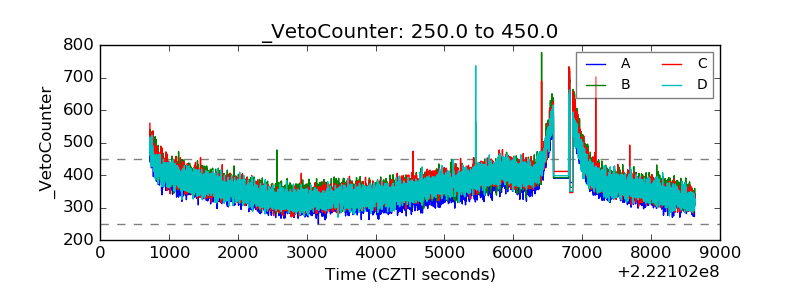 |