| Param | Original file | Final file |
|---|---|---|
| Filename | modeM0/AS1G06_026T01_9000000962_07025cztM0_level2.evt | modeM0/AS1G06_026T01_9000000962_07025cztM0_level2_quad_clean.evt |
| Size (bytes) | 236,937,600 | 36,538,560 |
| Size | 226.0 MB | 34.8 MB |
| Events in quadrant A | 1,068,245 | 240,050 |
| Events in quadrant B | 1,116,206 | 240,017 |
| Events in quadrant C | 1,044,581 | 238,090 |
| Events in quadrant D | 3,768,816 | 201,937 |
| Mode M0 | |||
|---|---|---|---|
| Quadrant | BADHDUFLAG | Total packets | Discarded packets |
| A | 0 | 5189 | 0 |
| B | 0 | 5251 | 0 |
| C | 0 | 5181 | 0 |
| D | 0 | 12979 | 0 |
| Mode SS | |||
|---|---|---|---|
| Quadrant | BADHDUFLAG | Total packets | Discarded packets |
| A | 0 | 52 | 0 |
| B | 0 | 52 | 0 |
| C | 0 | 52 | 0 |
| D | 0 | 52 | 0 |
| Quadrant | Total seconds | Saturated seconds | Saturation percentage |
|---|---|---|---|
| A | 2590 | 3 | 0.115830% |
| B | 2590 | 5 | 0.193050% |
| C | 2590 | 0 | 0.000000% |
| D | 2590 | 684 | 26.409266% |
Noise dominated data is calculated using 1-second bins in cleaned event files. If a bin has >2000 counts, and if more than 50% of those come from <1% of pixels, then it is considered to be noise-dominated and hence unusable.
| Quadrant | # 1 sec bins | Bins with >0 counts | Bins with >2000 counts | High rate bins dominated by noise | Noise dominated (total time) | Noise dominated (detector-on time) | Marked lightcurve |
|---|---|---|---|---|---|---|---|
| A | 2590 | 2590 | 0 | 0 | 0.00% | 0.00% | 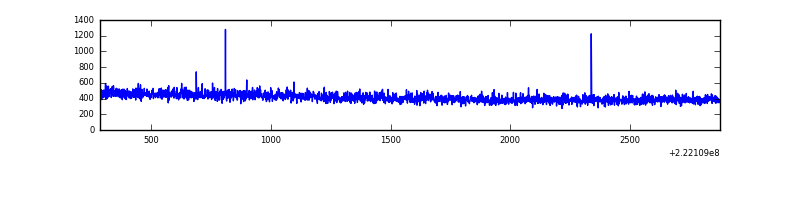 |
| B | 2590 | 2590 | 2 | 2 | 0.08% | 0.08% | 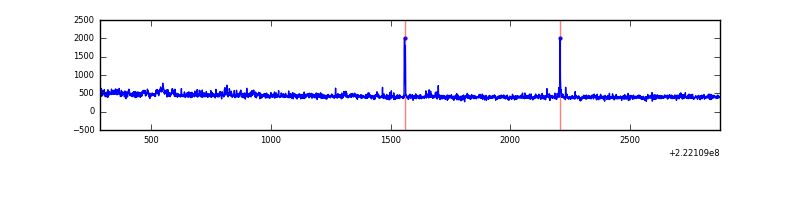 |
| C | 2590 | 2590 | 0 | 0 | 0.00% | 0.00% | 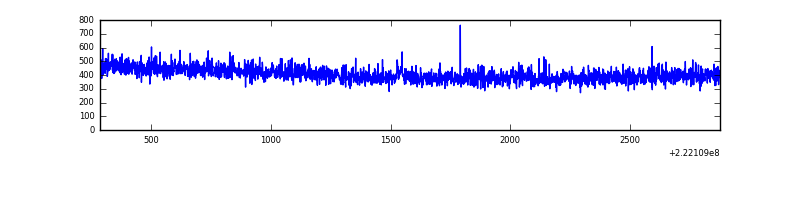 |
| D | 2590 | 2590 | 692 | 692 | 26.72% | 26.72% | 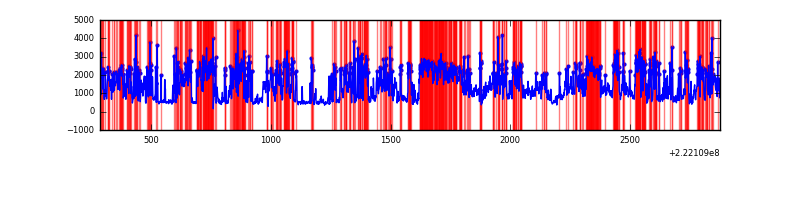 |
Top three noisy pixels from each quadrant. If the there are fewer than three noisy pixels in the level2.evt file, extra rows are filled as -1
| Pixel properties | Quadrant properties | ||||||
|---|---|---|---|---|---|---|---|
| Quadrant | DetID | PixID | Counts | Sigma | Mean | Median | Sigma |
| A | 0 | 226 | 2691 | 41.41 | 276 | 270 | 58.5 |
| A | 8 | 15 | 2643 | 40.59 | 276 | 270 | 58.5 |
| A | 12 | 194 | 2523 | 38.54 | 276 | 270 | 58.5 |
| B | 0 | 214 | 20471 | 368.69 | 277 | 271 | 54.8 |
| B | 0 | 228 | 6772 | 118.65 | 277 | 271 | 54.8 |
| B | 0 | 199 | 5411 | 93.81 | 277 | 271 | 54.8 |
| C | 8 | 128 | 5032 | 75.76 | 263 | 265 | 62.9 |
| C | 1 | 16 | 3308 | 48.36 | 263 | 265 | 62.9 |
| C | 8 | 112 | 2843 | 40.97 | 263 | 265 | 62.9 |
| D | 2 | 216 | 2687357 | 44594.46 | 238 | 230 | 60.3 |
| D | 8 | 195 | 102187 | 1692.04 | 238 | 230 | 60.3 |
| D | 2 | 136 | 58529 | 967.51 | 238 | 230 | 60.3 |
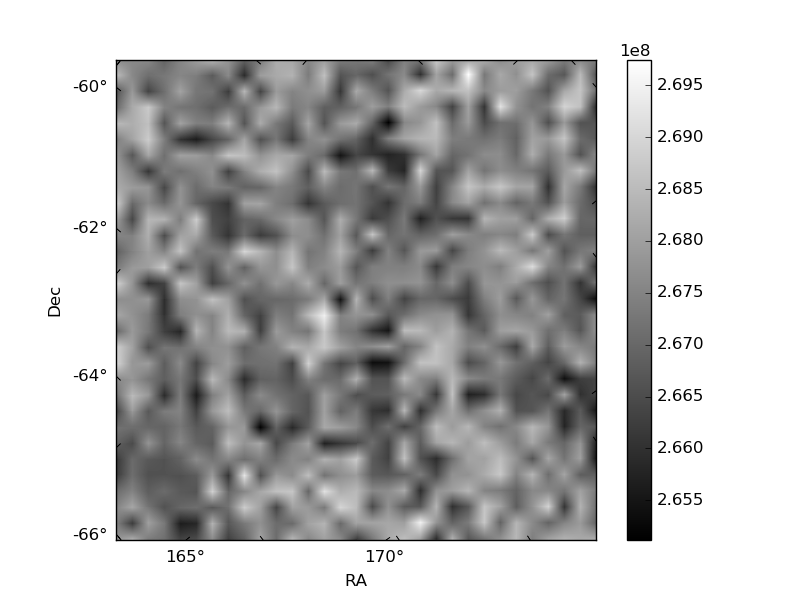
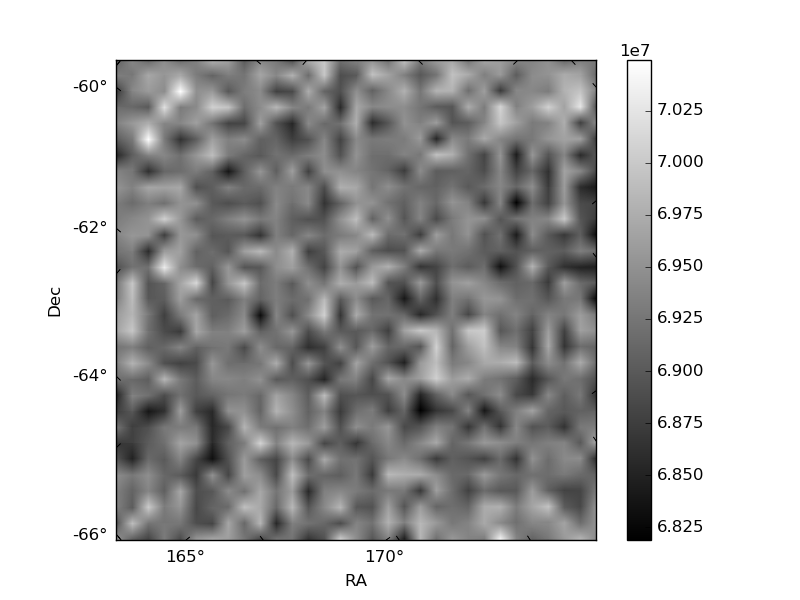
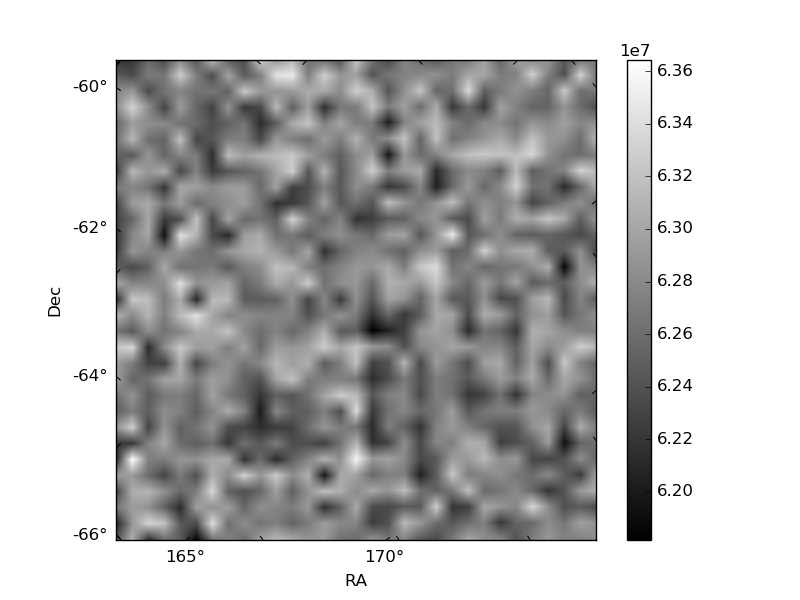
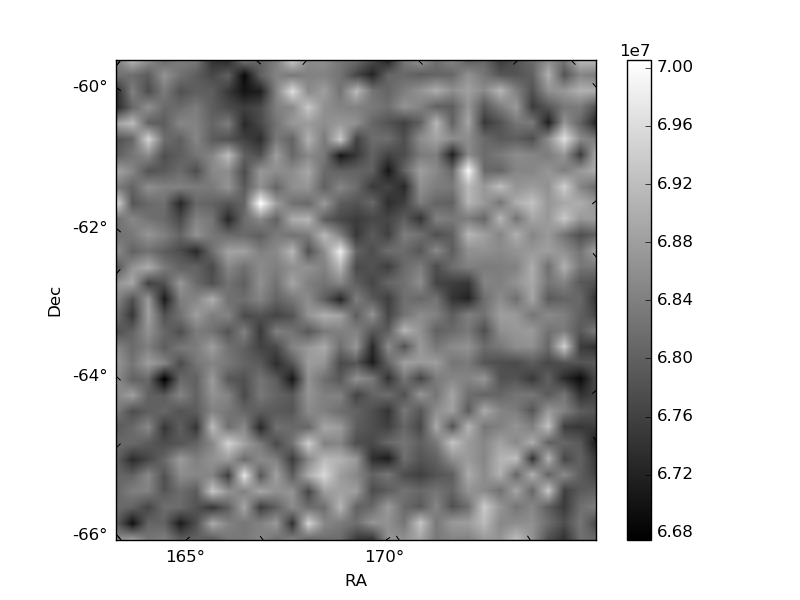
Histogram calculated using DETX and DETY for each event in the final _common_clean file
| Quadrant A | 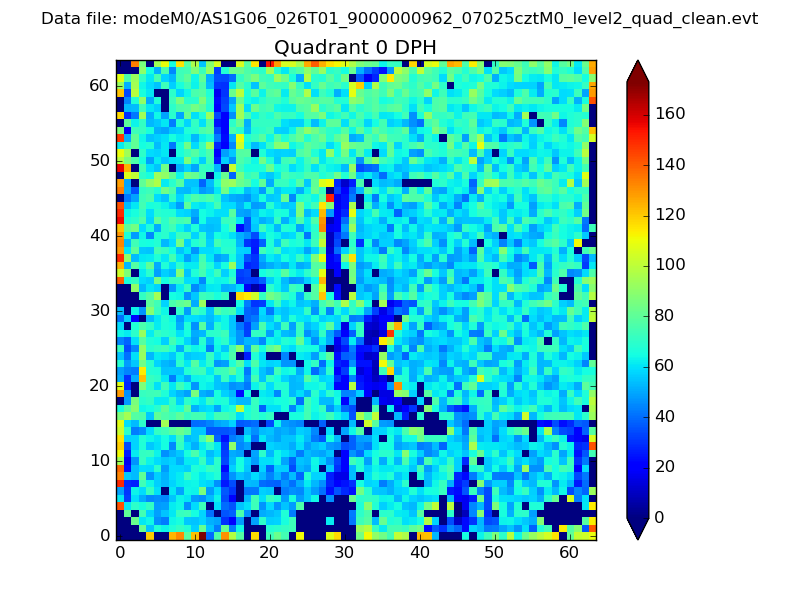 |
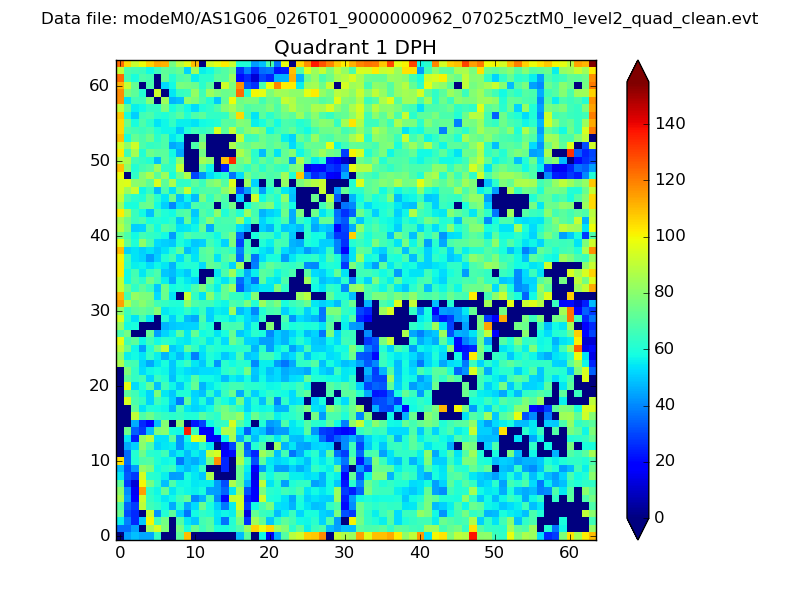 |
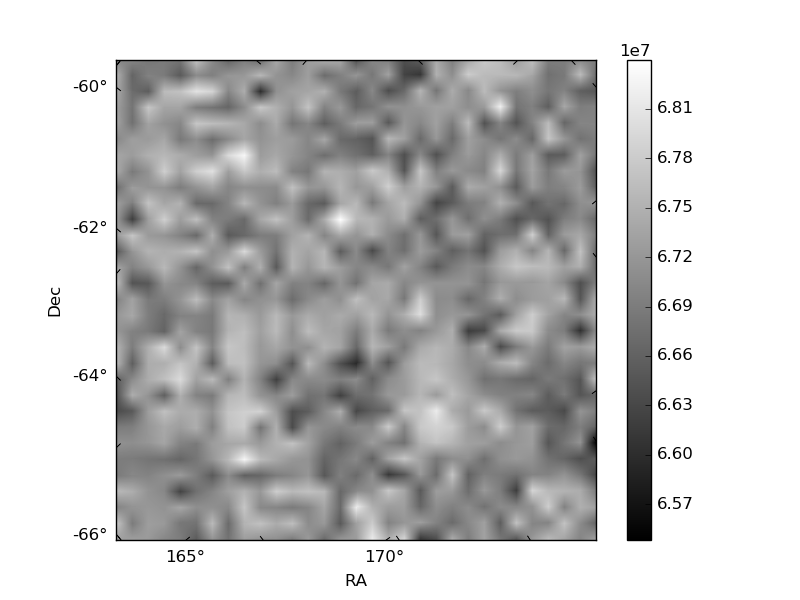
Quadrant B |
|---|---|---|---|
| Quadrant D | 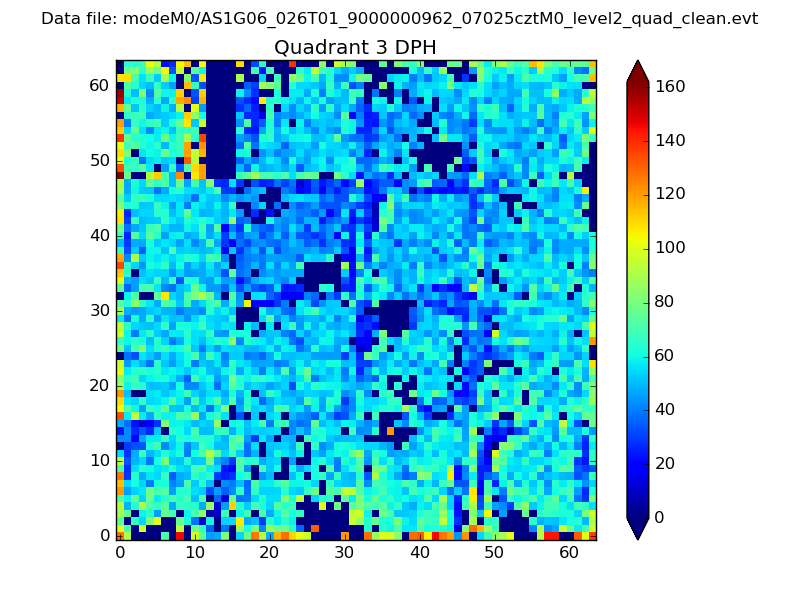 |
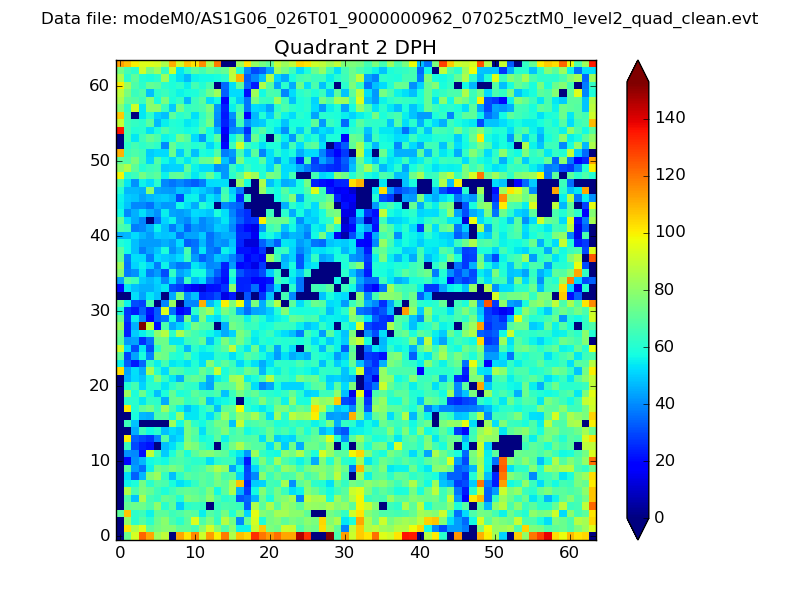 |
Quadrant C |
| Plot type | Count rate plots | Images |
|---|---|---|
| Comparison with Poisson distribution Blue bars denote a histogram of data divided into 1 sec bins. Red curve is a Poisson curve with rate = median count rate of data. |
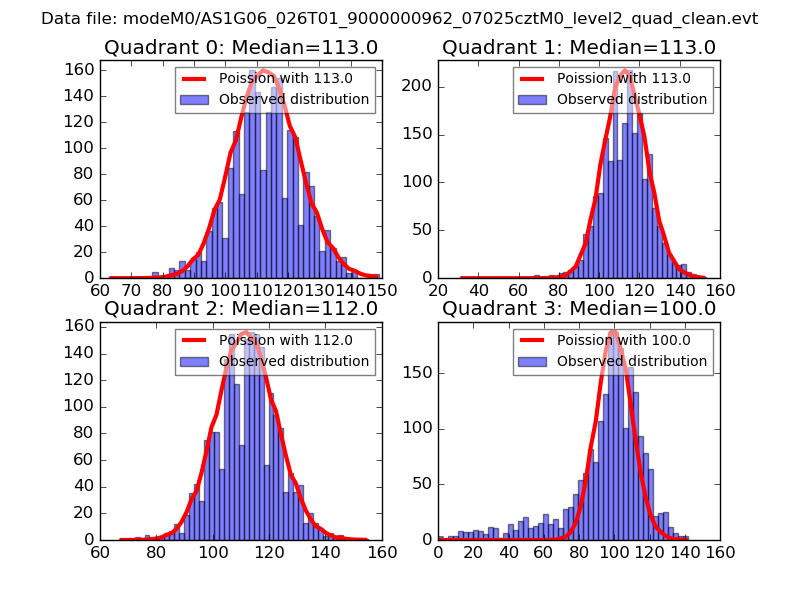 |
 |
| Quadrant-wise count rates Data is divided into 100 sec bins |
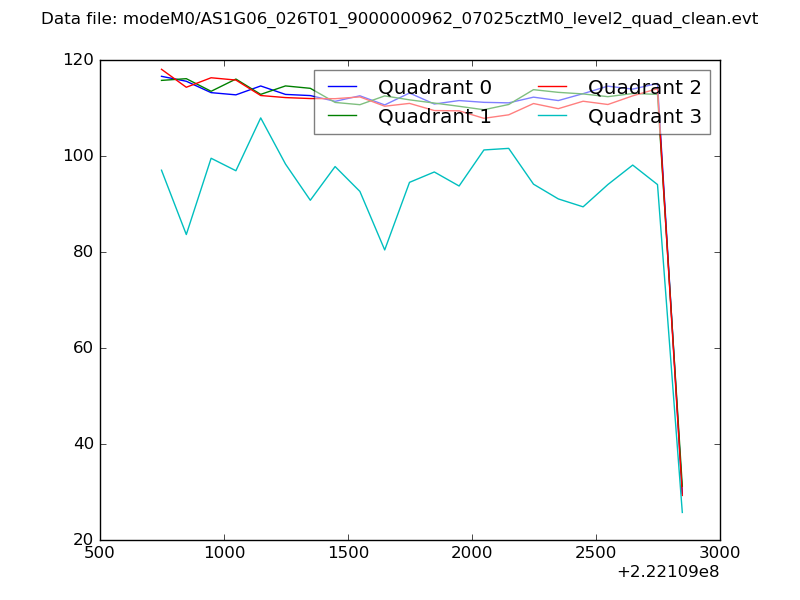 |
|
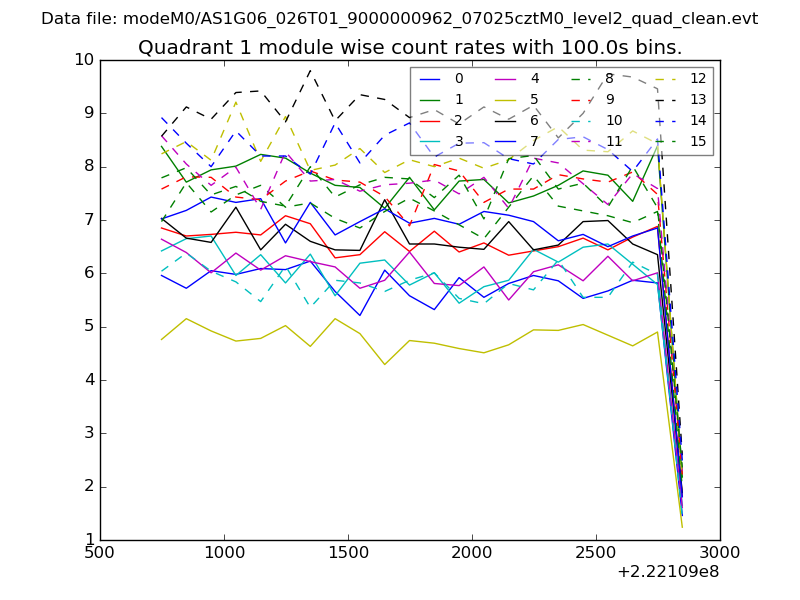
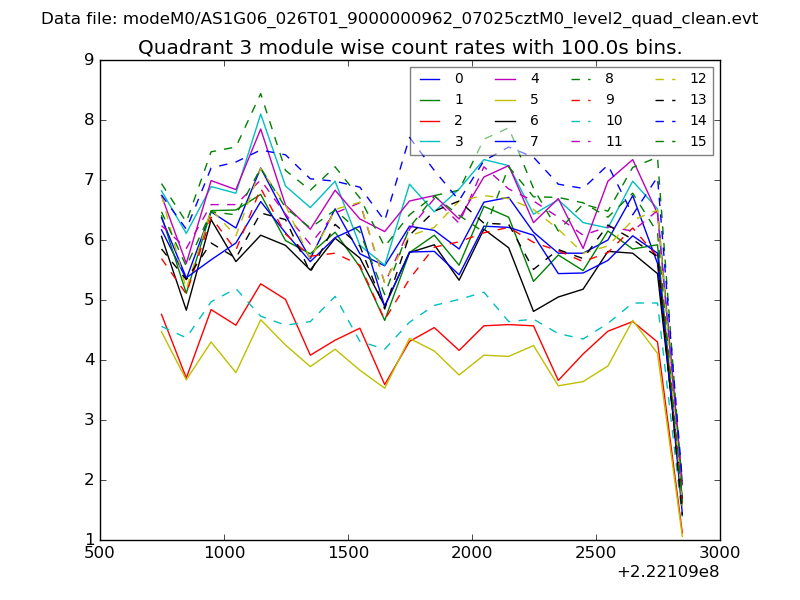
| Module-wise count rates for Quadrant A Data is divided into 100 sec bins |
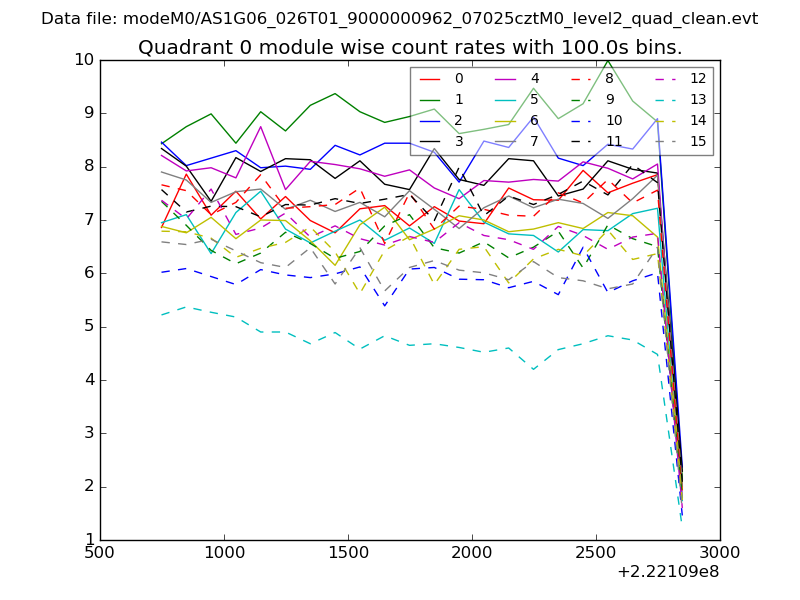 |
 |
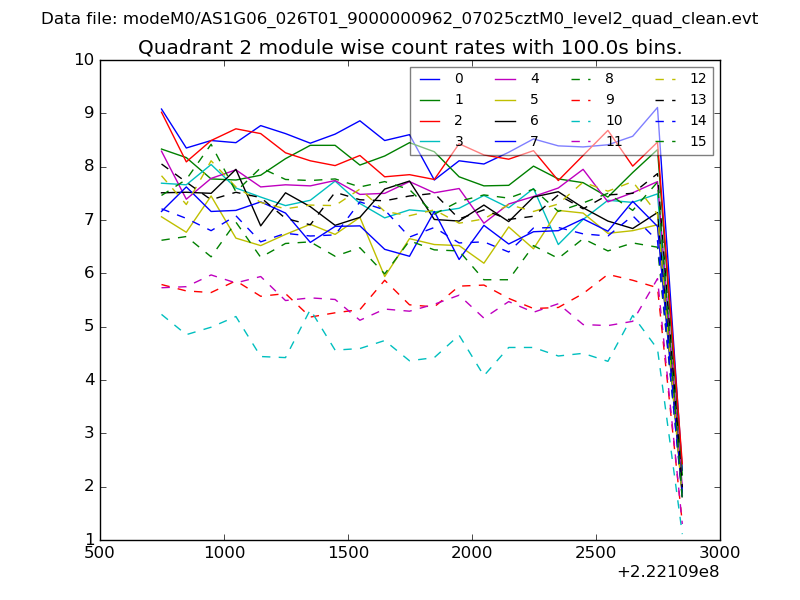
| Module-wise count rates for Quadrant B Data is divided into 100 sec bins |
 |
 |
| Module-wise count rates for Quadrant C Data is divided into 100 sec bins |
 |
 |
| Module-wise count rates for Quadrant D Data is divided into 100 sec bins |
 |
 |
| Parameter | Plot |
|---|---|
| CZT HV Monitor |  |
| D_VDD | 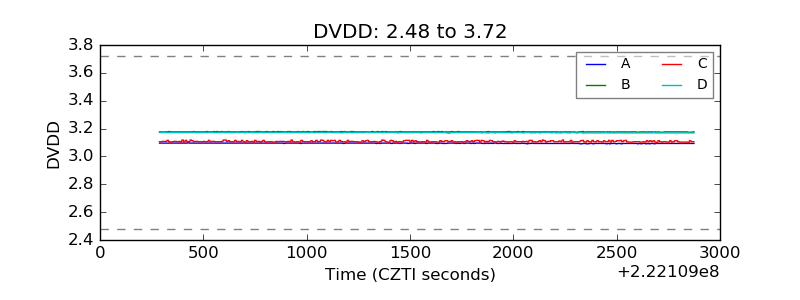 |
| Temperature 1 | 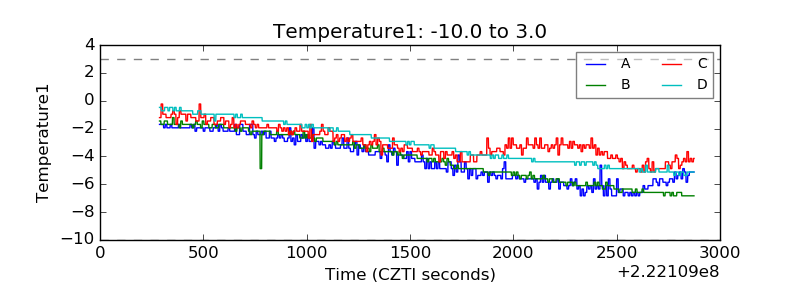 |
| Veto HV Monitor | 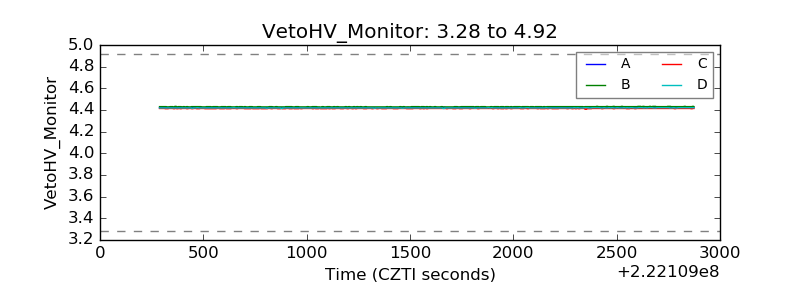 |
| Veto LLD | 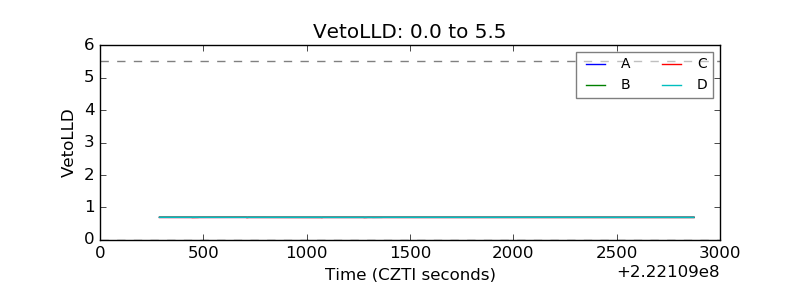 |
| Alpha Counter | 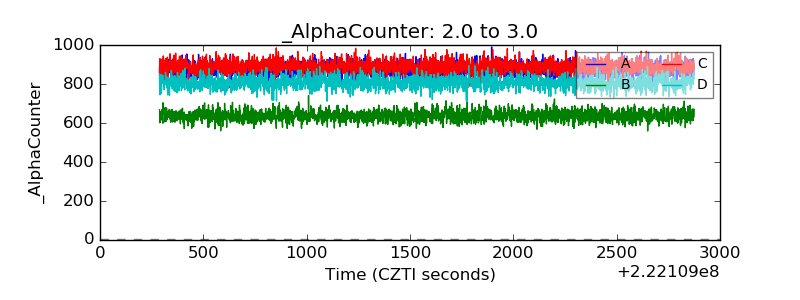 |
| _CPM_Rate | 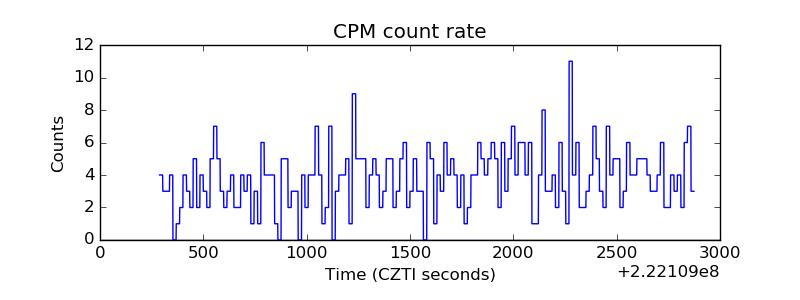 |
| CZT Counter | 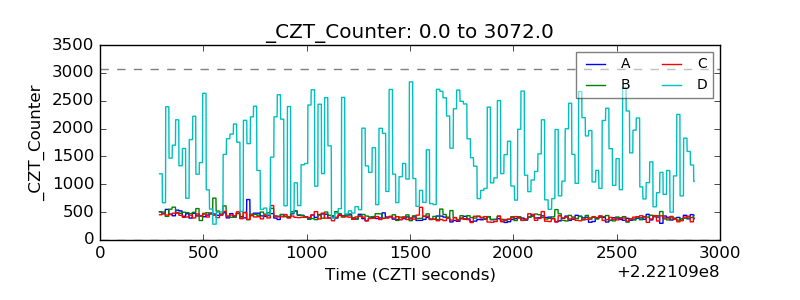 |
| +2.5 Volts monitor |  |
| +5 Volts monitor |  |
| _ROLL_ROT | 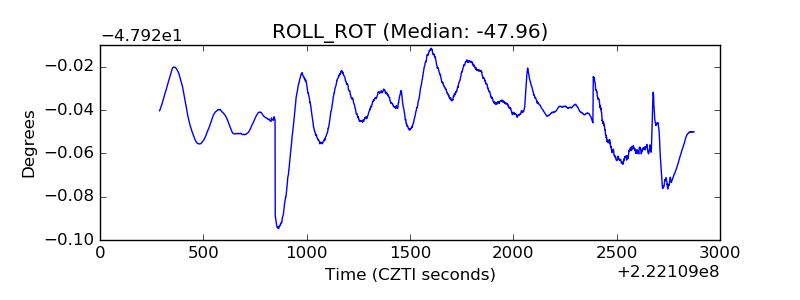 |
| _Roll_DEC | 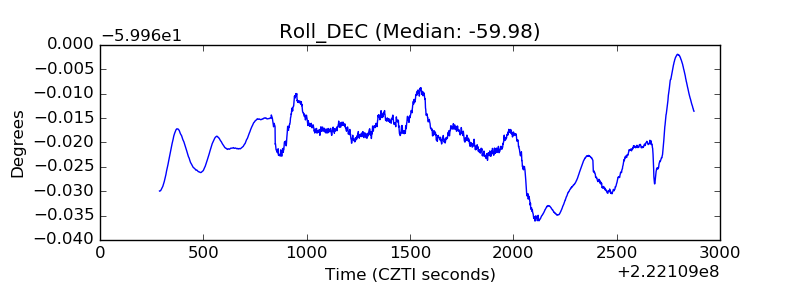 |
| _Roll_RA | 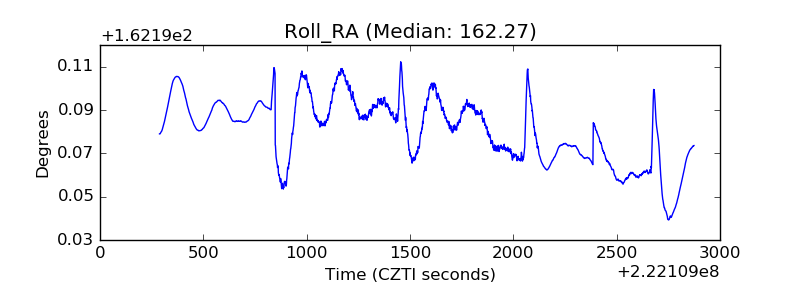 |
| Veto Counter | 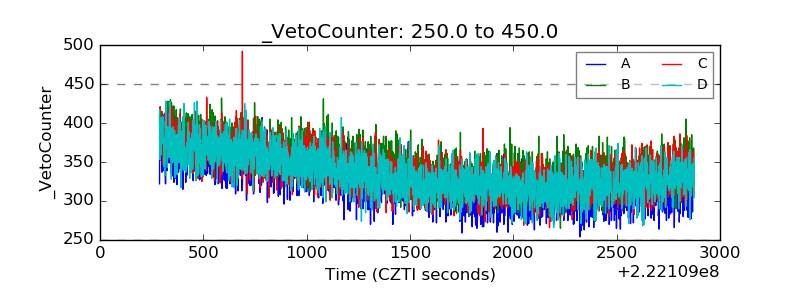 |