| Param | Original file | Final file |
|---|---|---|
| Filename | modeM0/AS1G06_029T01_9000000964cztM0_level2.fits | modeM0/AS1G06_029T01_9000000964cztM0_level2_quad_clean.evt |
| Size (bytes) | 1,252,676,160 | 1,355,302,080 |
| Size | 1.2 GB | 1.3 GB |
| Events in quadrant A | 7,629,472 | 8,408,808 |
| Events in quadrant B | 7,379,102 | 8,397,463 |
| Events in quadrant C | 7,472,306 | 8,005,317 |
| Events in quadrant D | 6,382,416 | 7,165,464 |
| Mode M0 | |||
|---|---|---|---|
| Quadrant | BADHDUFLAG | Total packets | Discarded packets |
| A | 0 | 275320 | 0 |
| B | 0 | 287702 | 0 |
| C | 0 | 277258 | 0 |
| D | 0 | 321052 | 0 |
| Mode M9 | |||
|---|---|---|---|
| Quadrant | BADHDUFLAG | Total packets | Discarded packets |
| A | 0 | 222 | 0 |
| B | 0 | 222 | 0 |
| C | 0 | 222 | 0 |
| D | 0 | 222 | 0 |
| Mode SS | |||
|---|---|---|---|
| Quadrant | BADHDUFLAG | Total packets | Discarded packets |
| A | 0 | 2696 | 0 |
| B | 0 | 2696 | 0 |
| C | 0 | 2696 | 0 |
| D | 0 | 2696 | 0 |
| Quadrant | Total seconds | Saturated seconds | Saturation percentage |
|---|---|---|---|
| A | 132415 | 1796 | 1.356342% |
| B | 132415 | 2335 | 1.763395% |
| C | 132415 | 1620 | 1.223426% |
| D | 132415 | 3974 | 3.001171% |
Noise dominated data is calculated using 1-second bins in cleaned event files. If a bin has >2000 counts, and if more than 50% of those come from <1% of pixels, then it is considered to be noise-dominated and hence unusable.
| Quadrant | # 1 sec bins | Bins with >0 counts | Bins with >2000 counts | High rate bins dominated by noise | Noise dominated (total time) | Noise dominated (detector-on time) | Marked lightcurve |
|---|---|---|---|---|---|---|---|
| A | 154500 | 132413 | 0 | 0 | 0.00% | 0.00% |  |
| B | 154500 | 132403 | 0 | 0 | 0.00% | 0.00% |  |
| C | 154500 | 132406 | 0 | 0 | 0.00% | 0.00% |  |
| D | 154500 | 132385 | 0 | 0 | 0.00% | 0.00% |  |
Top three noisy pixels from each quadrant. If the there are fewer than three noisy pixels in the level2.evt file, extra rows are filled as -1
| Pixel properties | Quadrant properties | ||||||
|---|---|---|---|---|---|---|---|
| Quadrant | DetID | PixID | Counts | Sigma | Mean | Median | Sigma |
| A | 14 | 188 | 7753 | 11.79 | 1979 | 1846 | 500.9 |
| A | 0 | 29 | 7496 | 11.28 | 1979 | 1846 | 500.9 |
| A | 14 | 204 | 6615 | 9.52 | 1979 | 1846 | 500.9 |
| B | 2 | 9 | 6347 | 11.54 | 1946 | 1852 | 389.6 |
| B | 12 | 226 | 5093 | 8.32 | 1946 | 1852 | 389.6 |
| B | 14 | 254 | 4994 | 8.07 | 1946 | 1852 | 389.6 |
| C | 1 | 80 | 5903 | 7.8 | 1972 | 1830 | 522.5 |
| C | 1 | 81 | 5834 | 7.66 | 1972 | 1830 | 522.5 |
| C | 12 | 241 | 5187 | 6.42 | 1972 | 1830 | 522.5 |
| D | 3 | 14 | 4840 | 6.54 | 1819 | 1653 | 487.4 |
| D | 6 | 231 | 4661 | 6.17 | 1819 | 1653 | 487.4 |
| D | 11 | 82 | 4603 | 6.05 | 1819 | 1653 | 487.4 |
Histogram calculated using DETX and DETY for each event in the final _common_clean file
| Quadrant A | 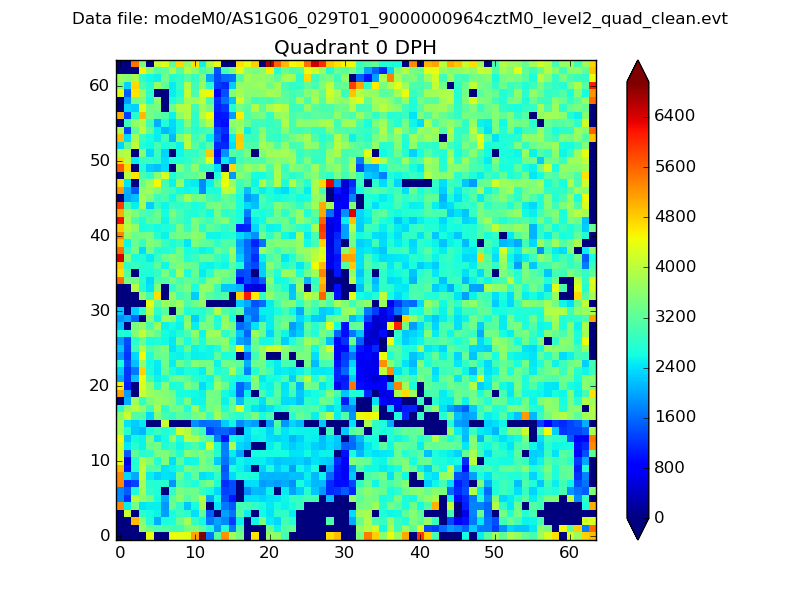 |
 |
Quadrant B |
|---|---|---|---|
| Quadrant D |  |
 |
Quadrant C |
| Plot type | Count rate plots | Images |
|---|---|---|
| Comparison with Poisson distribution Blue bars denote a histogram of data divided into 1 sec bins. Red curve is a Poisson curve with rate = median count rate of data. |
 |
 |
| Quadrant-wise count rates Data is divided into 100 sec bins |
 |
|
| Module-wise count rates for Quadrant A Data is divided into 100 sec bins |
 |
 |
| Module-wise count rates for Quadrant B Data is divided into 100 sec bins |
 |
 |
| Module-wise count rates for Quadrant C Data is divided into 100 sec bins |
 |
 |
| Module-wise count rates for Quadrant D Data is divided into 100 sec bins |
 |
 |
| Parameter | Plot |
|---|---|
| CZT HV Monitor |  |
| D_VDD | 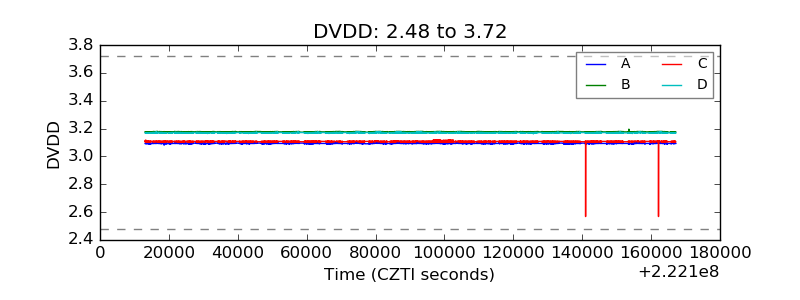 |
| Temperature 1 |  |
| Veto HV Monitor |  |
| Veto LLD |  |
| Alpha Counter |  |
| _CPM_Rate |  |
| CZT Counter |  |
| +2.5 Volts monitor |  |
| +5 Volts monitor |  |
| _ROLL_ROT |  |
| _Roll_DEC |  |
| _Roll_RA |  |
| Veto Counter |  |