| Param | Original file | Final file |
|---|---|---|
| Filename | modeM0/AS1G06_029T01_9000000964_07028cztM0_level2.evt | modeM0/AS1G06_029T01_9000000964_07028cztM0_level2_quad_clean.evt |
| Size (bytes) | 1,296,976,320 | 245,234,880 |
| Size | 1.2 GB | 233.9 MB |
| Events in quadrant A | 8,560,326 | 1,567,574 |
| Events in quadrant B | 8,657,170 | 1,583,180 |
| Events in quadrant C | 8,243,068 | 1,566,217 |
| Events in quadrant D | 12,588,032 | 1,456,235 |
| Mode M0 | |||
|---|---|---|---|
| Quadrant | BADHDUFLAG | Total packets | Discarded packets |
| A | 0 | 37753 | 4 |
| B | 0 | 37764 | 3 |
| C | 0 | 37069 | 3 |
| D | 0 | 49492 | 3 |
| Mode M9 | |||
|---|---|---|---|
| Quadrant | BADHDUFLAG | Total packets | Discarded packets |
| A | 0 | 20 | 0 |
| B | 0 | 20 | 0 |
| C | 0 | 20 | 0 |
| D | 0 | 20 | 0 |
| Mode SS | |||
|---|---|---|---|
| Quadrant | BADHDUFLAG | Total packets | Discarded packets |
| A | 0 | 368 | 0 |
| B | 0 | 368 | 0 |
| C | 0 | 368 | 0 |
| D | 0 | 368 | 0 |
| Quadrant | Total seconds | Saturated seconds | Saturation percentage |
|---|---|---|---|
| A | 18207 | 275 | 1.510408% |
| B | 18207 | 119 | 0.653595% |
| C | 18207 | 37 | 0.203219% |
| D | 18207 | 948 | 5.206789% |
Noise dominated data is calculated using 1-second bins in cleaned event files. If a bin has >2000 counts, and if more than 50% of those come from <1% of pixels, then it is considered to be noise-dominated and hence unusable.
| Quadrant | # 1 sec bins | Bins with >0 counts | Bins with >2000 counts | High rate bins dominated by noise | Noise dominated (total time) | Noise dominated (detector-on time) | Marked lightcurve |
|---|---|---|---|---|---|---|---|
| A | 20107 | 18210 | 0 | 0 | 0.00% | 0.00% | 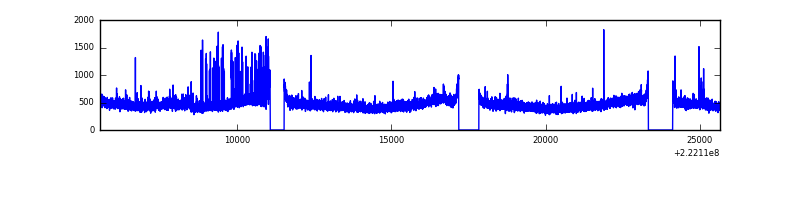 |
| B | 20107 | 18210 | 6 | 6 | 0.03% | 0.03% | 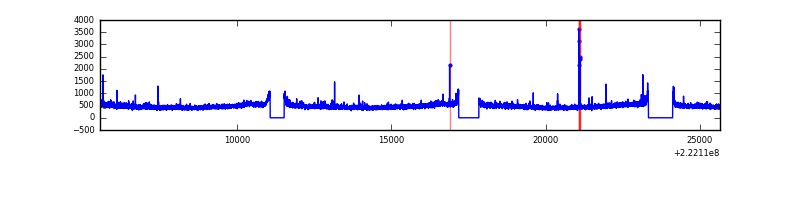 |
| C | 20107 | 18210 | 3 | 3 | 0.01% | 0.02% | 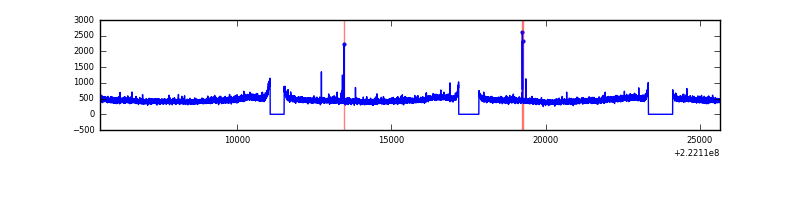 |
| D | 20107 | 18210 | 794 | 794 | 3.95% | 4.36% | 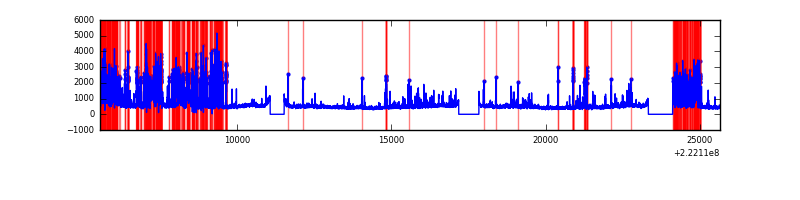 |
Top three noisy pixels from each quadrant. If the there are fewer than three noisy pixels in the level2.evt file, extra rows are filled as -1
| Pixel properties | Quadrant properties | ||||||
|---|---|---|---|---|---|---|---|
| Quadrant | DetID | PixID | Counts | Sigma | Mean | Median | Sigma |
| A | 14 | 111 | 173692 | 390.95 | 2142 | 2094 | 438.9 |
| A | 15 | 234 | 81206 | 180.24 | 2142 | 2094 | 438.9 |
| A | 8 | 15 | 43107 | 93.44 | 2142 | 2094 | 438.9 |
| B | 0 | 214 | 89582 | 211.01 | 2168 | 2115 | 414.5 |
| B | 7 | 202 | 57087 | 132.61 | 2168 | 2115 | 414.5 |
| B | 0 | 219 | 41441 | 94.87 | 2168 | 2115 | 414.5 |
| C | 12 | 4 | 22928 | 42.6 | 2100 | 2118 | 488.5 |
| C | 1 | 16 | 20595 | 37.83 | 2100 | 2118 | 488.5 |
| C | 13 | 61 | 16064 | 28.55 | 2100 | 2118 | 488.5 |
| D | 2 | 216 | 3129403 | 6090.89 | 2067 | 2008 | 513.5 |
| D | 12 | 233 | 767039 | 1489.97 | 2067 | 2008 | 513.5 |
| D | 8 | 195 | 550000 | 1067.26 | 2067 | 2008 | 513.5 |
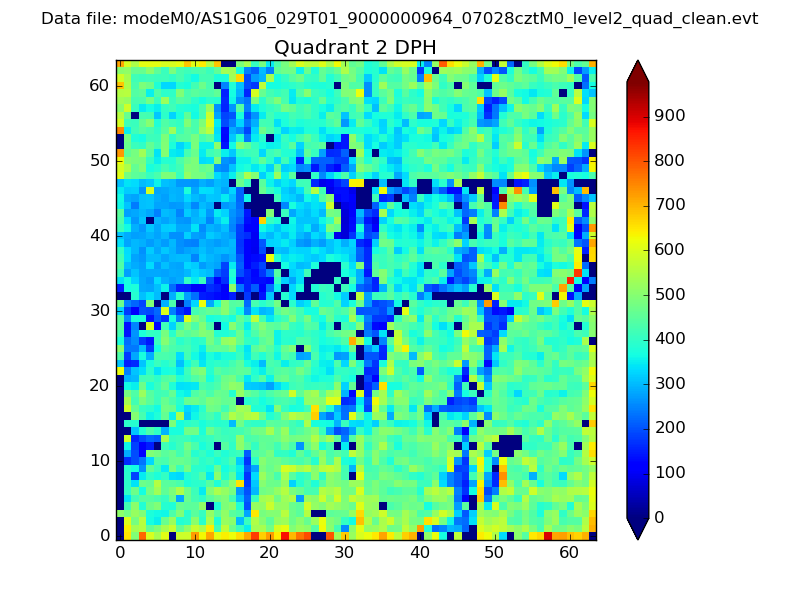
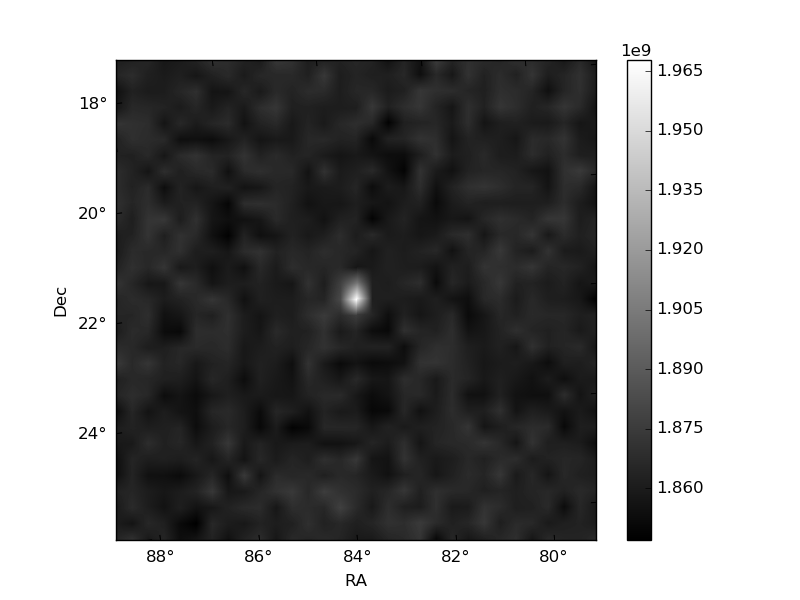
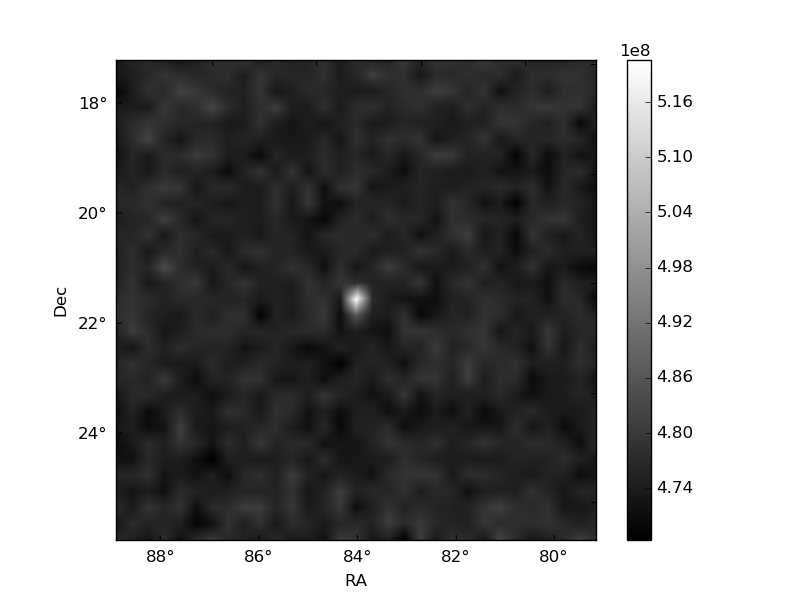
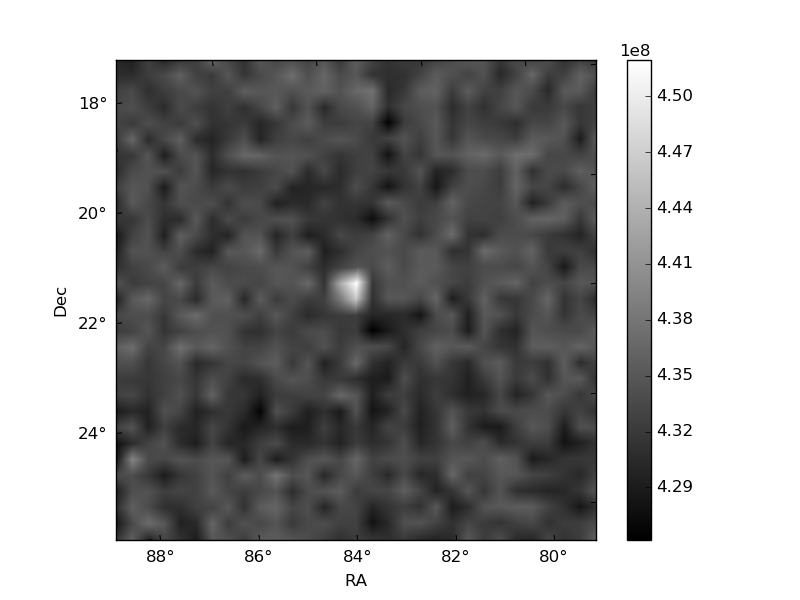
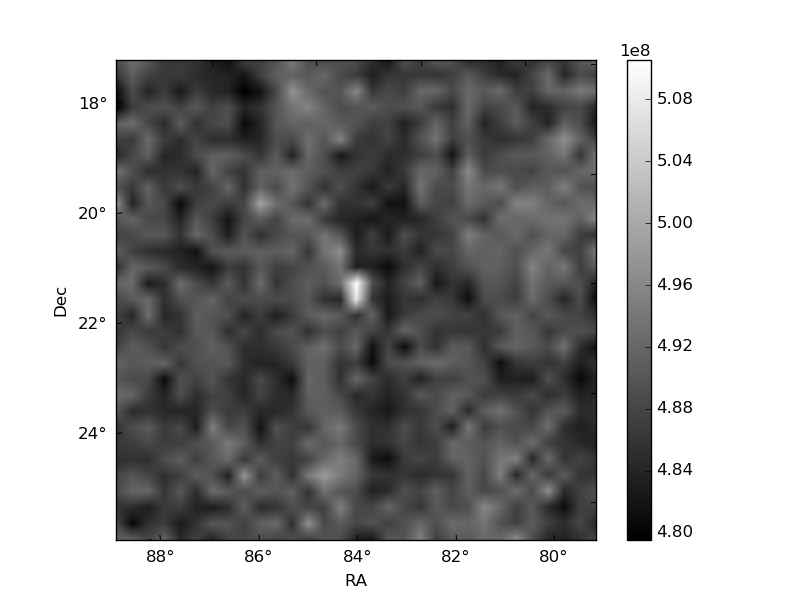
Histogram calculated using DETX and DETY for each event in the final _common_clean file
| Quadrant A | 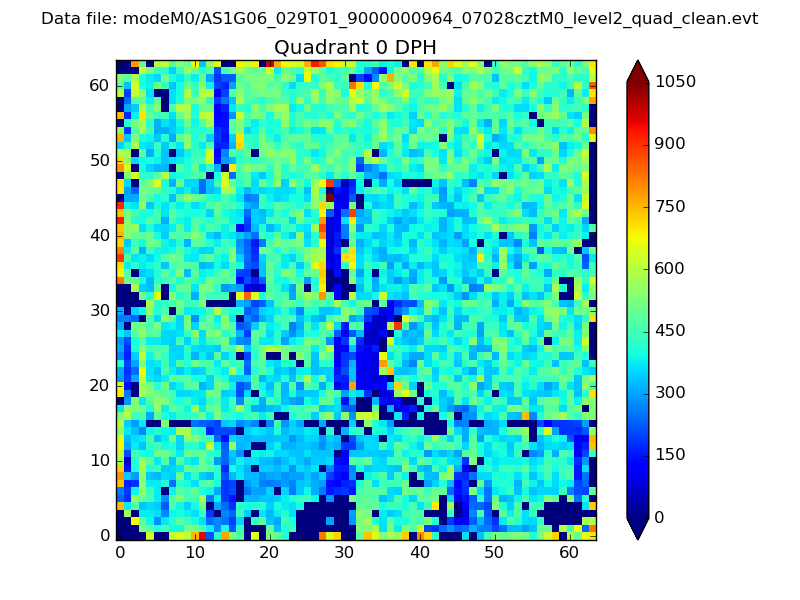 |
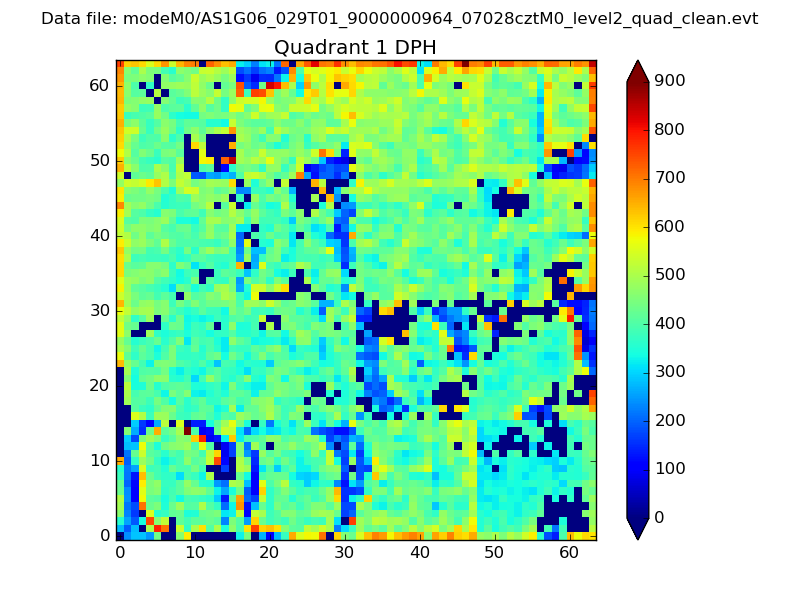 |
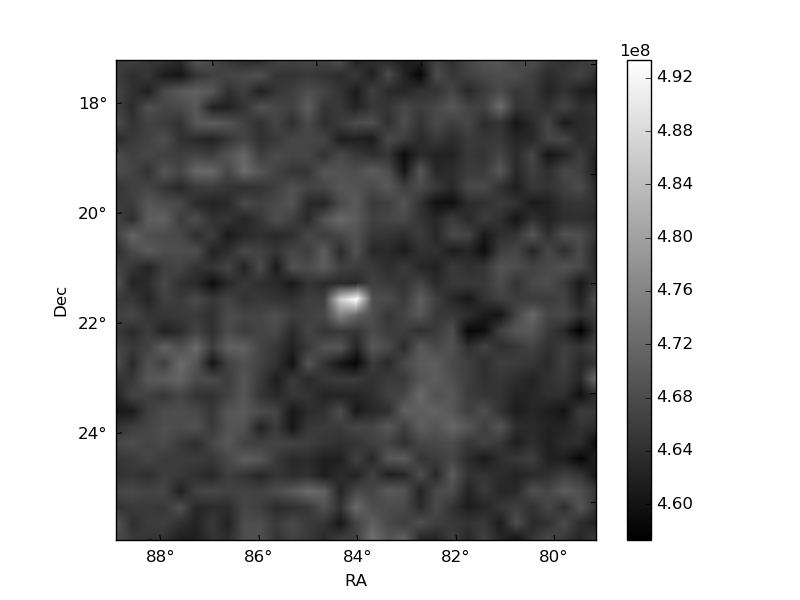
Quadrant B |
|---|---|---|---|
| Quadrant D | 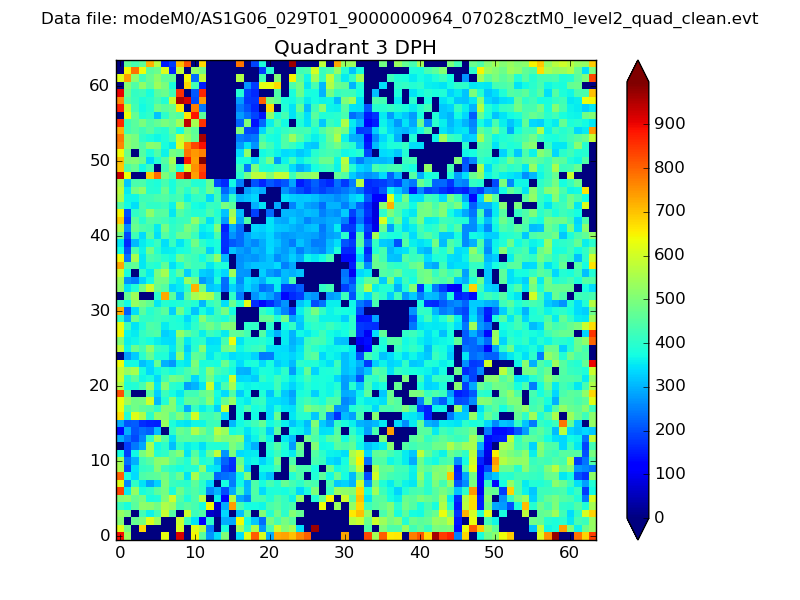 |
 |
Quadrant C |
| Plot type | Count rate plots | Images |
|---|---|---|
| Comparison with Poisson distribution Blue bars denote a histogram of data divided into 1 sec bins. Red curve is a Poisson curve with rate = median count rate of data. |
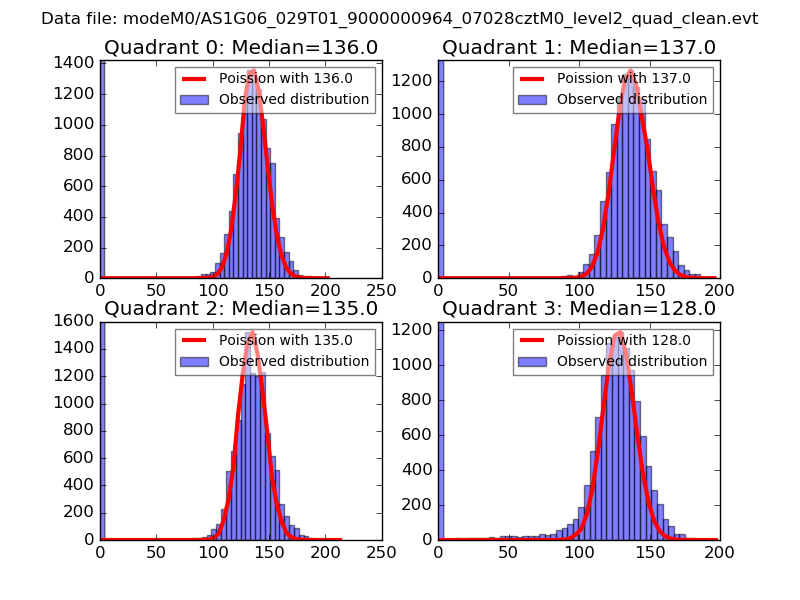 |
 |
| Quadrant-wise count rates Data is divided into 100 sec bins |
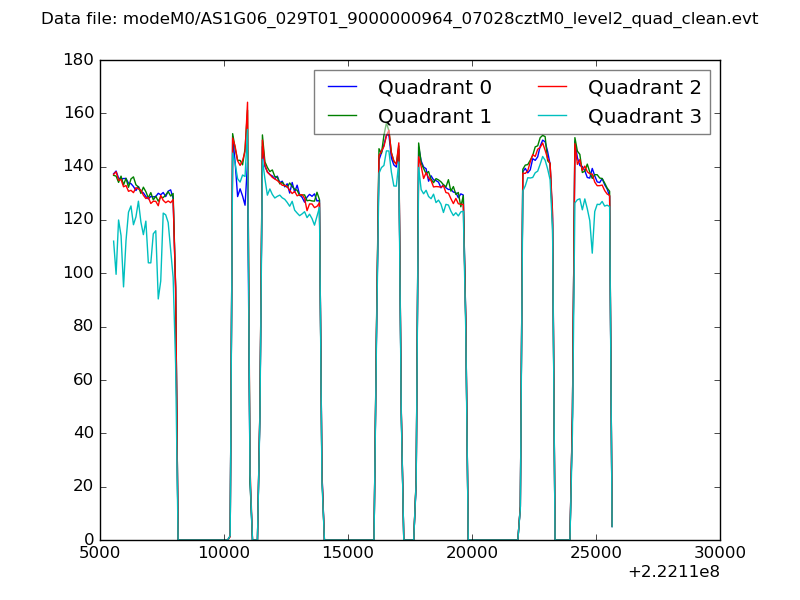 |
|
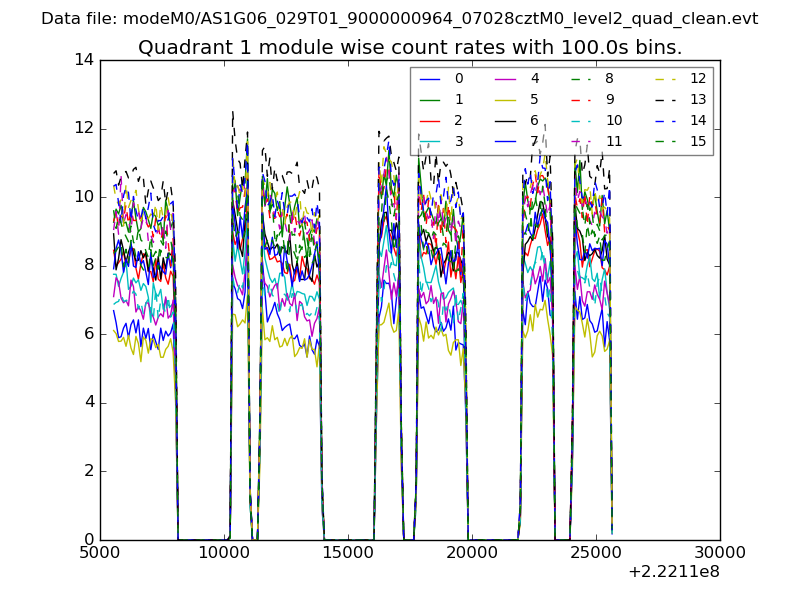
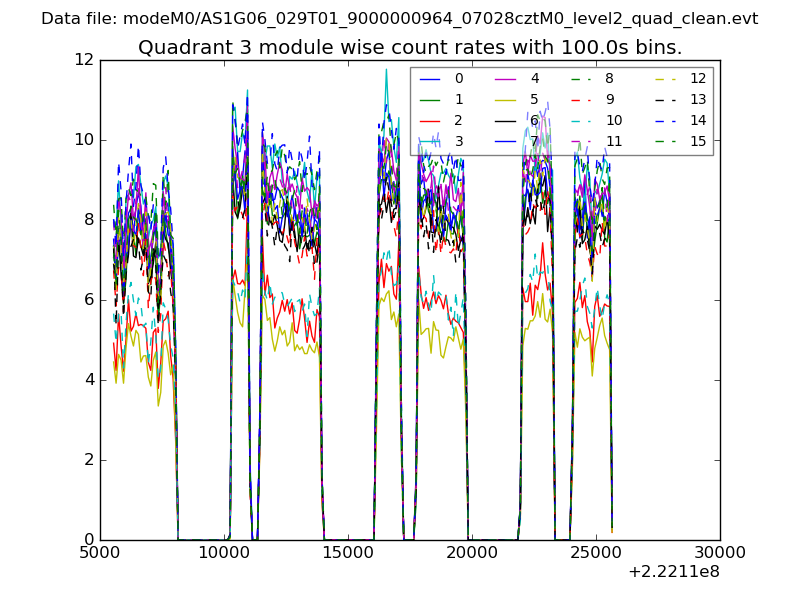
| Module-wise count rates for Quadrant A Data is divided into 100 sec bins |
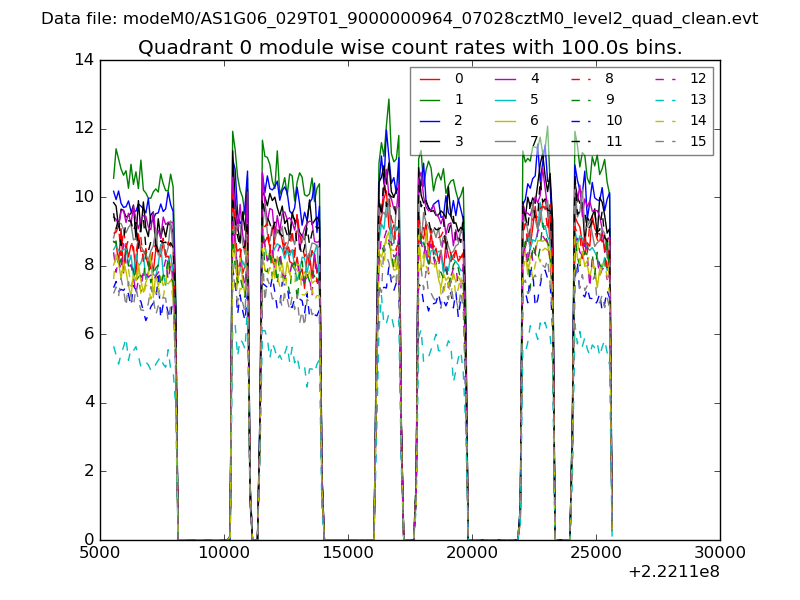 |
 |
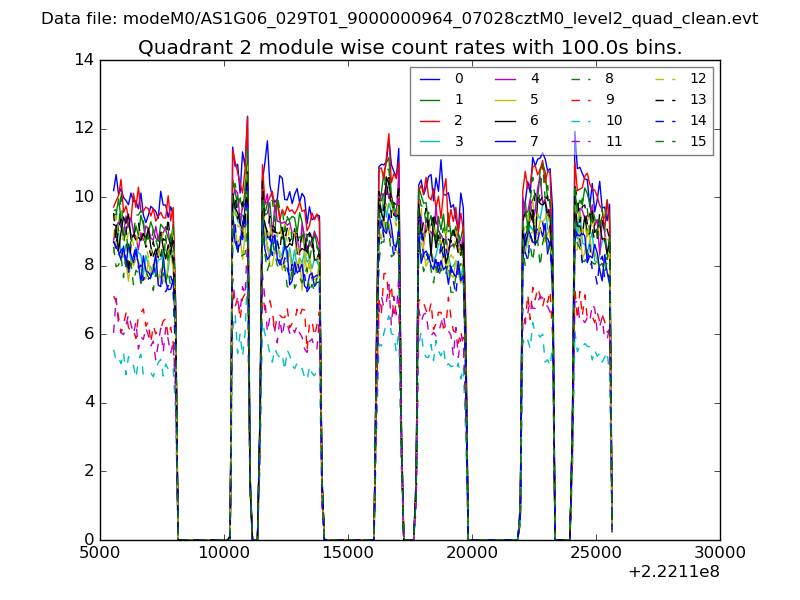
| Module-wise count rates for Quadrant B Data is divided into 100 sec bins |
 |
 |
| Module-wise count rates for Quadrant C Data is divided into 100 sec bins |
 |
 |
| Module-wise count rates for Quadrant D Data is divided into 100 sec bins |
 |
 |
| Parameter | Plot |
|---|---|
| CZT HV Monitor | 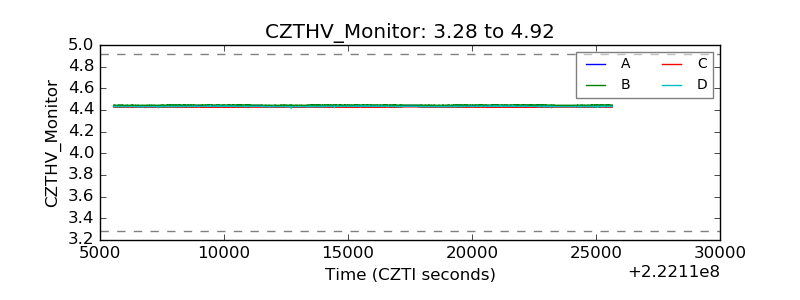 |
| D_VDD | 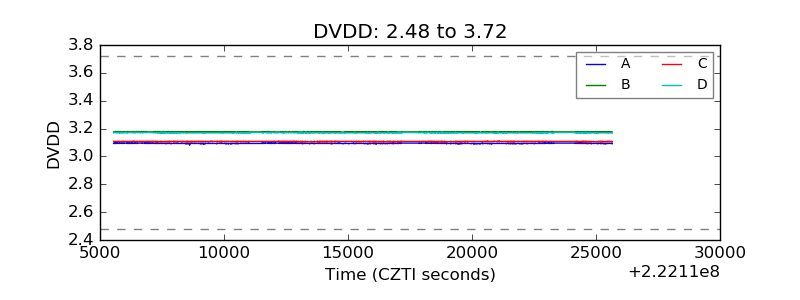 |
| Temperature 1 | 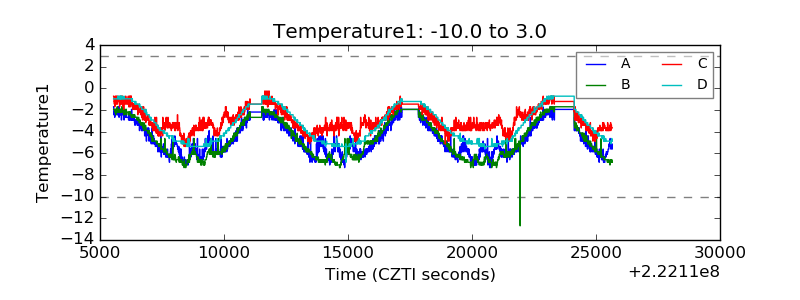 |
| Veto HV Monitor | 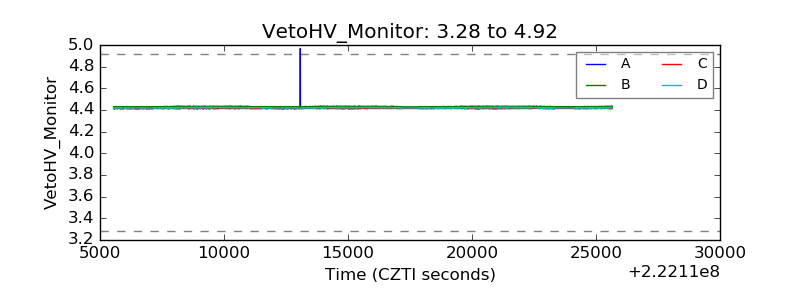 |
| Veto LLD | 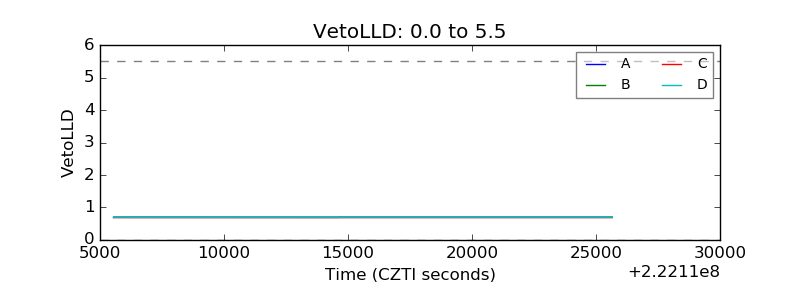 |
| Alpha Counter | 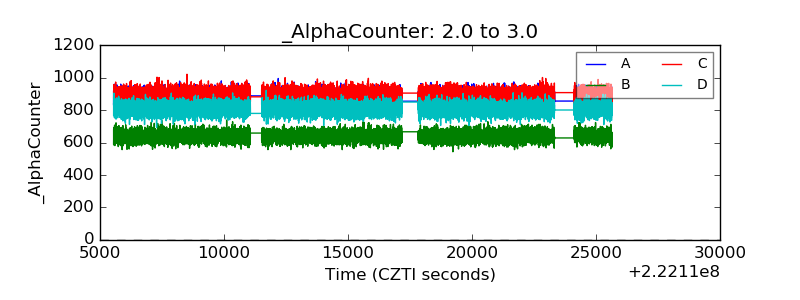 |
| _CPM_Rate | 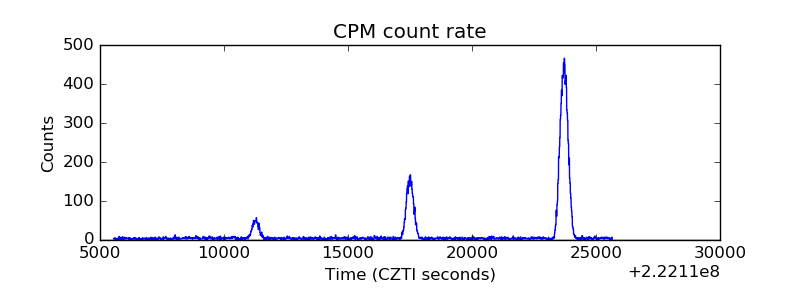 |
| CZT Counter | 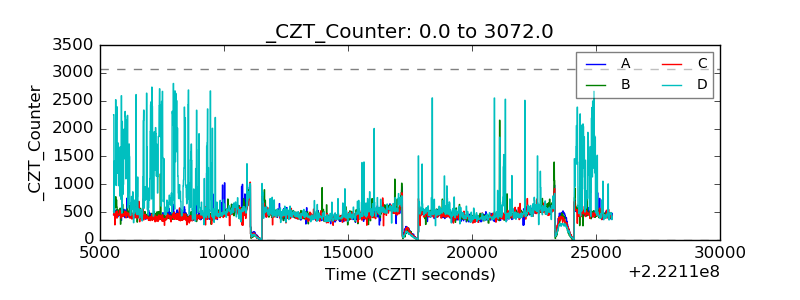 |
| +2.5 Volts monitor | 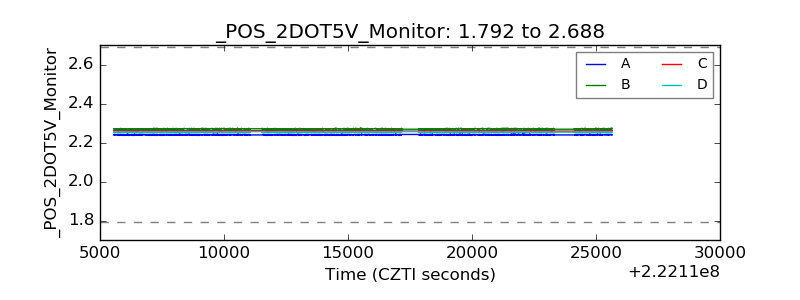 |
| +5 Volts monitor | 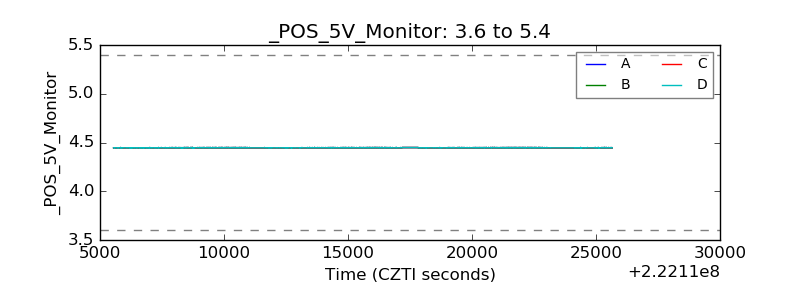 |
| _ROLL_ROT | 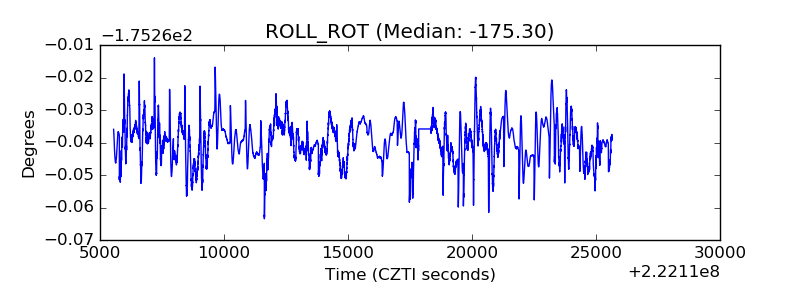 |
| _Roll_DEC | 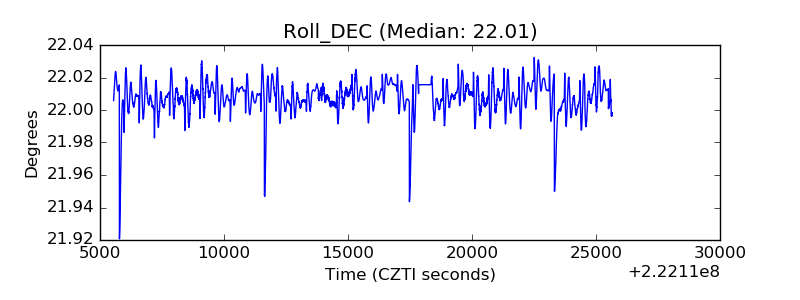 |
| _Roll_RA | 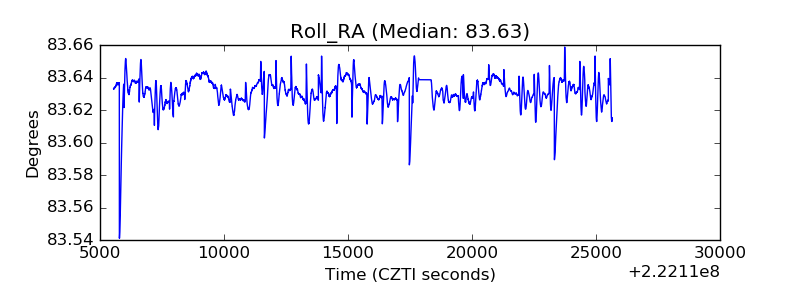 |
| Veto Counter | 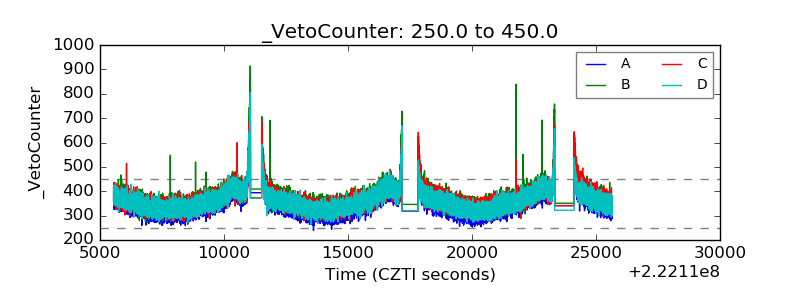 |