| Param | Original file | Final file |
|---|---|---|
| Filename | modeM0/AS1G06_029T01_9000000964_07029cztM0_level2.evt | modeM0/AS1G06_029T01_9000000964_07029cztM0_level2_quad_clean.evt |
| Size (bytes) | 449,760,960 | 85,127,040 |
| Size | 428.9 MB | 81.2 MB |
| Events in quadrant A | 2,978,543 | 541,863 |
| Events in quadrant B | 3,106,043 | 547,144 |
| Events in quadrant C | 2,921,706 | 539,217 |
| Events in quadrant D | 4,177,918 | 501,147 |
| Mode M0 | |||
|---|---|---|---|
| Quadrant | BADHDUFLAG | Total packets | Discarded packets |
| A | 0 | 13140 | 2 |
| B | 0 | 13552 | 1 |
| C | 0 | 13020 | 1 |
| D | 0 | 16919 | 1 |
| Mode M9 | |||
|---|---|---|---|
| Quadrant | BADHDUFLAG | Total packets | Discarded packets |
| A | 0 | 10 | 0 |
| B | 0 | 10 | 0 |
| C | 0 | 10 | 0 |
| D | 0 | 10 | 0 |
| Mode SS | |||
|---|---|---|---|
| Quadrant | BADHDUFLAG | Total packets | Discarded packets |
| A | 0 | 130 | 0 |
| B | 0 | 130 | 0 |
| C | 0 | 130 | 0 |
| D | 0 | 130 | 0 |
| Quadrant | Total seconds | Saturated seconds | Saturation percentage |
|---|---|---|---|
| A | 6429 | 15 | 0.233318% |
| B | 6429 | 29 | 0.451081% |
| C | 6429 | 10 | 0.155545% |
| D | 6429 | 251 | 3.904184% |
Noise dominated data is calculated using 1-second bins in cleaned event files. If a bin has >2000 counts, and if more than 50% of those come from <1% of pixels, then it is considered to be noise-dominated and hence unusable.
| Quadrant | # 1 sec bins | Bins with >0 counts | Bins with >2000 counts | High rate bins dominated by noise | Noise dominated (total time) | Noise dominated (detector-on time) | Marked lightcurve |
|---|---|---|---|---|---|---|---|
| A | 7384 | 6430 | 0 | 0 | 0.00% | 0.00% | 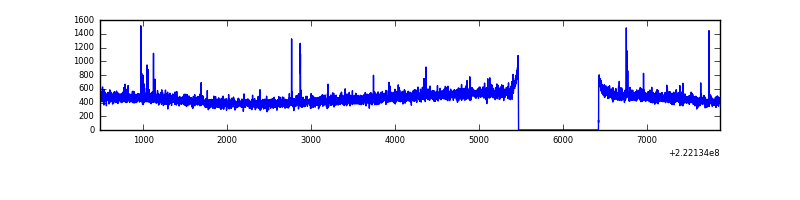 |
| B | 7384 | 6430 | 1 | 1 | 0.01% | 0.02% | 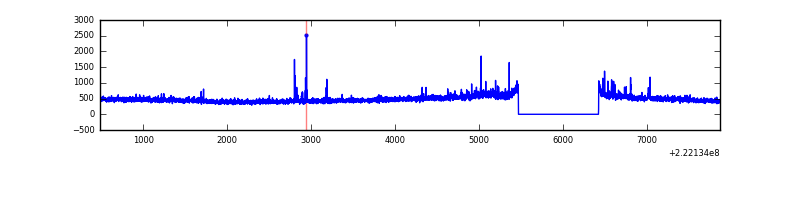 |
| C | 7384 | 6430 | 0 | 0 | 0.00% | 0.00% | 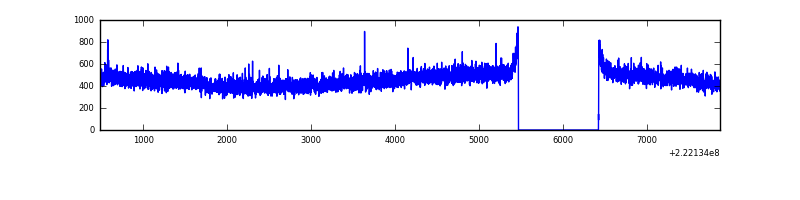 |
| D | 7384 | 6430 | 222 | 222 | 3.01% | 3.45% | 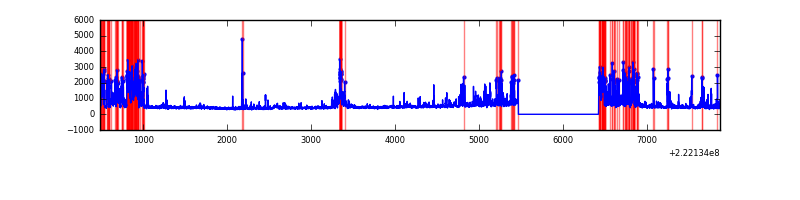 |
Top three noisy pixels from each quadrant. If the there are fewer than three noisy pixels in the level2.evt file, extra rows are filled as -1
| Pixel properties | Quadrant properties | ||||||
|---|---|---|---|---|---|---|---|
| Quadrant | DetID | PixID | Counts | Sigma | Mean | Median | Sigma |
| A | 8 | 15 | 37551 | 234.27 | 761 | 747 | 157.1 |
| A | 0 | 226 | 7165 | 40.85 | 761 | 747 | 157.1 |
| A | 13 | 14 | 7026 | 39.97 | 761 | 747 | 157.1 |
| B | 0 | 214 | 56030 | 372.29 | 769 | 751 | 148.5 |
| B | 0 | 219 | 35885 | 236.62 | 769 | 751 | 148.5 |
| B | 4 | 81 | 15109 | 96.7 | 769 | 751 | 148.5 |
| C | 1 | 16 | 7928 | 41.2 | 745 | 752 | 174.2 |
| C | 13 | 61 | 5740 | 28.64 | 745 | 752 | 174.2 |
| C | 10 | 22 | 3967 | 18.46 | 745 | 752 | 174.2 |
| D | 2 | 216 | 540790 | 2967.19 | 731 | 709 | 182.0 |
| D | 12 | 233 | 523974 | 2874.81 | 731 | 709 | 182.0 |
| D | 14 | 34 | 178681 | 977.77 | 731 | 709 | 182.0 |
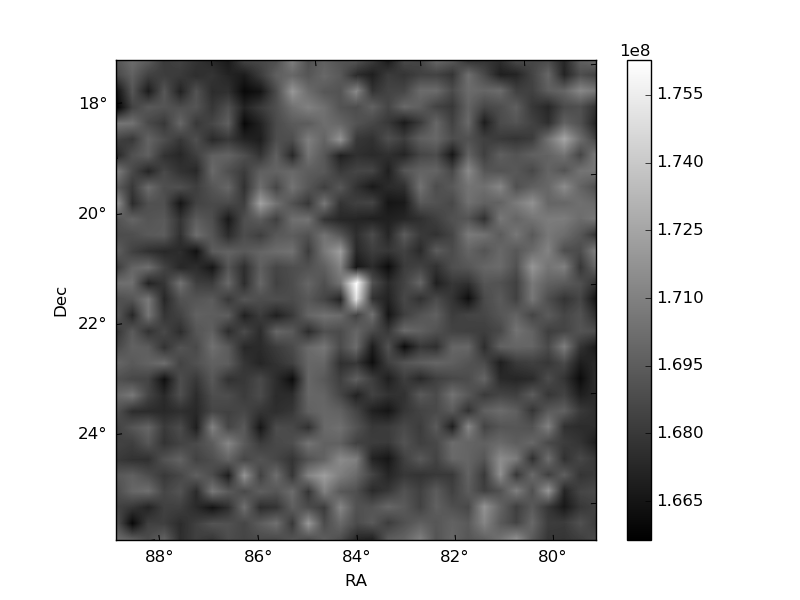
Histogram calculated using DETX and DETY for each event in the final _common_clean file
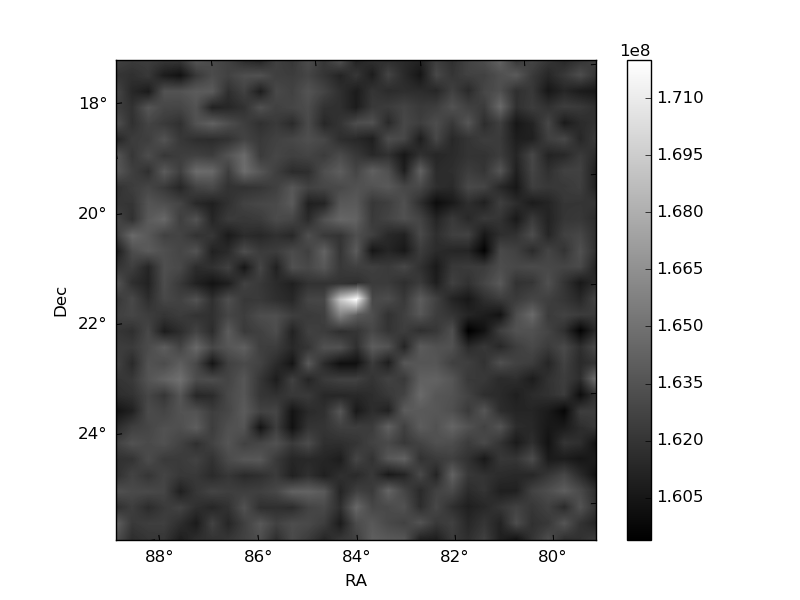
| Quadrant A | 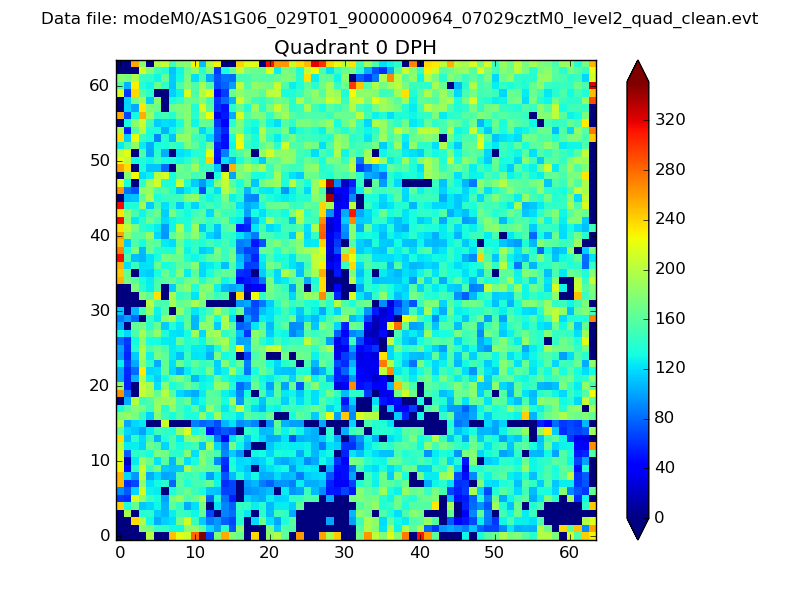 |
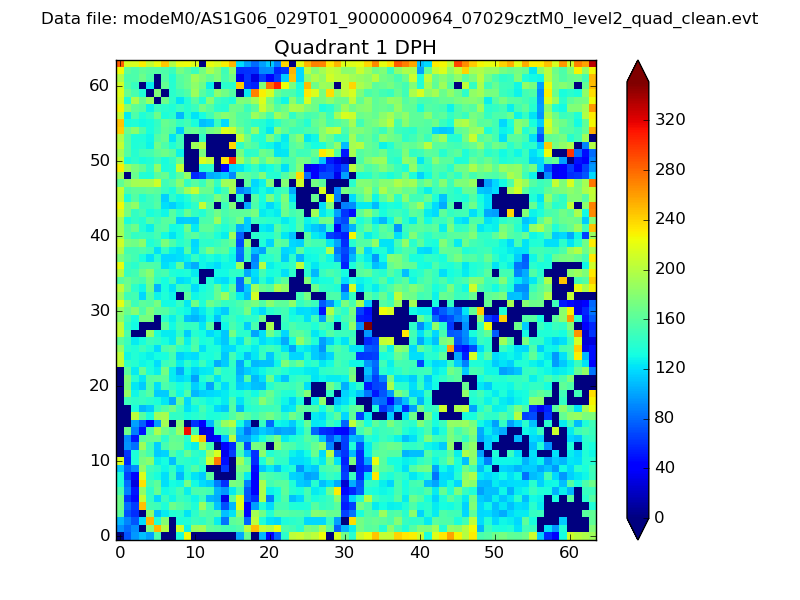 |
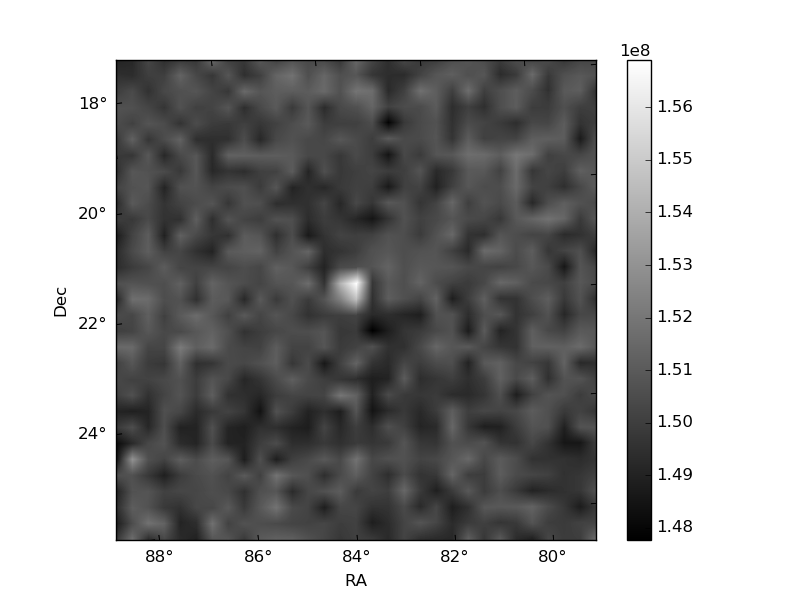
Quadrant B |
|---|---|---|---|
| Quadrant D | 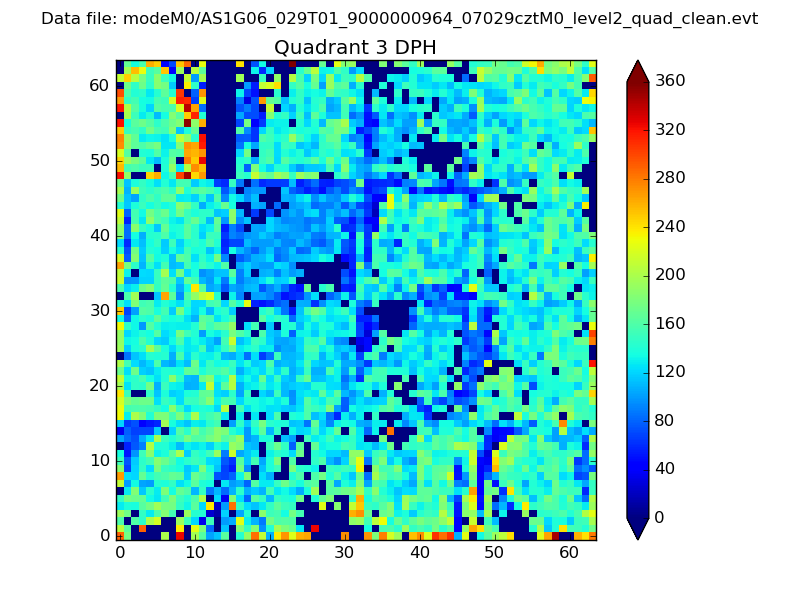 |
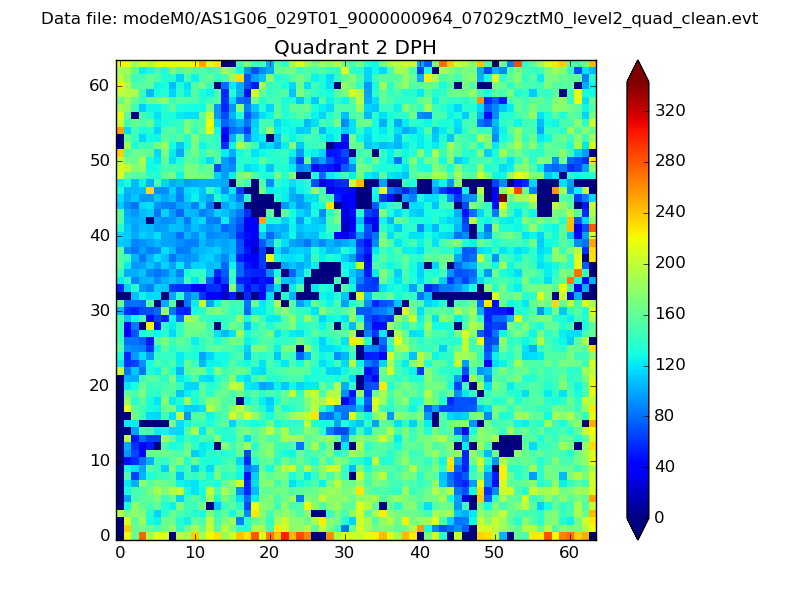 |
Quadrant C |
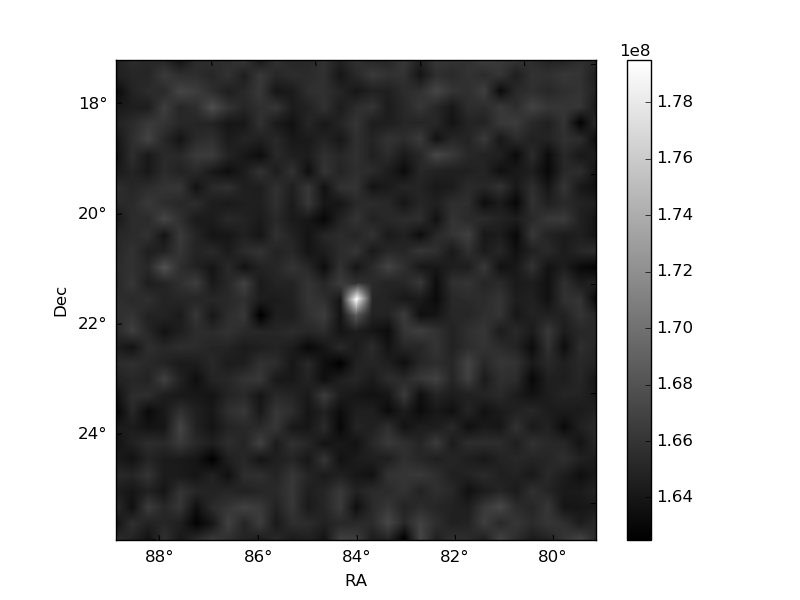
| Plot type | Count rate plots | Images |
|---|---|---|
| Comparison with Poisson distribution Blue bars denote a histogram of data divided into 1 sec bins. Red curve is a Poisson curve with rate = median count rate of data. |
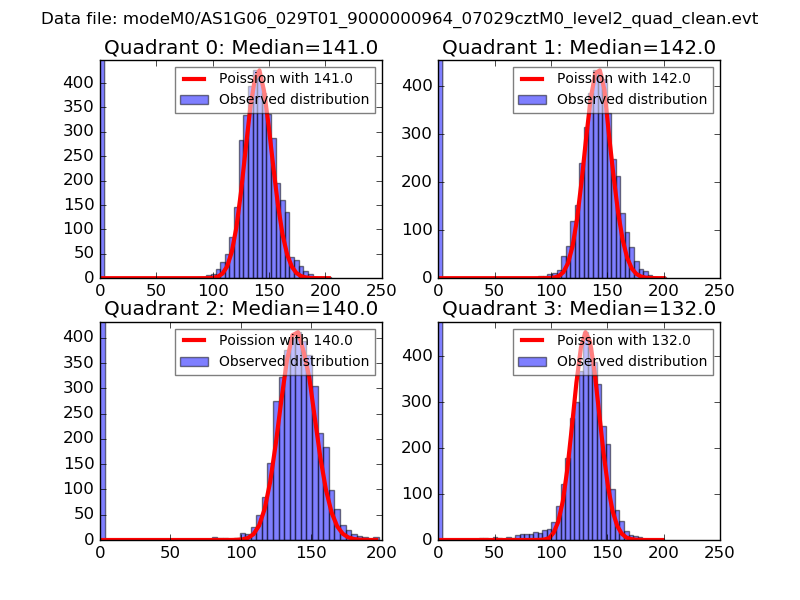 |
 |
| Quadrant-wise count rates Data is divided into 100 sec bins |
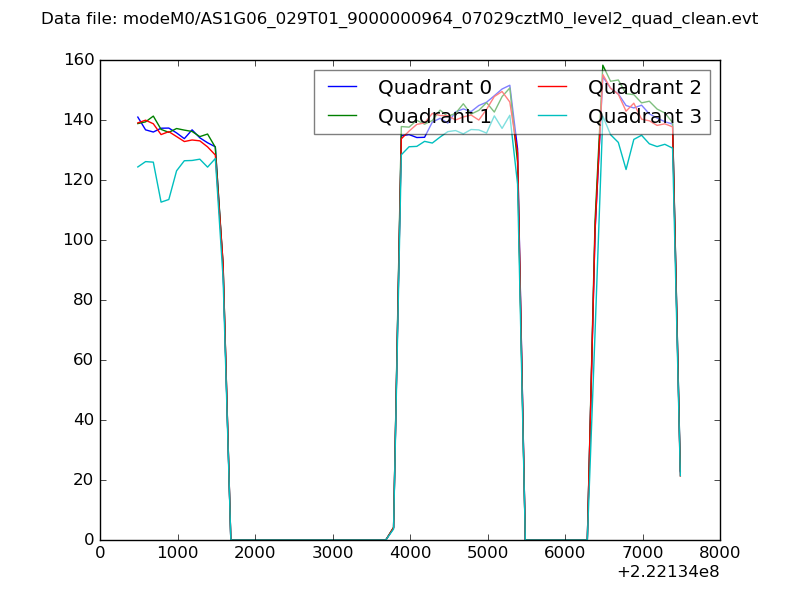 |
|
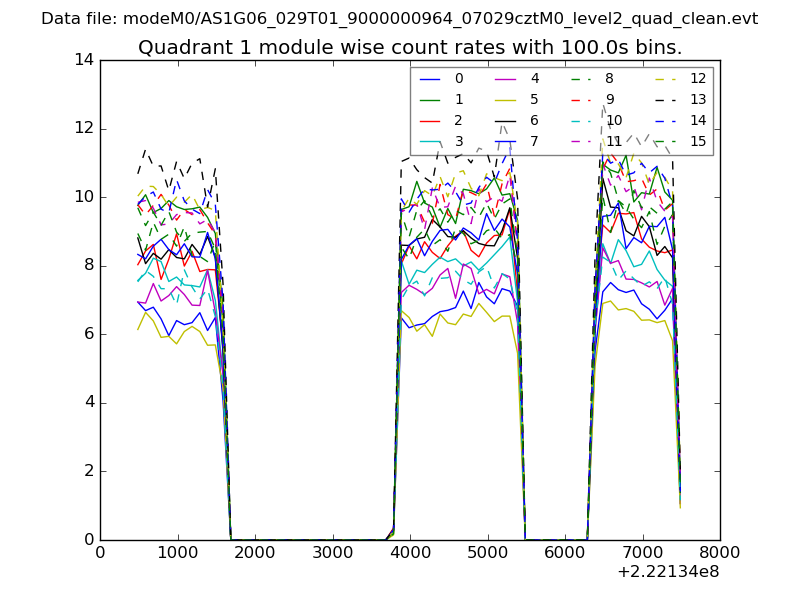
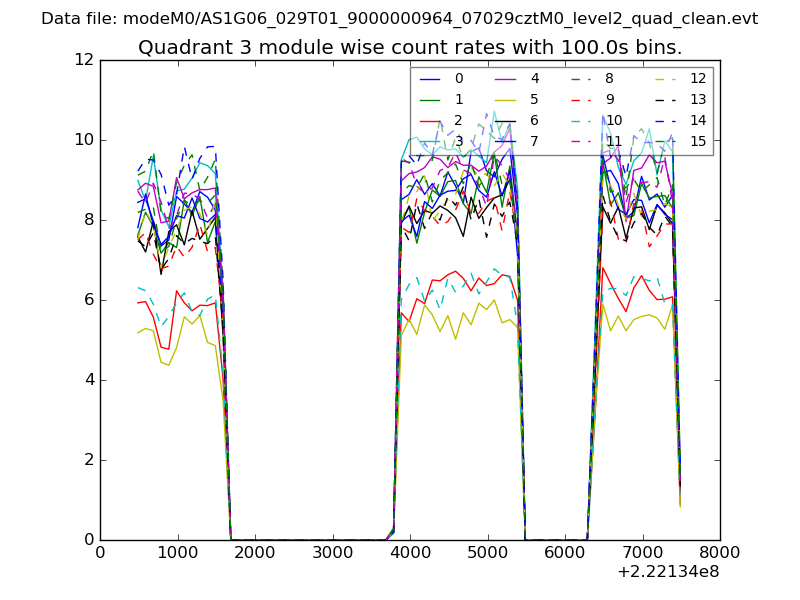
| Module-wise count rates for Quadrant A Data is divided into 100 sec bins |
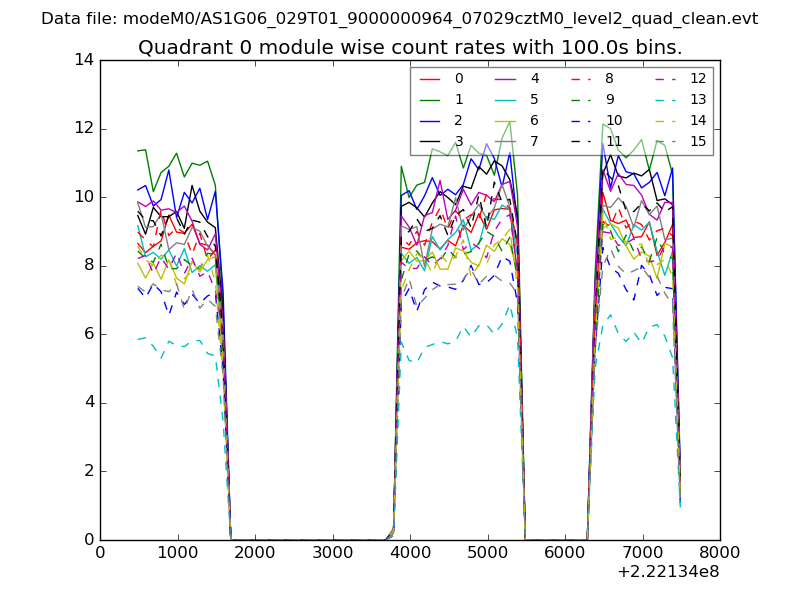 |
 |
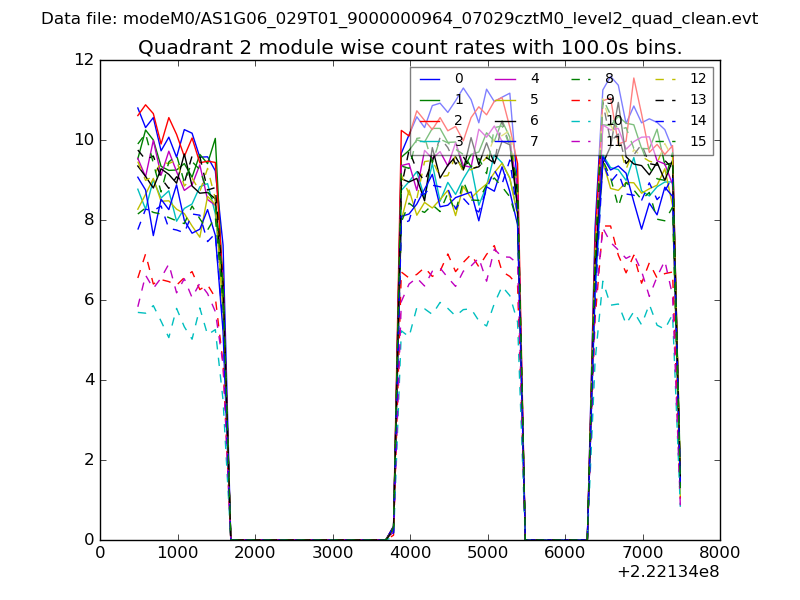
| Module-wise count rates for Quadrant B Data is divided into 100 sec bins |
 |
 |
| Module-wise count rates for Quadrant C Data is divided into 100 sec bins |
 |
 |
| Module-wise count rates for Quadrant D Data is divided into 100 sec bins |
 |
 |
| Parameter | Plot |
|---|---|
| CZT HV Monitor | 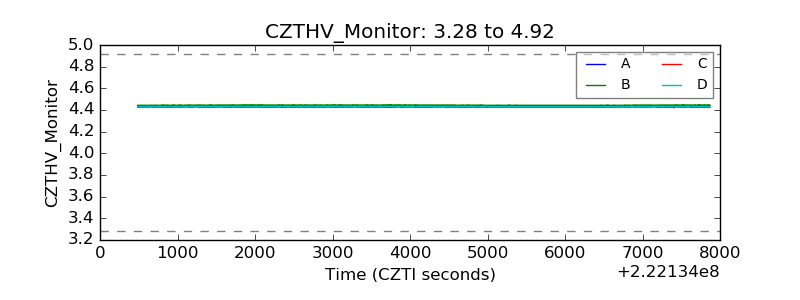 |
| D_VDD | 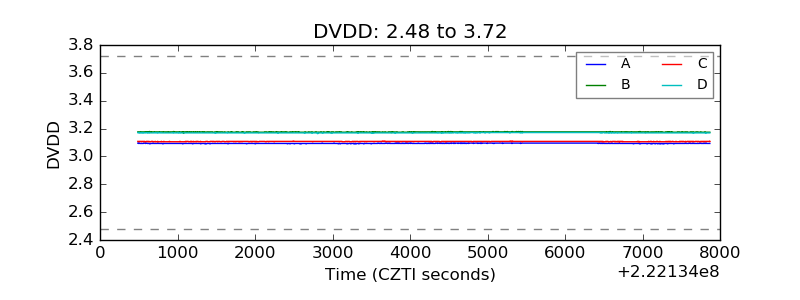 |
| Temperature 1 | 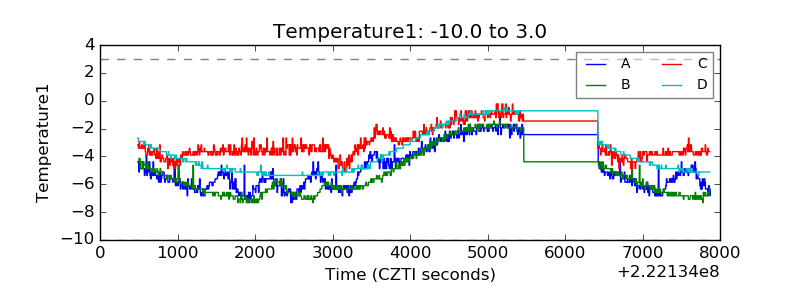 |
| Veto HV Monitor | 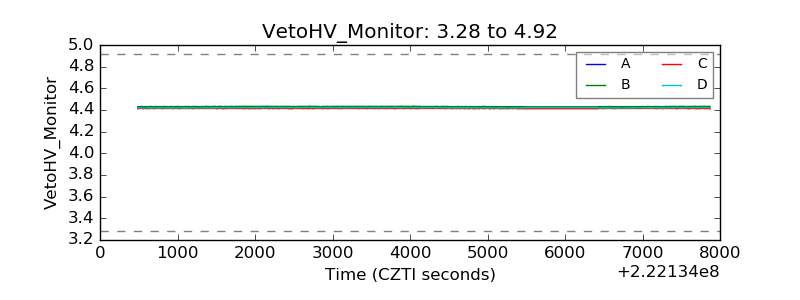 |
| Veto LLD | 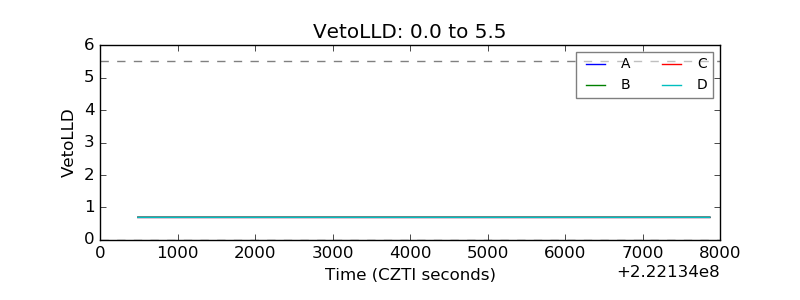 |
| Alpha Counter | 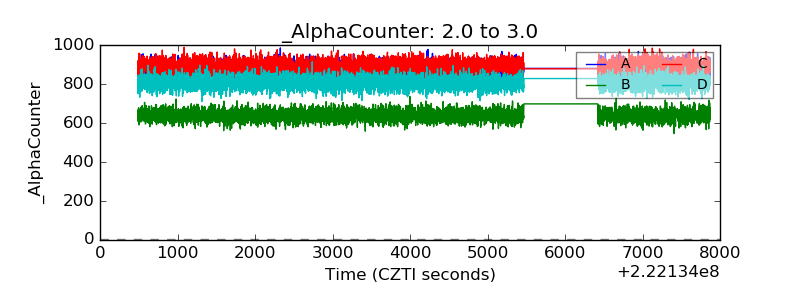 |
| _CPM_Rate | 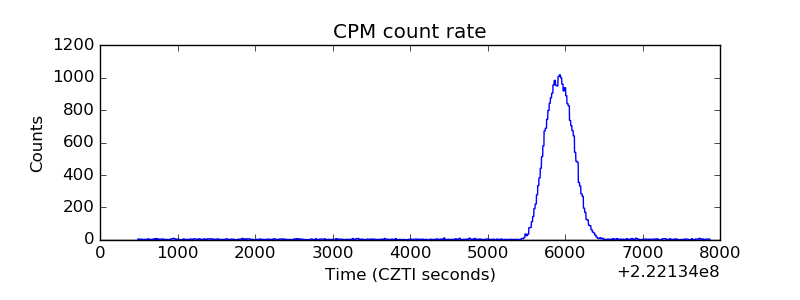 |
| CZT Counter | 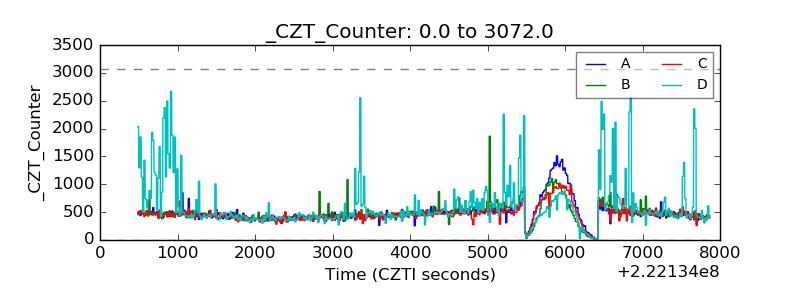 |
| +2.5 Volts monitor | 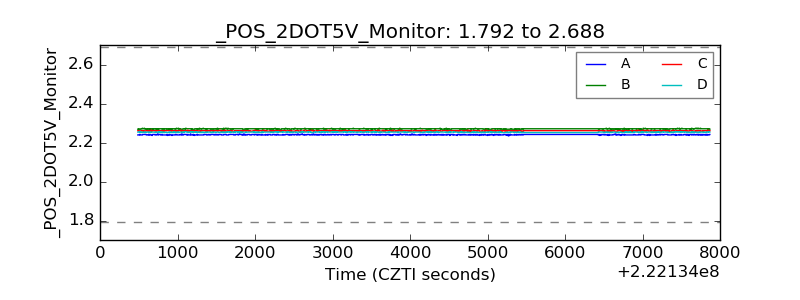 |
| +5 Volts monitor | 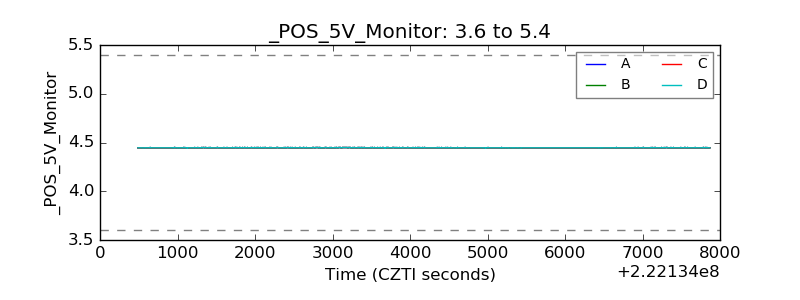 |
| _ROLL_ROT | 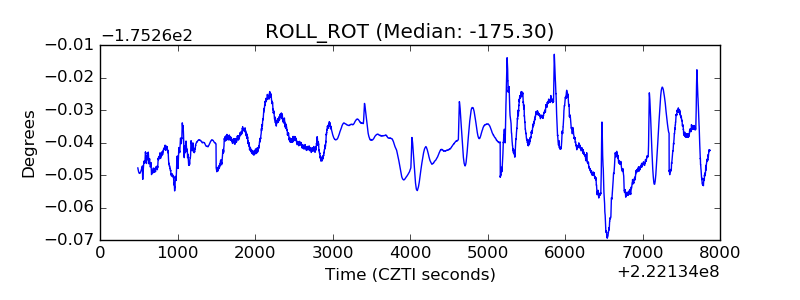 |
| _Roll_DEC | 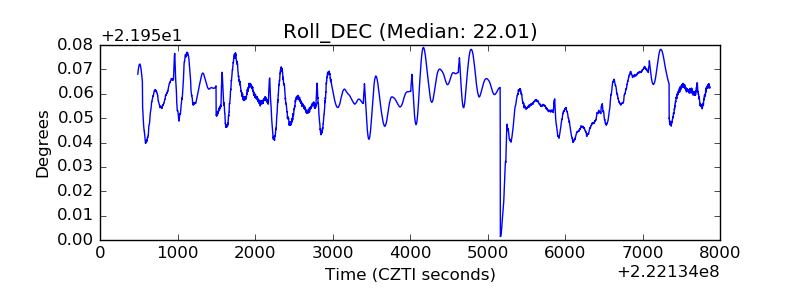 |
| _Roll_RA | 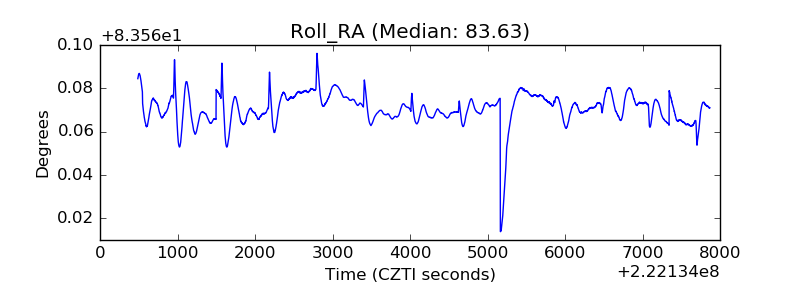 |
| Veto Counter | 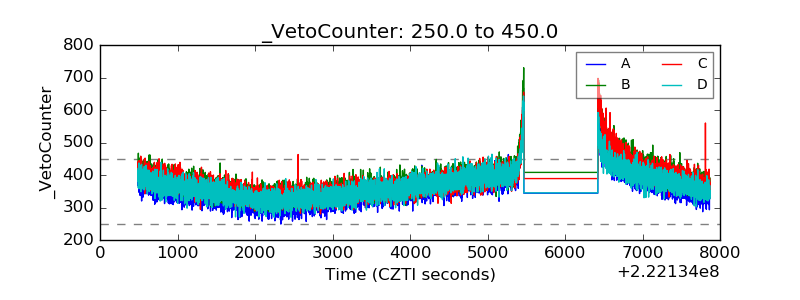 |