| Param | Original file | Final file |
|---|---|---|
| Filename | modeM0/AS1G06_029T01_9000000964_07031cztM0_level2.evt | modeM0/AS1G06_029T01_9000000964_07031cztM0_level2_quad_clean.evt |
| Size (bytes) | 442,825,920 | 81,889,920 |
| Size | 422.3 MB | 78.1 MB |
| Events in quadrant A | 3,071,099 | 513,133 |
| Events in quadrant B | 3,220,571 | 520,032 |
| Events in quadrant C | 3,021,000 | 509,386 |
| Events in quadrant D | 3,653,634 | 480,983 |
| Mode M0 | |||
|---|---|---|---|
| Quadrant | BADHDUFLAG | Total packets | Discarded packets |
| A | 0 | 13362 | 2 |
| B | 0 | 13829 | 1 |
| C | 0 | 13300 | 1 |
| D | 0 | 15464 | 1 |
| Mode M9 | |||
|---|---|---|---|
| Quadrant | BADHDUFLAG | Total packets | Discarded packets |
| A | 0 | 11 | 0 |
| B | 0 | 11 | 0 |
| C | 0 | 11 | 0 |
| D | 0 | 11 | 0 |
| Mode SS | |||
|---|---|---|---|
| Quadrant | BADHDUFLAG | Total packets | Discarded packets |
| A | 0 | 132 | 0 |
| B | 0 | 132 | 0 |
| C | 0 | 132 | 0 |
| D | 0 | 132 | 0 |
| Quadrant | Total seconds | Saturated seconds | Saturation percentage |
|---|---|---|---|
| A | 6545 | 26 | 0.397250% |
| B | 6545 | 35 | 0.534759% |
| C | 6545 | 18 | 0.275019% |
| D | 6545 | 113 | 1.726509% |
Noise dominated data is calculated using 1-second bins in cleaned event files. If a bin has >2000 counts, and if more than 50% of those come from <1% of pixels, then it is considered to be noise-dominated and hence unusable.
| Quadrant | # 1 sec bins | Bins with >0 counts | Bins with >2000 counts | High rate bins dominated by noise | Noise dominated (total time) | Noise dominated (detector-on time) | Marked lightcurve |
|---|---|---|---|---|---|---|---|
| A | 7660 | 6546 | 0 | 0 | 0.00% | 0.00% | 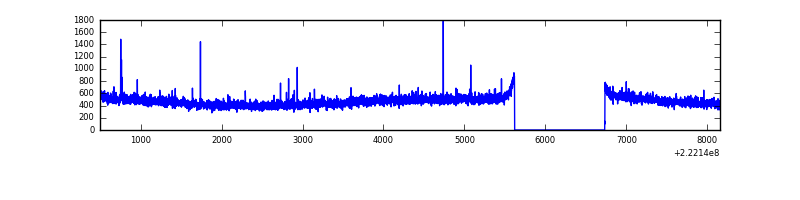 |
| B | 7660 | 6546 | 0 | 0 | 0.00% | 0.00% | 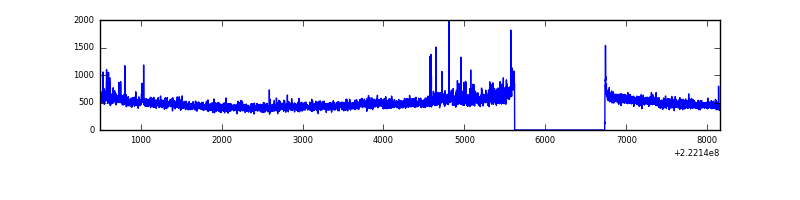 |
| C | 7660 | 6546 | 0 | 0 | 0.00% | 0.00% | 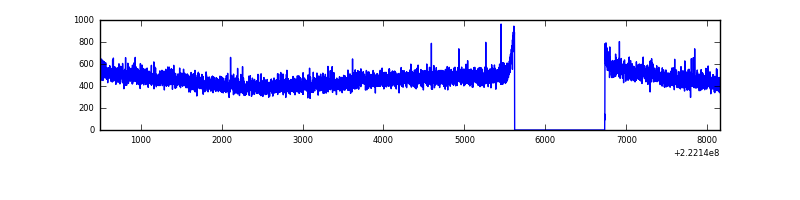 |
| D | 7660 | 6546 | 71 | 71 | 0.93% | 1.08% | 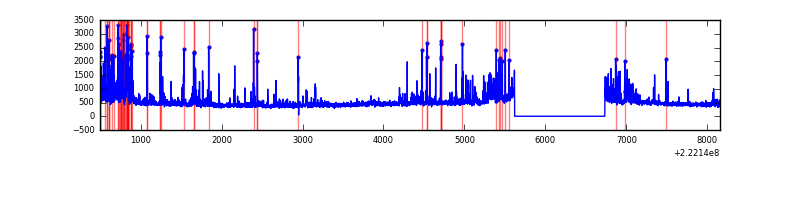 |
Top three noisy pixels from each quadrant. If the there are fewer than three noisy pixels in the level2.evt file, extra rows are filled as -1
| Pixel properties | Quadrant properties | ||||||
|---|---|---|---|---|---|---|---|
| Quadrant | DetID | PixID | Counts | Sigma | Mean | Median | Sigma |
| A | 8 | 15 | 22070 | 131.11 | 788 | 773 | 162.4 |
| A | 13 | 14 | 10939 | 62.59 | 788 | 773 | 162.4 |
| A | 0 | 226 | 7470 | 41.23 | 788 | 773 | 162.4 |
| B | 0 | 214 | 80643 | 522.55 | 796 | 779 | 152.8 |
| B | 4 | 81 | 21512 | 135.66 | 796 | 779 | 152.8 |
| B | 12 | 111 | 14770 | 91.54 | 796 | 779 | 152.8 |
| C | 1 | 16 | 9334 | 47.87 | 769 | 776 | 178.8 |
| C | 14 | 67 | 8513 | 43.28 | 769 | 776 | 178.8 |
| C | 13 | 61 | 5944 | 28.91 | 769 | 776 | 178.8 |
| D | 2 | 216 | 501348 | 2687.99 | 758 | 736 | 186.2 |
| D | 12 | 233 | 142382 | 760.55 | 758 | 736 | 186.2 |
| D | 8 | 195 | 66937 | 355.46 | 758 | 736 | 186.2 |
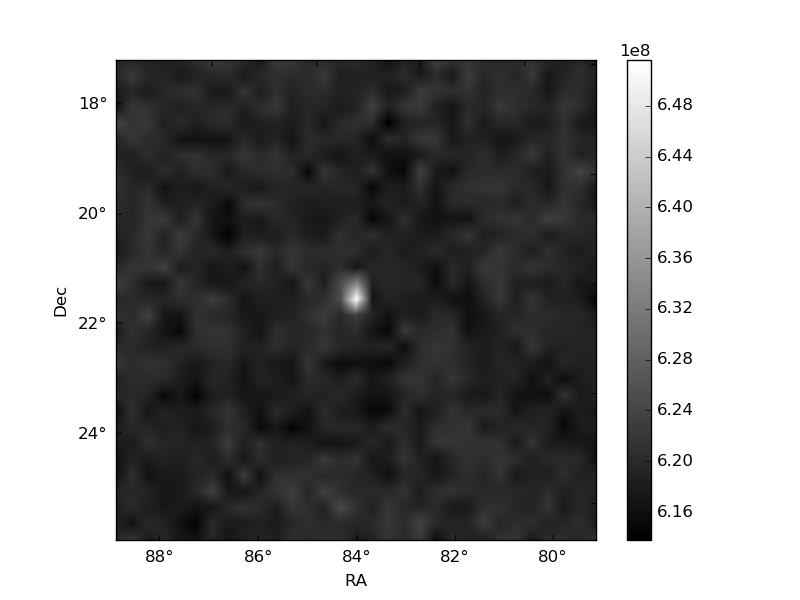
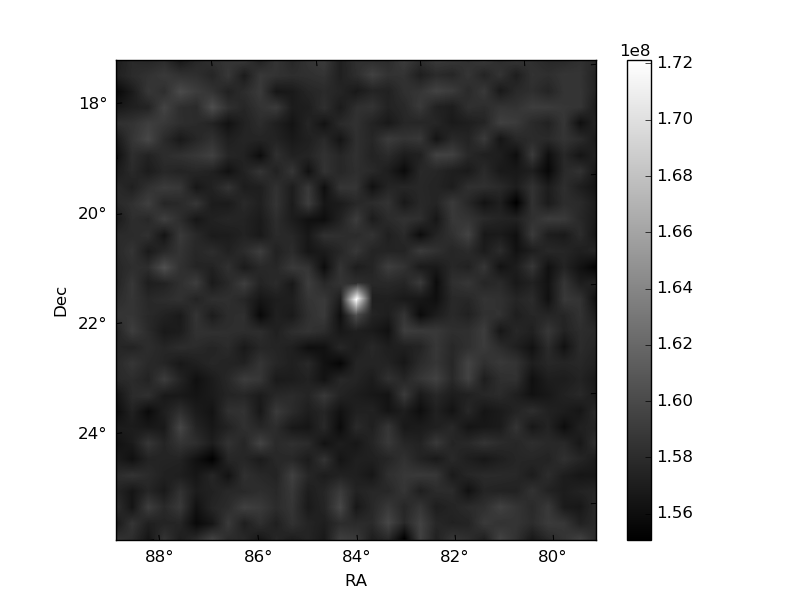
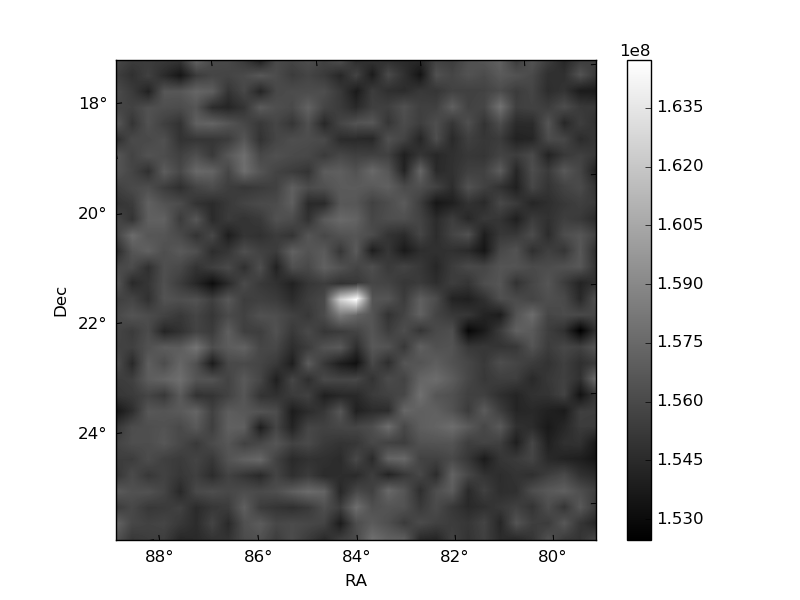
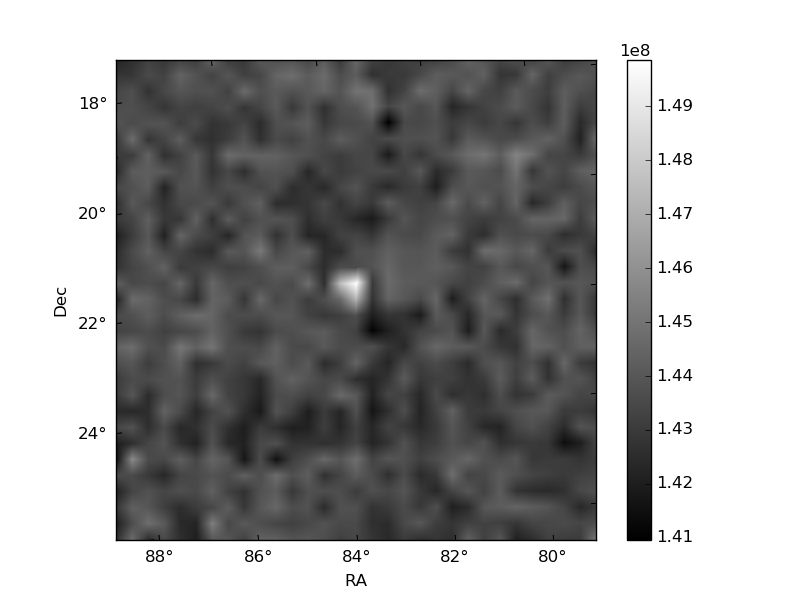
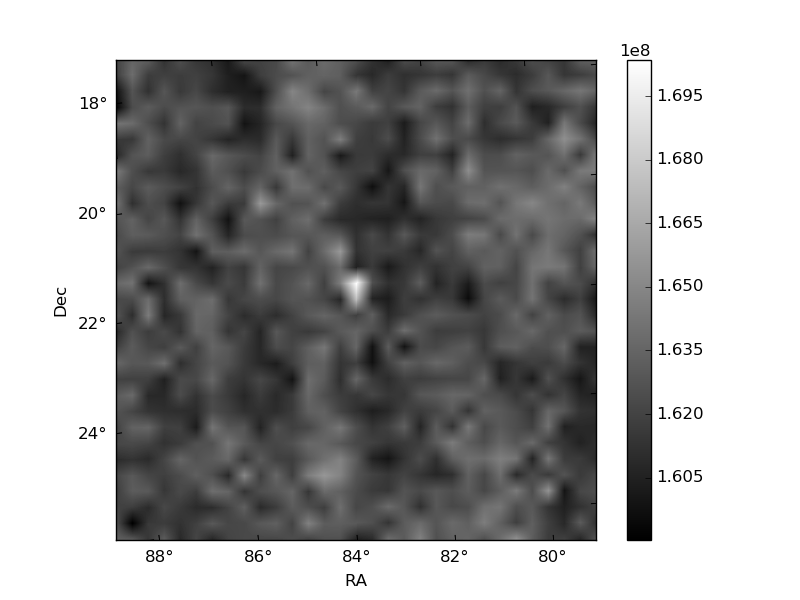
Histogram calculated using DETX and DETY for each event in the final _common_clean file
| Quadrant A | 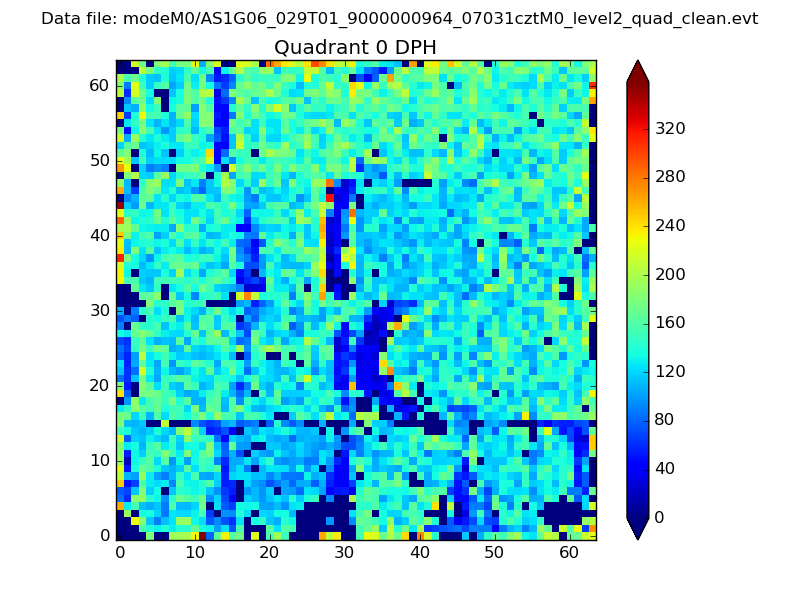 |
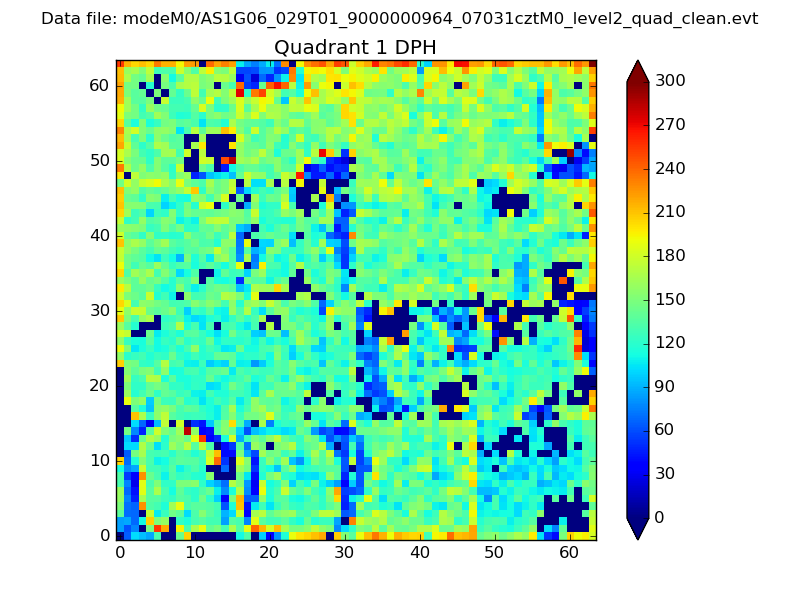 |
Quadrant B |
|---|---|---|---|
| Quadrant D | 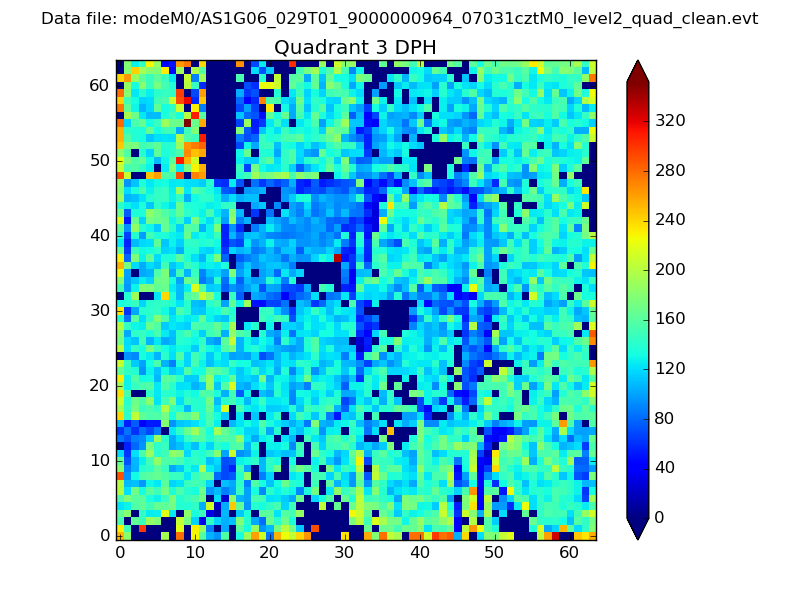 |
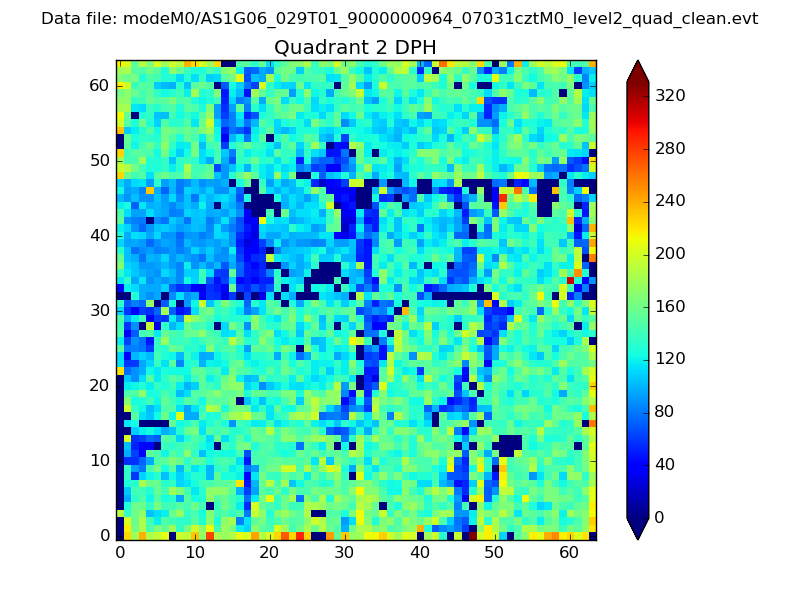 |
Quadrant C |
| Plot type | Count rate plots | Images |
|---|---|---|
| Comparison with Poisson distribution Blue bars denote a histogram of data divided into 1 sec bins. Red curve is a Poisson curve with rate = median count rate of data. |
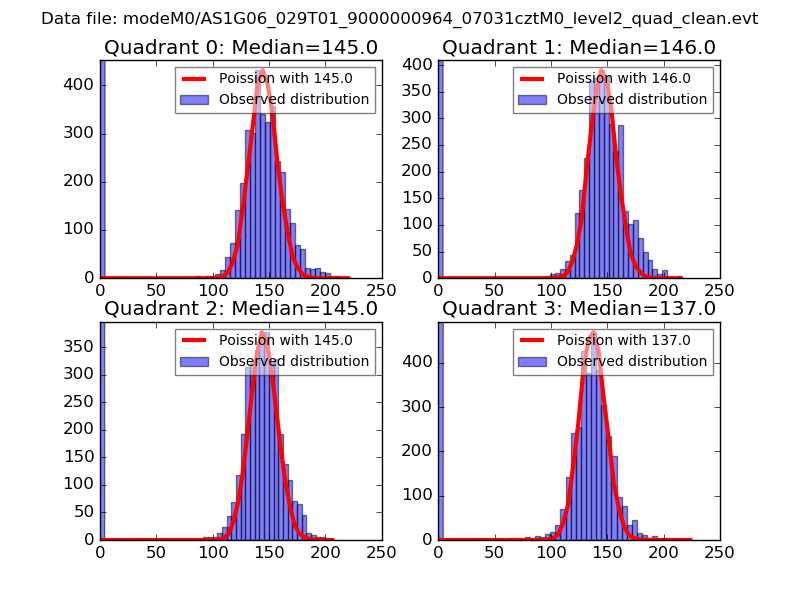 |
 |
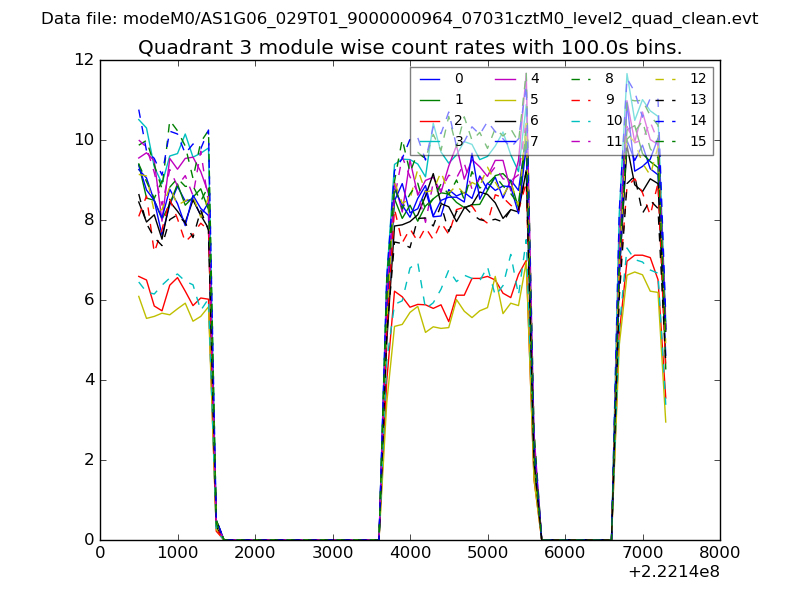
| Quadrant-wise count rates Data is divided into 100 sec bins |
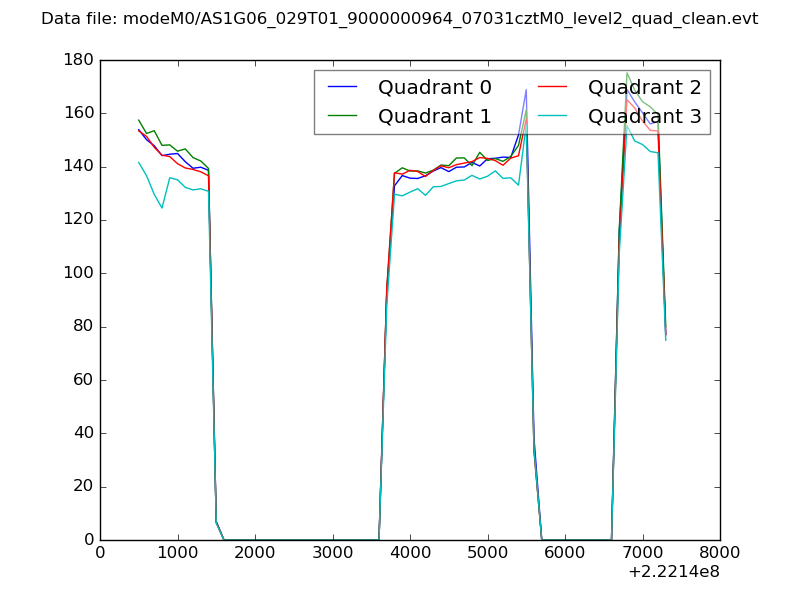 |
|
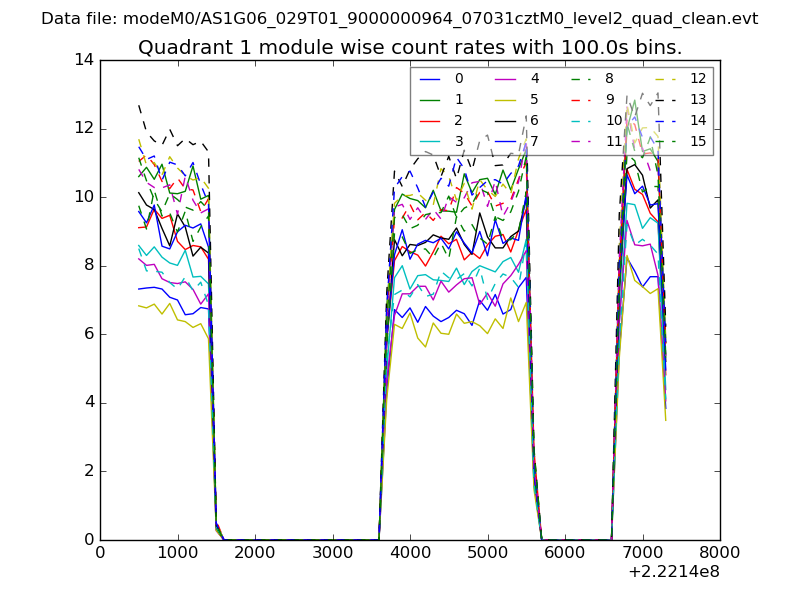
| Module-wise count rates for Quadrant A Data is divided into 100 sec bins |
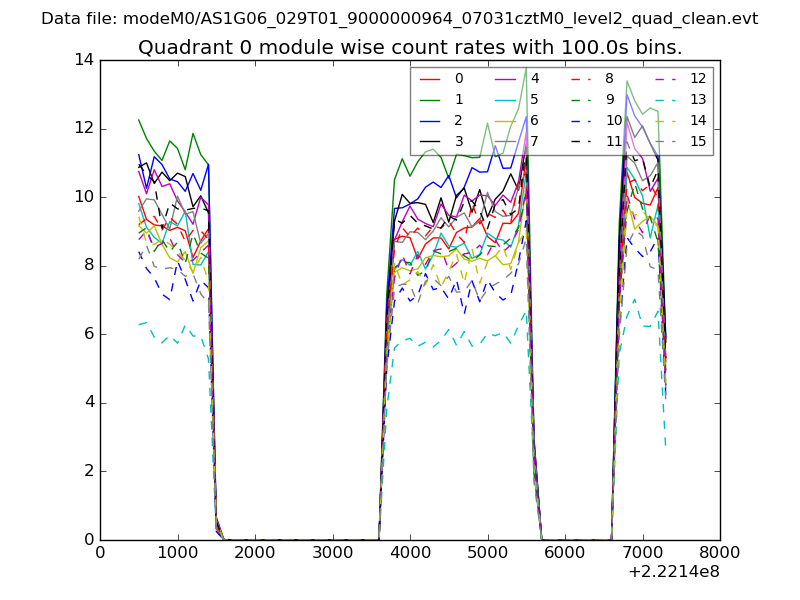 |
 |
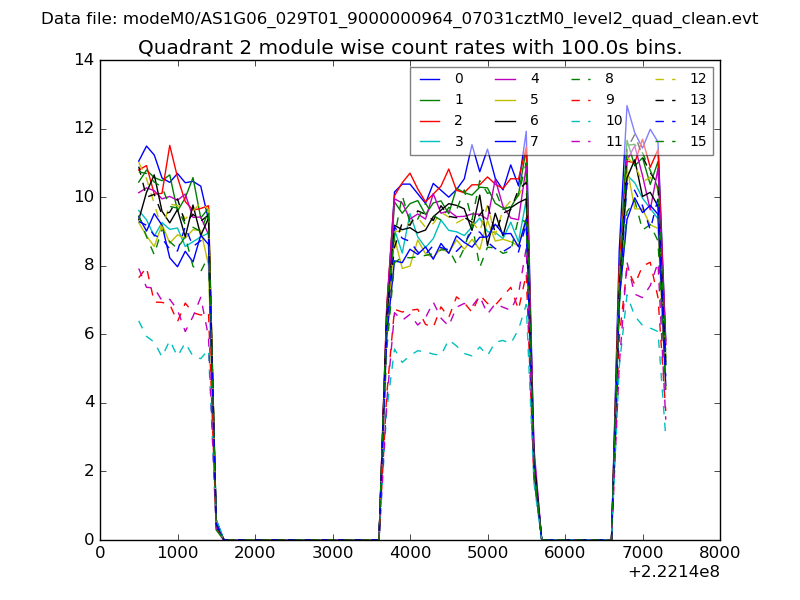
| Module-wise count rates for Quadrant B Data is divided into 100 sec bins |
 |
 |
| Module-wise count rates for Quadrant C Data is divided into 100 sec bins |
 |
 |
| Module-wise count rates for Quadrant D Data is divided into 100 sec bins |
 |
 |
| Parameter | Plot |
|---|---|
| CZT HV Monitor | 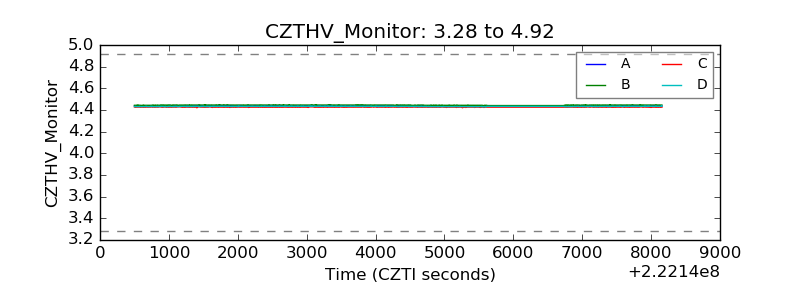 |
| D_VDD | 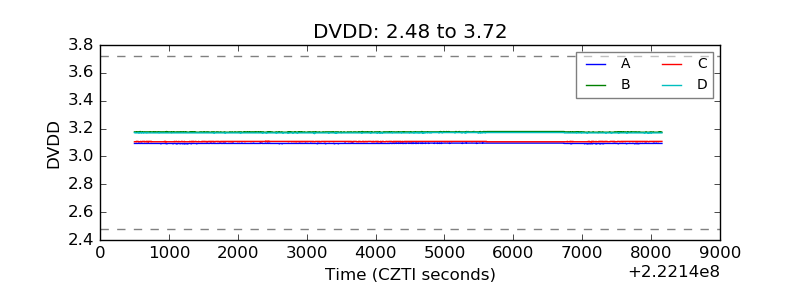 |
| Temperature 1 | 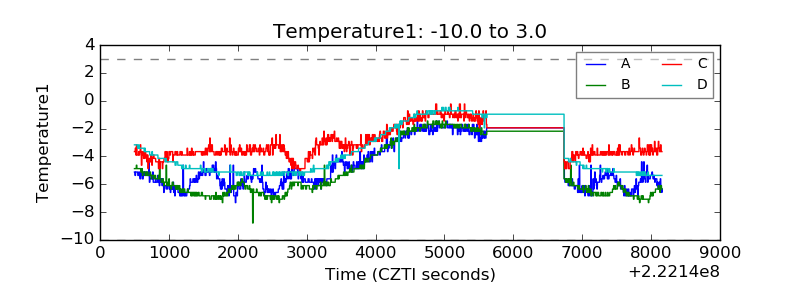 |
| Veto HV Monitor | 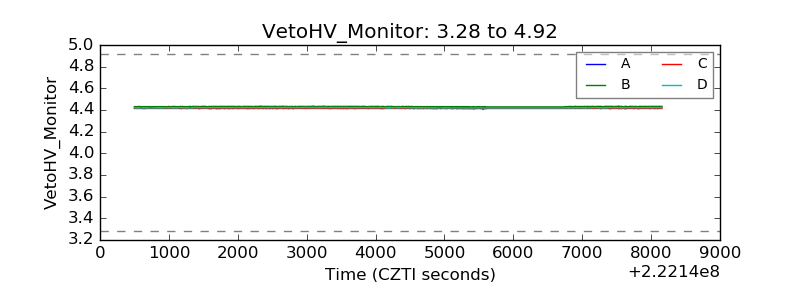 |
| Veto LLD | 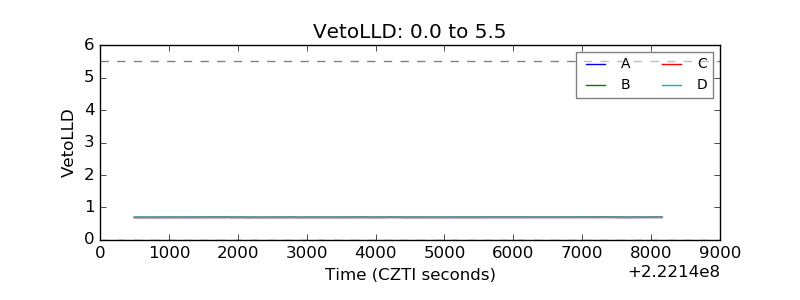 |
| Alpha Counter | 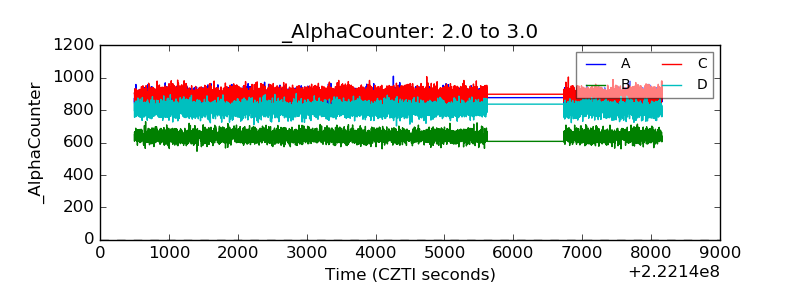 |
| _CPM_Rate | 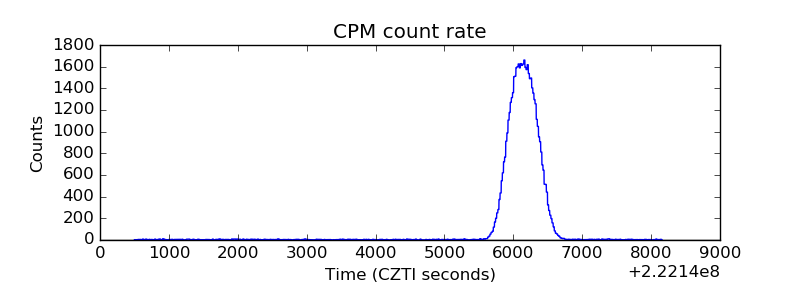 |
| CZT Counter | 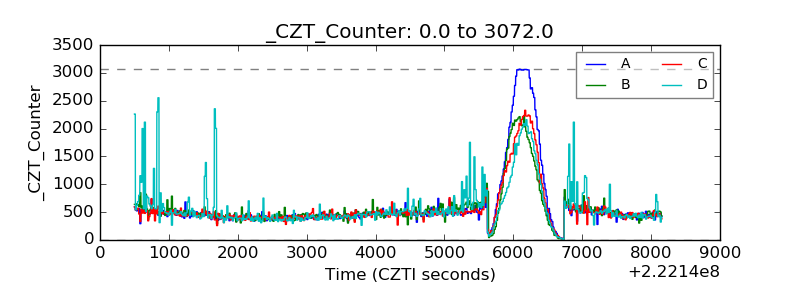 |
| +2.5 Volts monitor | 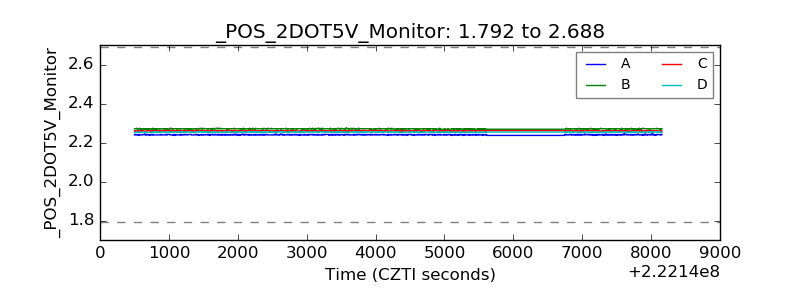 |
| +5 Volts monitor | 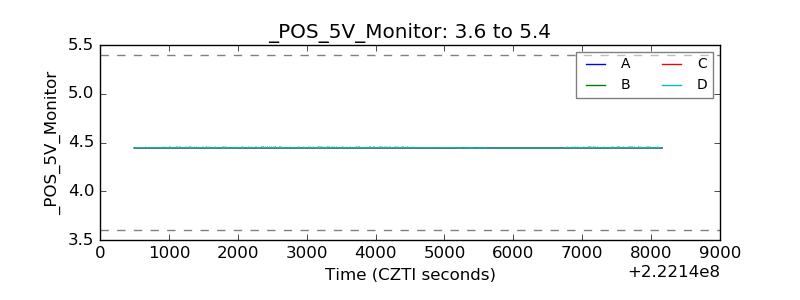 |
| _ROLL_ROT | 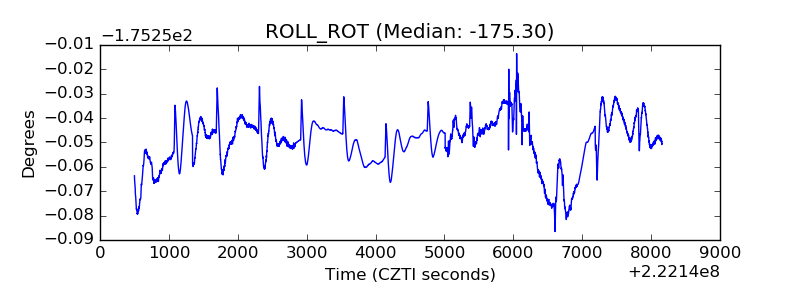 |
| _Roll_DEC | 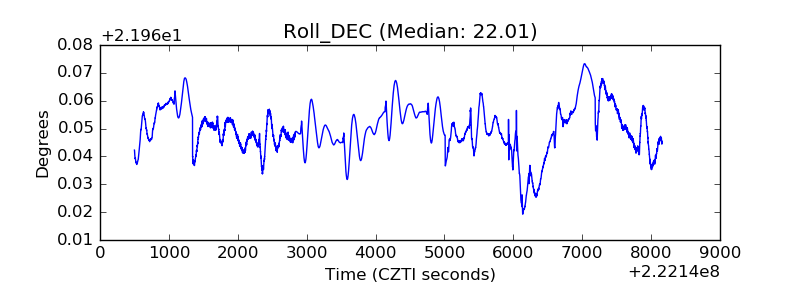 |
| _Roll_RA | 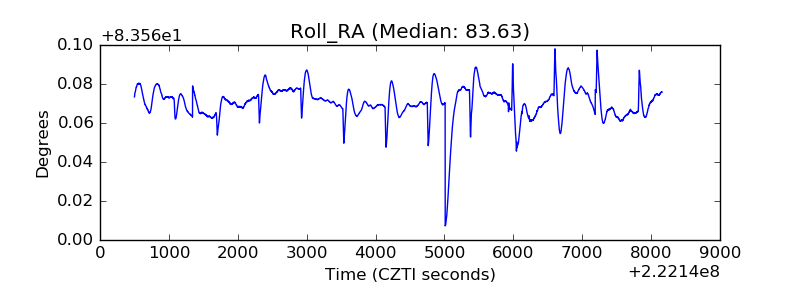 |
| Veto Counter | 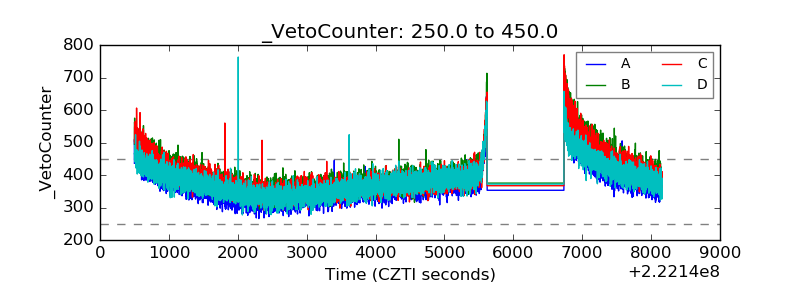 |