| Param | Original file | Final file |
|---|---|---|
| Filename | modeM0/AS1G06_029T01_9000000964_07032cztM0_level2.evt | modeM0/AS1G06_029T01_9000000964_07032cztM0_level2_quad_clean.evt |
| Size (bytes) | 441,060,480 | 73,687,680 |
| Size | 420.6 MB | 70.3 MB |
| Events in quadrant A | 3,113,692 | 450,093 |
| Events in quadrant B | 3,312,022 | 457,759 |
| Events in quadrant C | 3,065,670 | 447,832 |
| Events in quadrant D | 3,426,407 | 424,141 |
| Mode M0 | |||
|---|---|---|---|
| Quadrant | BADHDUFLAG | Total packets | Discarded packets |
| A | 0 | 13325 | 3 |
| B | 0 | 13893 | 2 |
| C | 0 | 13277 | 2 |
| D | 0 | 14410 | 2 |
| Mode M9 | |||
|---|---|---|---|
| Quadrant | BADHDUFLAG | Total packets | Discarded packets |
| A | 0 | 15 | 0 |
| B | 0 | 15 | 0 |
| C | 0 | 15 | 0 |
| D | 0 | 16 | 0 |
| Mode SS | |||
|---|---|---|---|
| Quadrant | BADHDUFLAG | Total packets | Discarded packets |
| A | 0 | 132 | 0 |
| B | 0 | 132 | 0 |
| C | 0 | 132 | 0 |
| D | 0 | 132 | 0 |
| Quadrant | Total seconds | Saturated seconds | Saturation percentage |
|---|---|---|---|
| A | 6468 | 12 | 0.185529% |
| B | 6468 | 22 | 0.340136% |
| C | 6468 | 16 | 0.247372% |
| D | 6468 | 33 | 0.510204% |
Noise dominated data is calculated using 1-second bins in cleaned event files. If a bin has >2000 counts, and if more than 50% of those come from <1% of pixels, then it is considered to be noise-dominated and hence unusable.
| Quadrant | # 1 sec bins | Bins with >0 counts | Bins with >2000 counts | High rate bins dominated by noise | Noise dominated (total time) | Noise dominated (detector-on time) | Marked lightcurve |
|---|---|---|---|---|---|---|---|
| A | 7703 | 6469 | 1 | 1 | 0.01% | 0.02% | 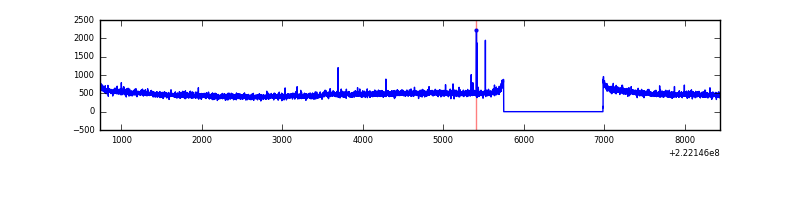 |
| B | 7703 | 6469 | 5 | 5 | 0.06% | 0.08% | 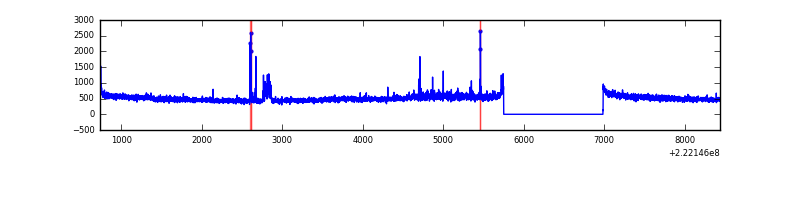 |
| C | 7703 | 6469 | 0 | 0 | 0.00% | 0.00% | 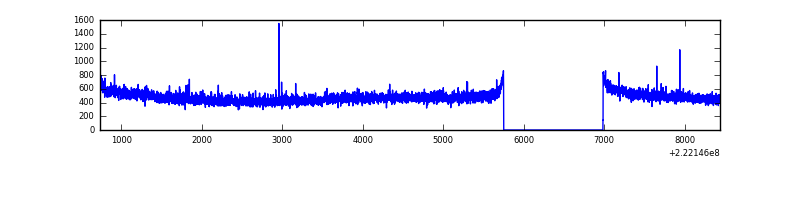 |
| D | 7703 | 6469 | 22 | 22 | 0.29% | 0.34% | 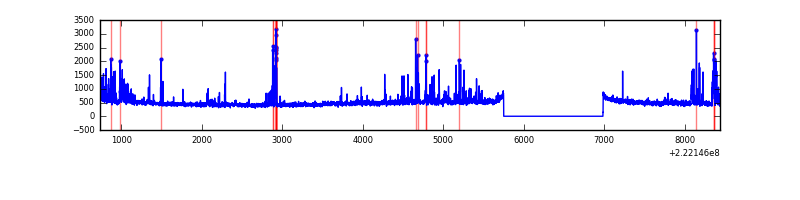 |
Top three noisy pixels from each quadrant. If the there are fewer than three noisy pixels in the level2.evt file, extra rows are filled as -1
| Pixel properties | Quadrant properties | ||||||
|---|---|---|---|---|---|---|---|
| Quadrant | DetID | PixID | Counts | Sigma | Mean | Median | Sigma |
| A | 15 | 234 | 14634 | 85.69 | 801 | 789 | 161.6 |
| A | 8 | 15 | 10693 | 61.3 | 801 | 789 | 161.6 |
| A | 13 | 14 | 7799 | 43.39 | 801 | 789 | 161.6 |
| B | 0 | 214 | 89544 | 573.62 | 813 | 796 | 154.7 |
| B | 0 | 219 | 61810 | 394.36 | 813 | 796 | 154.7 |
| B | 7 | 202 | 15200 | 93.1 | 813 | 796 | 154.7 |
| C | 1 | 16 | 8263 | 41.56 | 780 | 789 | 179.8 |
| C | 14 | 67 | 7532 | 37.5 | 780 | 789 | 179.8 |
| C | 13 | 61 | 6157 | 29.85 | 780 | 789 | 179.8 |
| D | 2 | 216 | 280610 | 1481.91 | 771 | 752 | 188.8 |
| D | 8 | 195 | 134971 | 710.72 | 771 | 752 | 188.8 |
| D | 12 | 233 | 67150 | 351.59 | 771 | 752 | 188.8 |
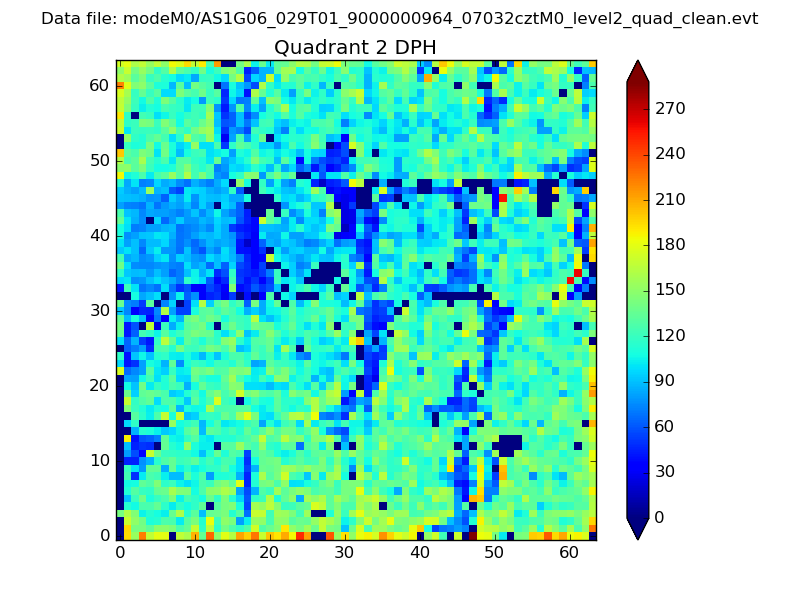
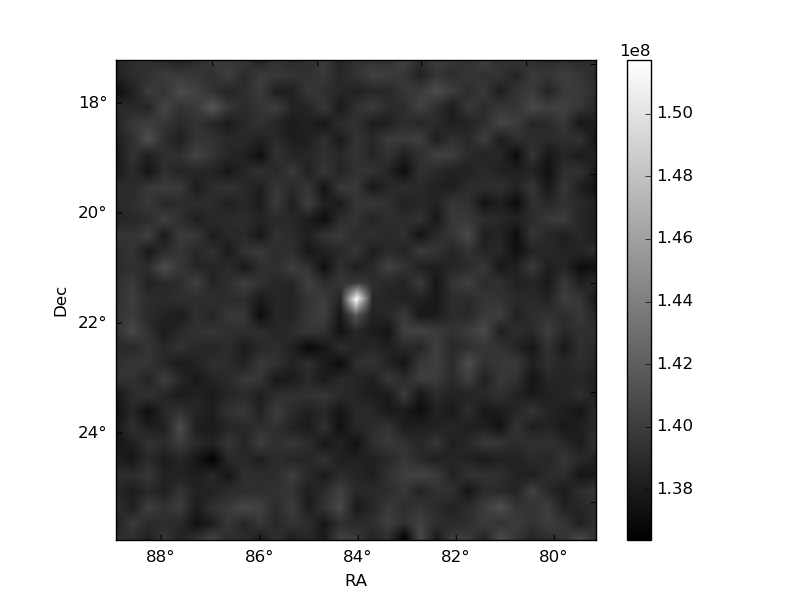
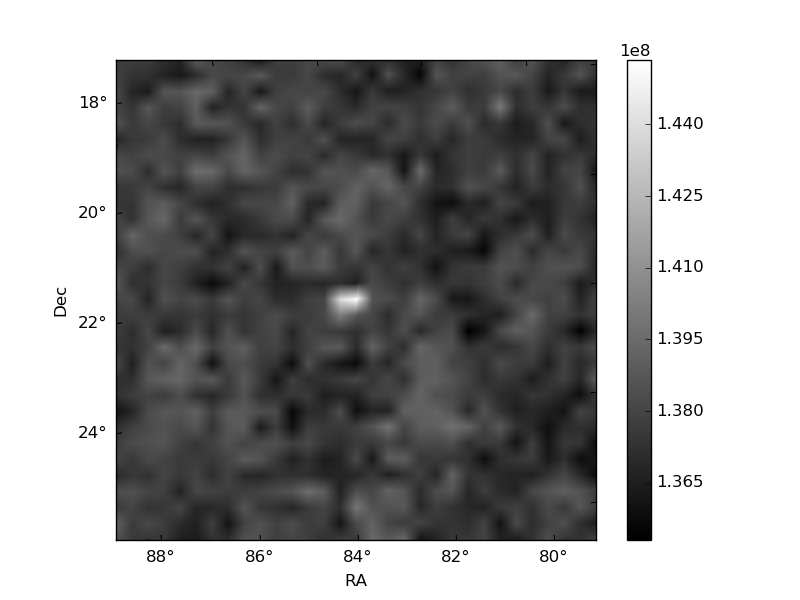
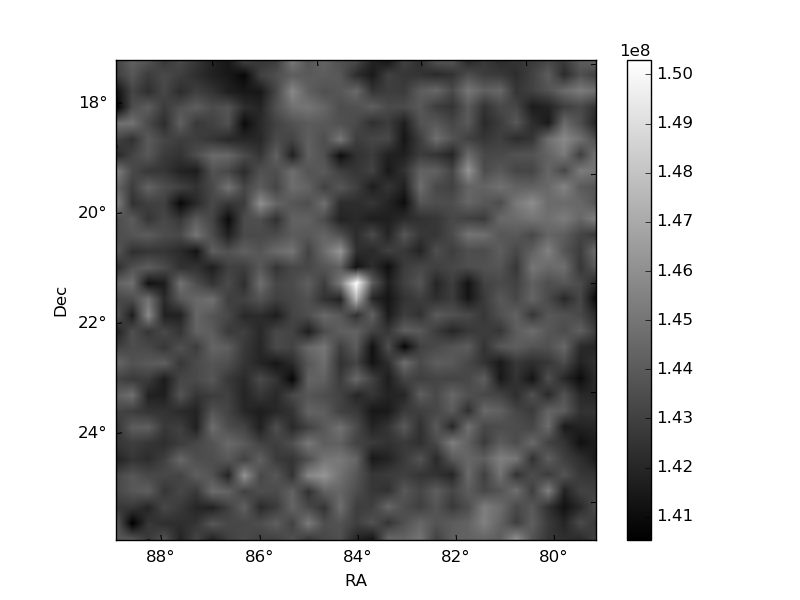
Histogram calculated using DETX and DETY for each event in the final _common_clean file
| Quadrant A | 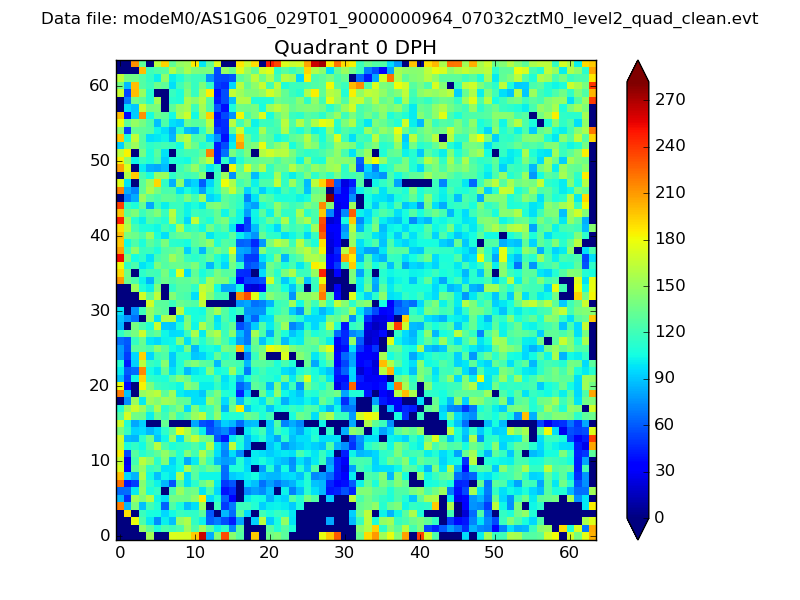 |
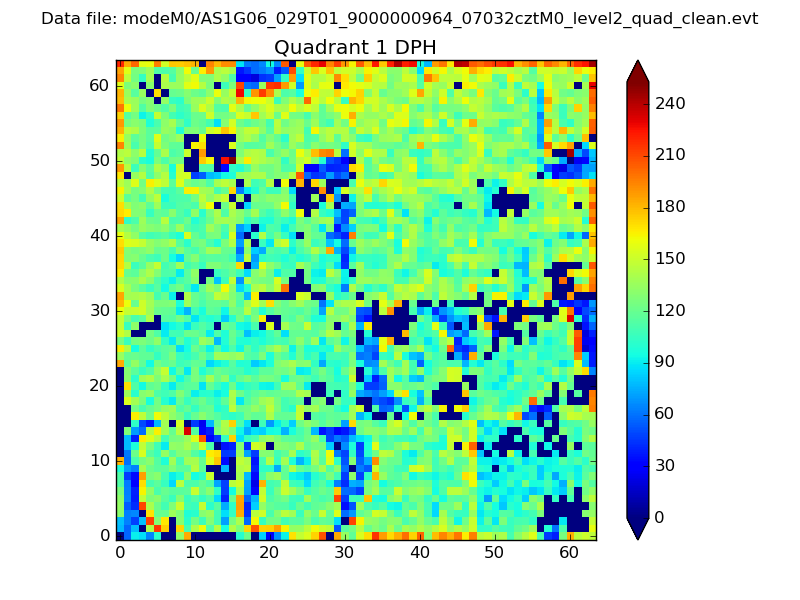 |
Quadrant B |
|---|---|---|---|
| Quadrant D | 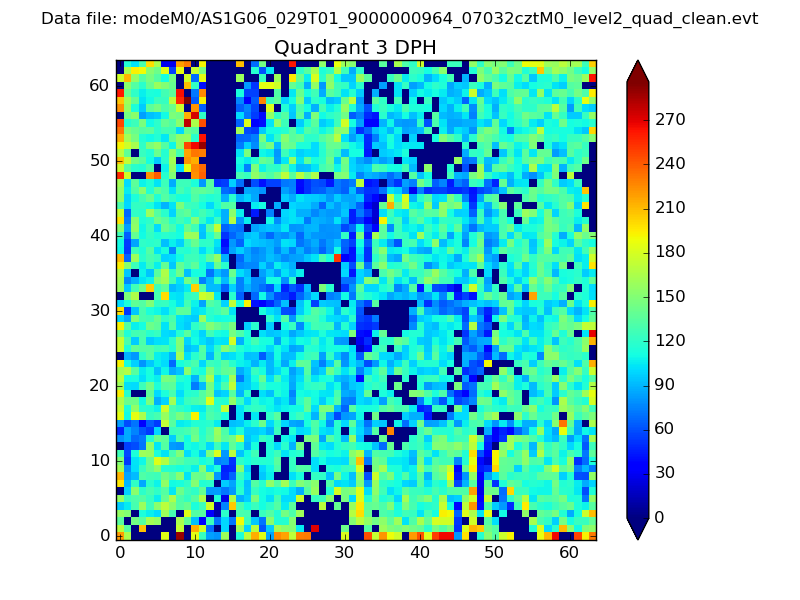 |
 |
Quadrant C |
| Plot type | Count rate plots | Images |
|---|---|---|
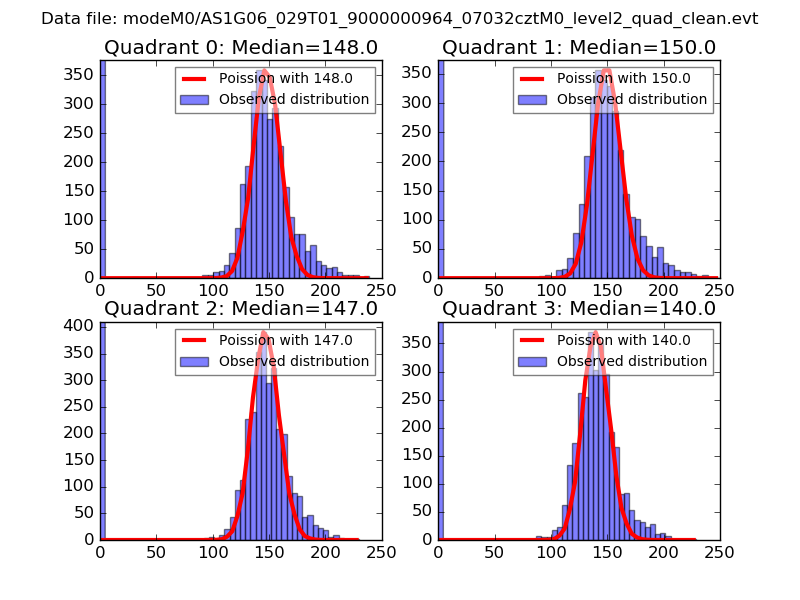
| Comparison with Poisson distribution Blue bars denote a histogram of data divided into 1 sec bins. Red curve is a Poisson curve with rate = median count rate of data. |
 |
 |
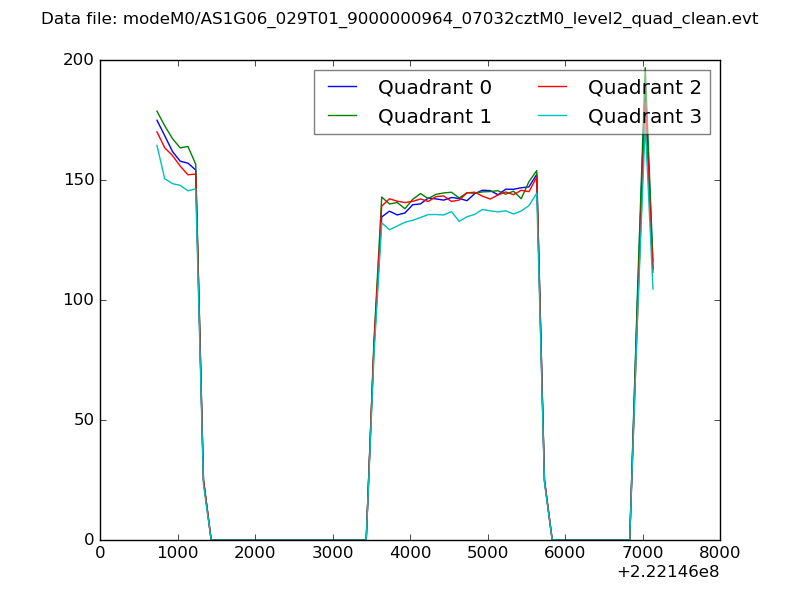
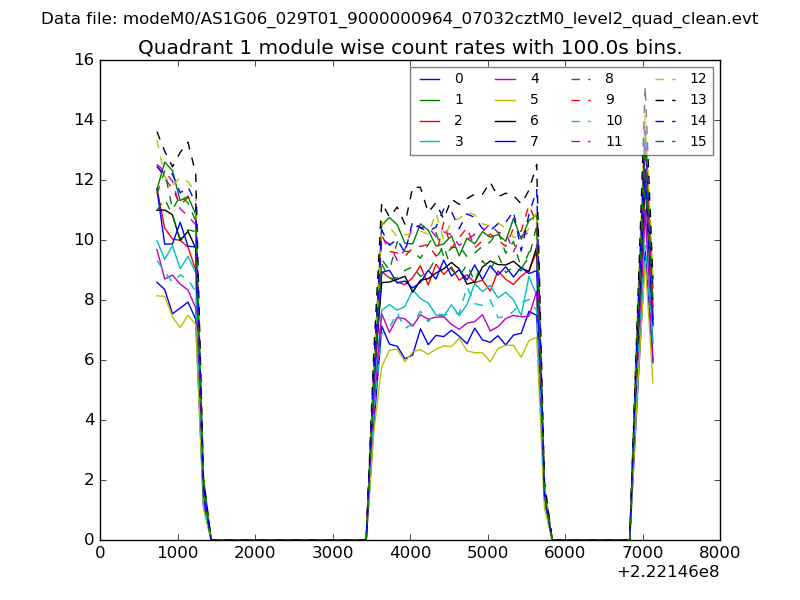
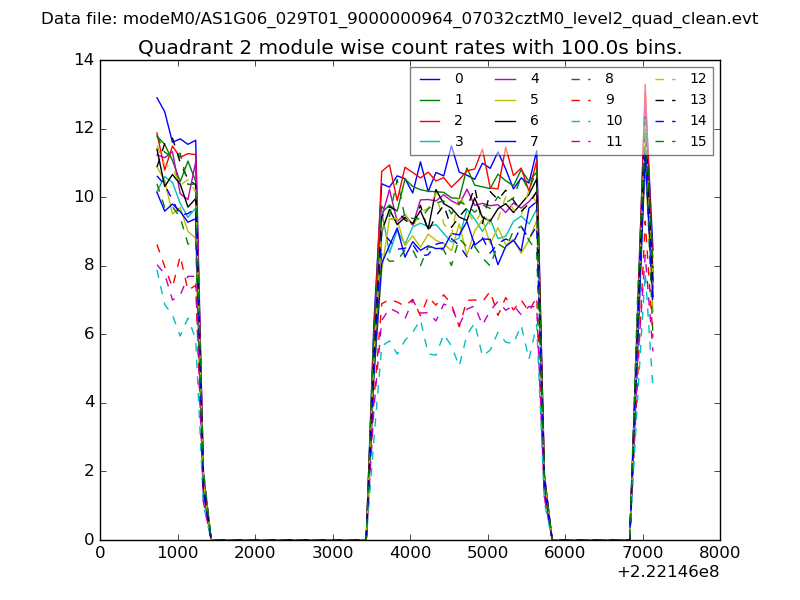
| Quadrant-wise count rates Data is divided into 100 sec bins |
 |
|
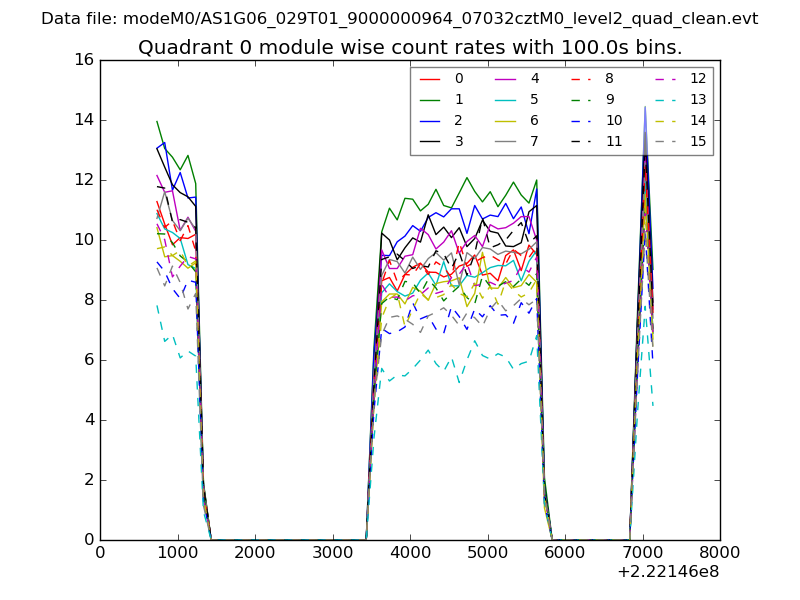
| Module-wise count rates for Quadrant A Data is divided into 100 sec bins |
 |
 |
| Module-wise count rates for Quadrant B Data is divided into 100 sec bins |
 |
 |
| Module-wise count rates for Quadrant C Data is divided into 100 sec bins |
 |
 |
| Module-wise count rates for Quadrant D Data is divided into 100 sec bins |
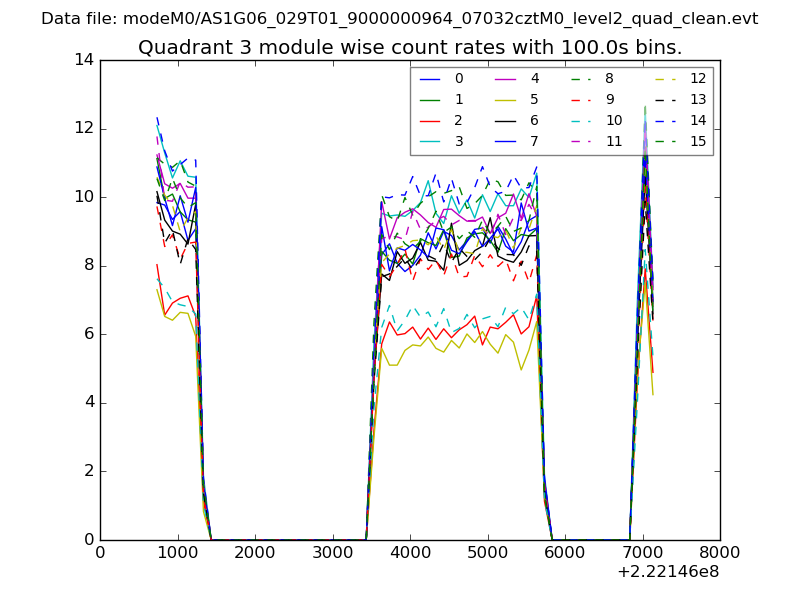 |
 |
| Parameter | Plot |
|---|---|
| CZT HV Monitor | 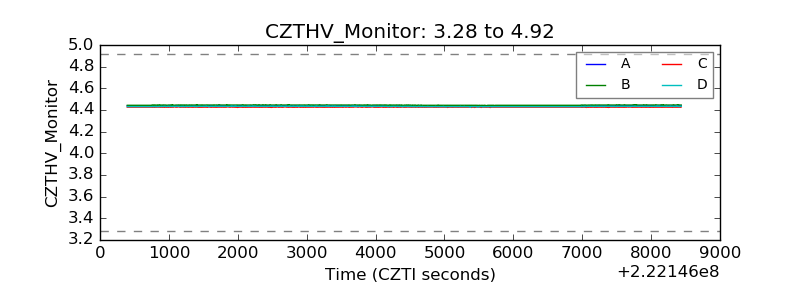 |
| D_VDD | 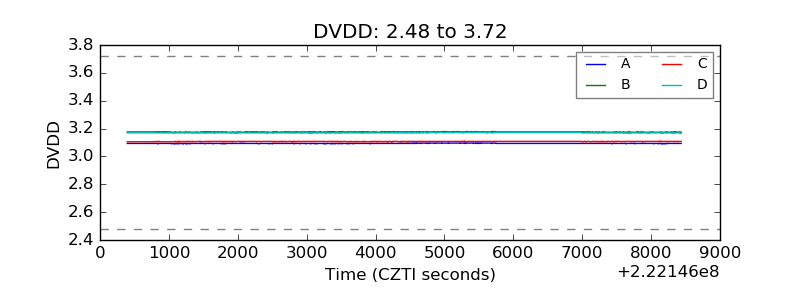 |
| Temperature 1 | 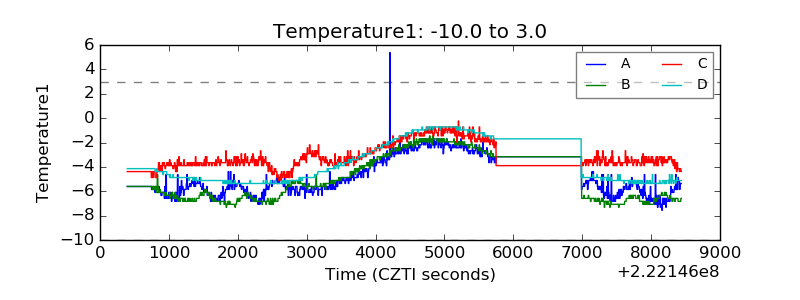 |
| Veto HV Monitor | 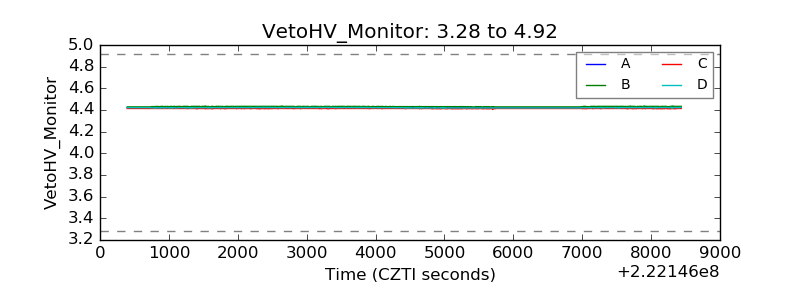 |
| Veto LLD | 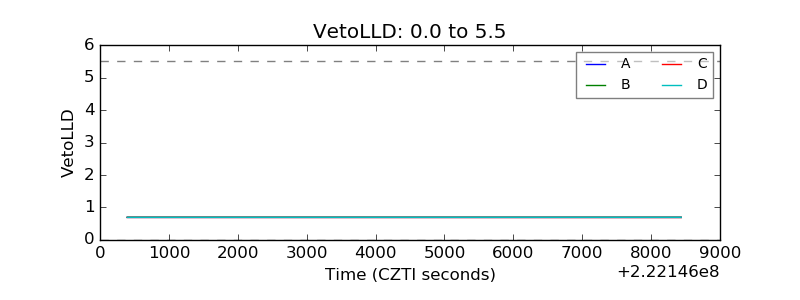 |
| Alpha Counter | 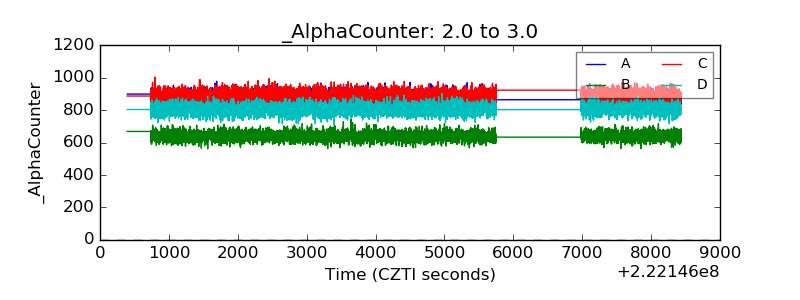 |
| _CPM_Rate | 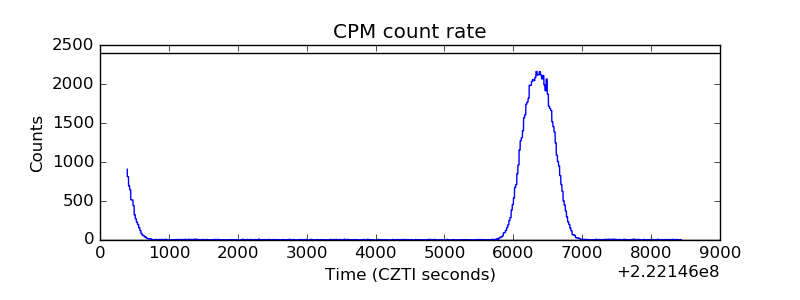 |
| CZT Counter | 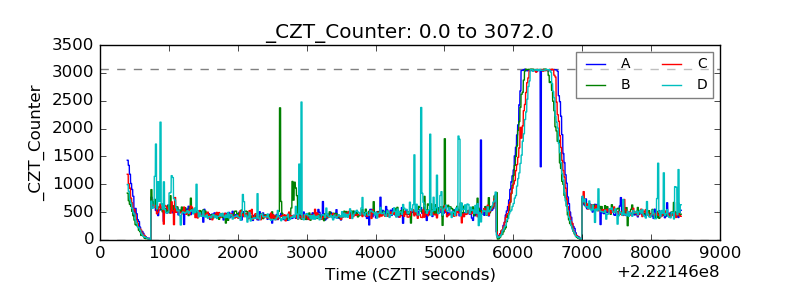 |
| +2.5 Volts monitor | 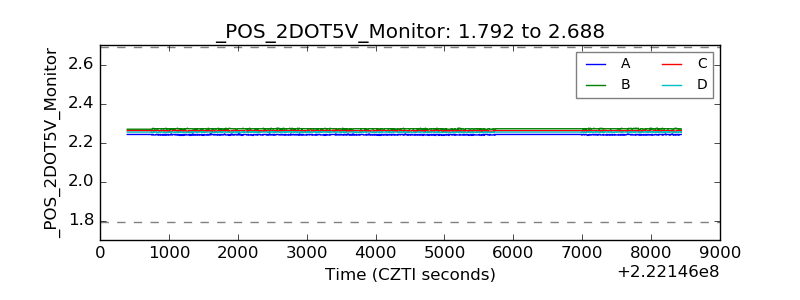 |
| +5 Volts monitor | 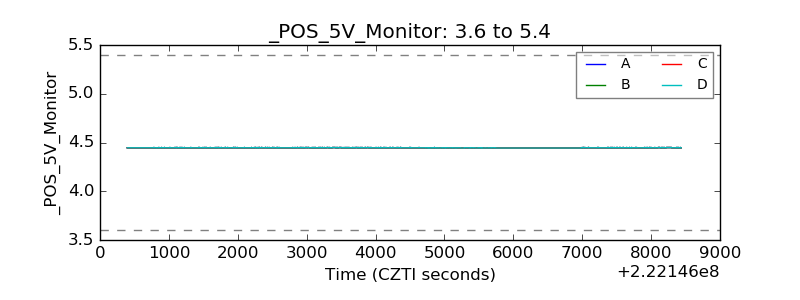 |
| _ROLL_ROT | 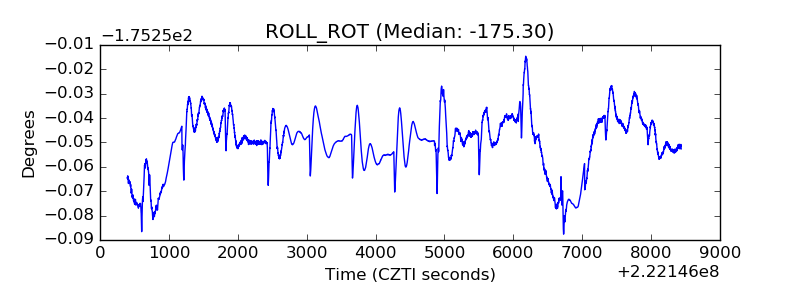 |
| _Roll_DEC | 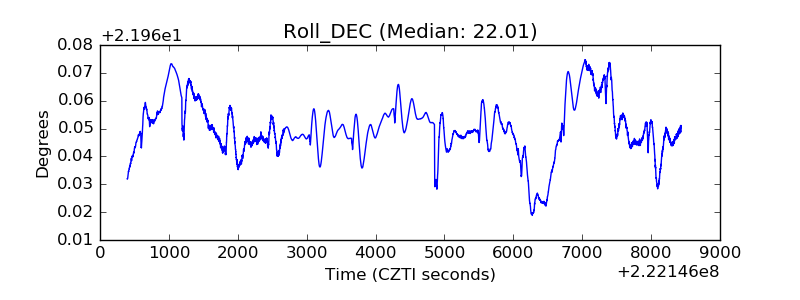 |
| _Roll_RA | 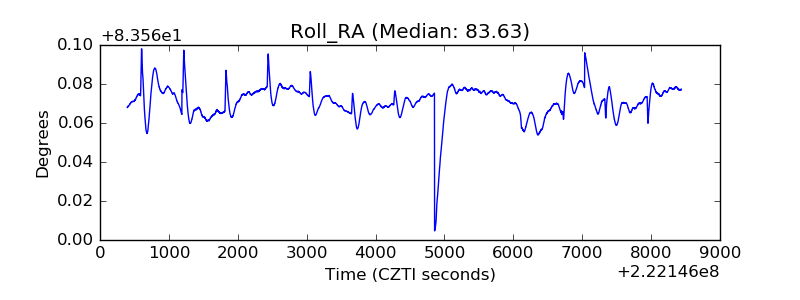 |
| Veto Counter | 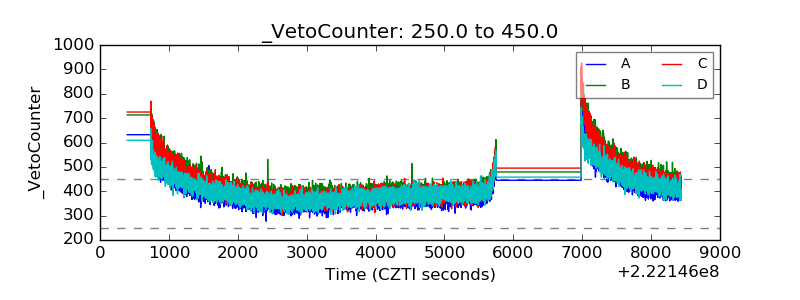 |