| Param | Original file | Final file |
|---|---|---|
| Filename | modeM0/AS1G06_029T01_9000000964_07033cztM0_level2.evt | modeM0/AS1G06_029T01_9000000964_07033cztM0_level2_quad_clean.evt |
| Size (bytes) | 451,529,280 | 67,518,720 |
| Size | 430.6 MB | 64.4 MB |
| Events in quadrant A | 3,223,670 | 403,800 |
| Events in quadrant B | 3,321,084 | 411,156 |
| Events in quadrant C | 3,146,494 | 401,522 |
| Events in quadrant D | 3,546,004 | 378,835 |
| Mode M0 | |||
|---|---|---|---|
| Quadrant | BADHDUFLAG | Total packets | Discarded packets |
| A | 0 | 13449 | 3 |
| B | 0 | 13666 | 2 |
| C | 0 | 13307 | 2 |
| D | 0 | 14614 | 2 |
| Mode M9 | |||
|---|---|---|---|
| Quadrant | BADHDUFLAG | Total packets | Discarded packets |
| A | 0 | 17 | 0 |
| B | 0 | 17 | 0 |
| C | 0 | 17 | 0 |
| D | 0 | 18 | 0 |
| Mode SS | |||
|---|---|---|---|
| Quadrant | BADHDUFLAG | Total packets | Discarded packets |
| A | 0 | 132 | 0 |
| B | 0 | 132 | 0 |
| C | 0 | 132 | 0 |
| D | 0 | 132 | 0 |
| Quadrant | Total seconds | Saturated seconds | Saturation percentage |
|---|---|---|---|
| A | 6432 | 22 | 0.342040% |
| B | 6432 | 27 | 0.419776% |
| C | 6432 | 28 | 0.435323% |
| D | 6432 | 65 | 1.010572% |
Noise dominated data is calculated using 1-second bins in cleaned event files. If a bin has >2000 counts, and if more than 50% of those come from <1% of pixels, then it is considered to be noise-dominated and hence unusable.
| Quadrant | # 1 sec bins | Bins with >0 counts | Bins with >2000 counts | High rate bins dominated by noise | Noise dominated (total time) | Noise dominated (detector-on time) | Marked lightcurve |
|---|---|---|---|---|---|---|---|
| A | 7732 | 6433 | 0 | 0 | 0.00% | 0.00% | 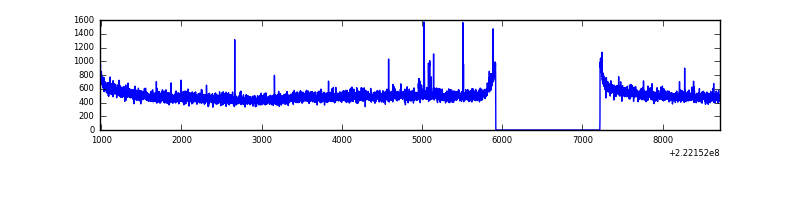 |
| B | 7732 | 6433 | 0 | 0 | 0.00% | 0.00% | 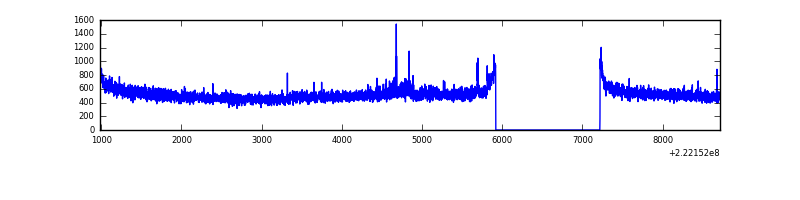 |
| C | 7732 | 6433 | 0 | 0 | 0.00% | 0.00% | 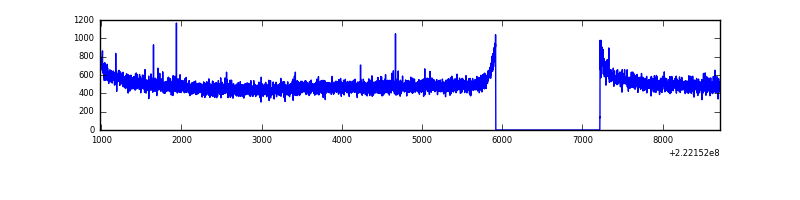 |
| D | 7732 | 6433 | 46 | 46 | 0.59% | 0.72% | 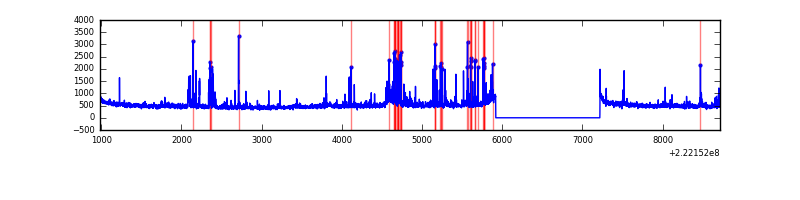 |
Top three noisy pixels from each quadrant. If the there are fewer than three noisy pixels in the level2.evt file, extra rows are filled as -1
| Pixel properties | Quadrant properties | ||||||
|---|---|---|---|---|---|---|---|
| Quadrant | DetID | PixID | Counts | Sigma | Mean | Median | Sigma |
| A | 8 | 15 | 38862 | 227.7 | 827 | 813 | 167.1 |
| A | 0 | 226 | 7858 | 42.16 | 827 | 813 | 167.1 |
| A | 12 | 194 | 7457 | 39.76 | 827 | 813 | 167.1 |
| B | 0 | 214 | 35224 | 217.46 | 838 | 822 | 158.2 |
| B | 7 | 202 | 21083 | 128.07 | 838 | 822 | 158.2 |
| B | 0 | 219 | 15947 | 95.61 | 838 | 822 | 158.2 |
| C | 1 | 16 | 13724 | 70.05 | 800 | 808 | 184.4 |
| C | 13 | 61 | 6237 | 29.44 | 800 | 808 | 184.4 |
| C | 14 | 67 | 6130 | 28.86 | 800 | 808 | 184.4 |
| D | 2 | 216 | 287614 | 1468.89 | 792 | 769 | 195.3 |
| D | 8 | 195 | 127476 | 648.85 | 792 | 769 | 195.3 |
| D | 12 | 233 | 119386 | 607.42 | 792 | 769 | 195.3 |
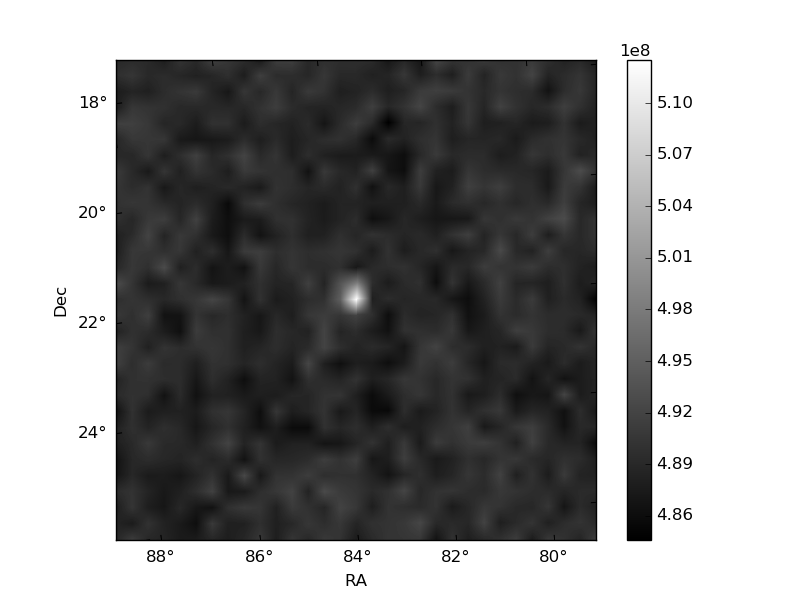
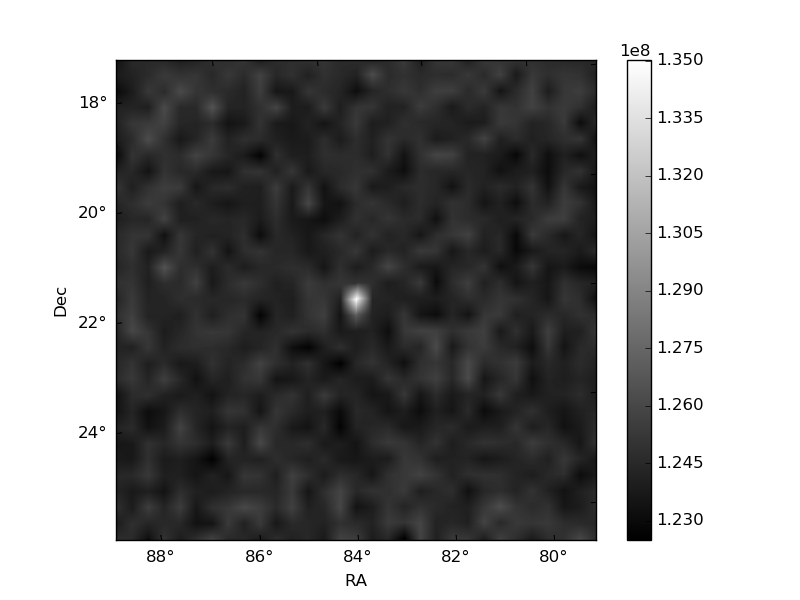
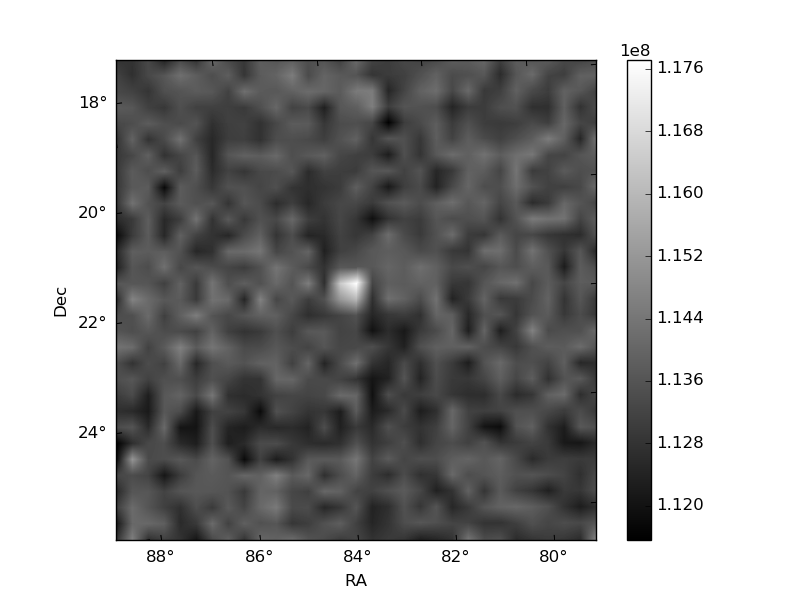
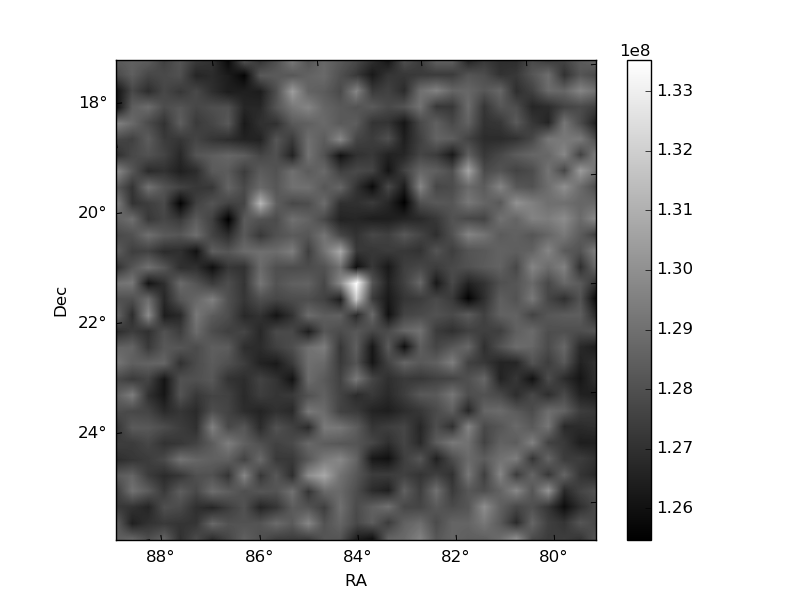
Histogram calculated using DETX and DETY for each event in the final _common_clean file
| Quadrant A | 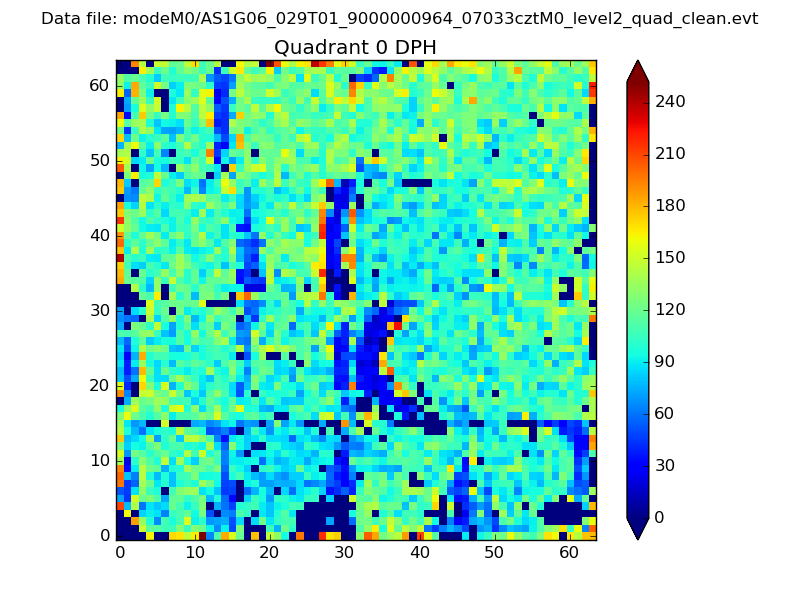 |
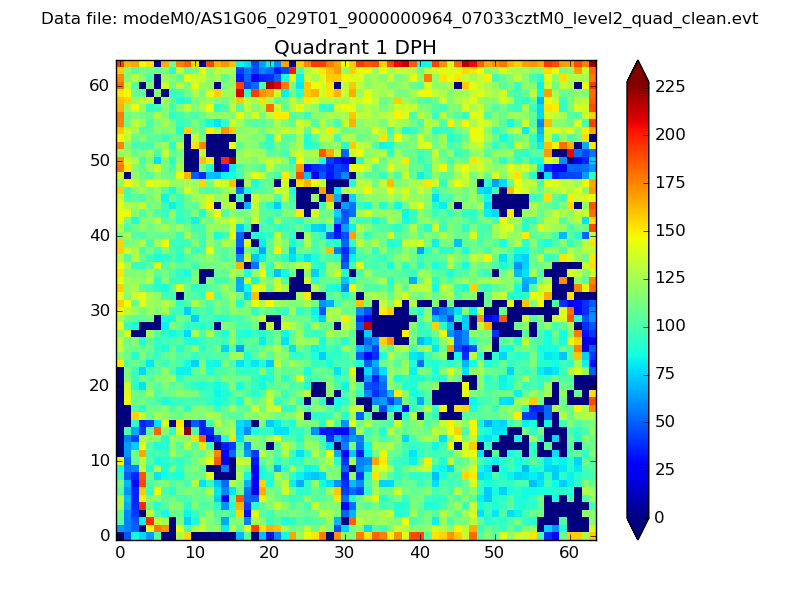 |
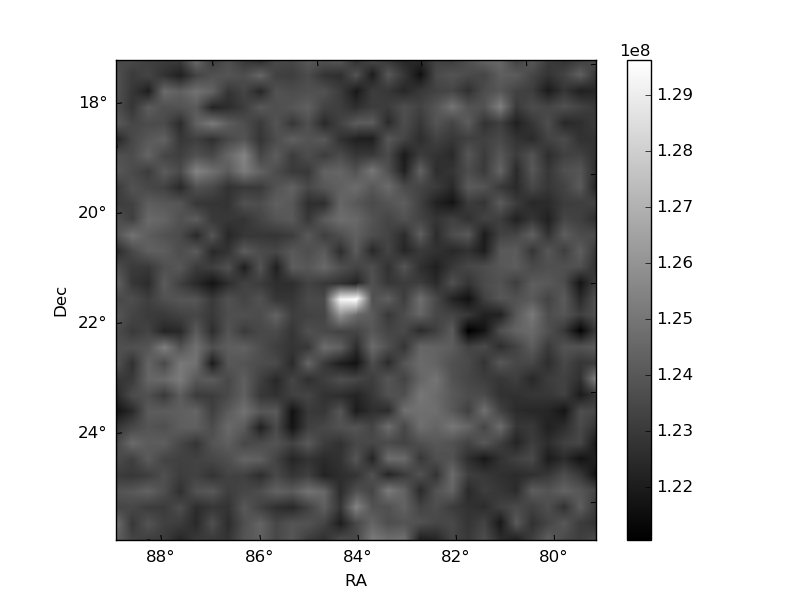
Quadrant B |
|---|---|---|---|
| Quadrant D | 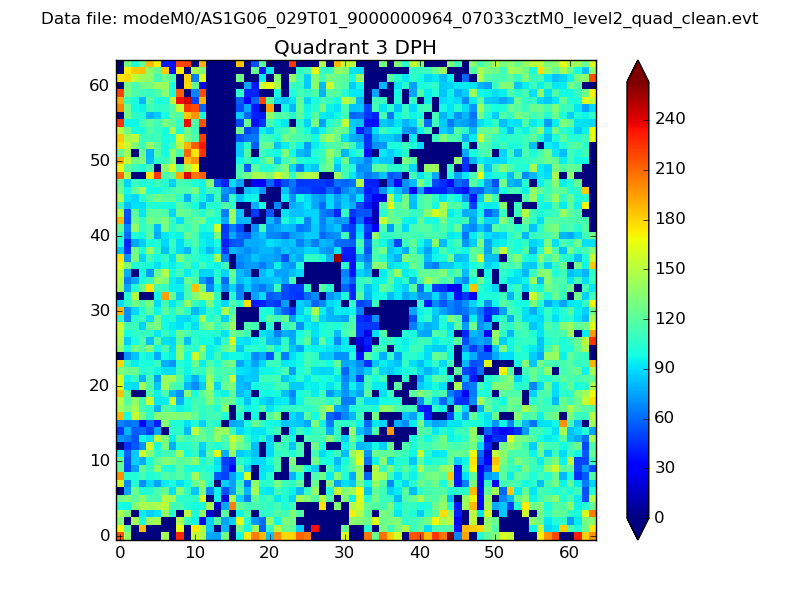 |
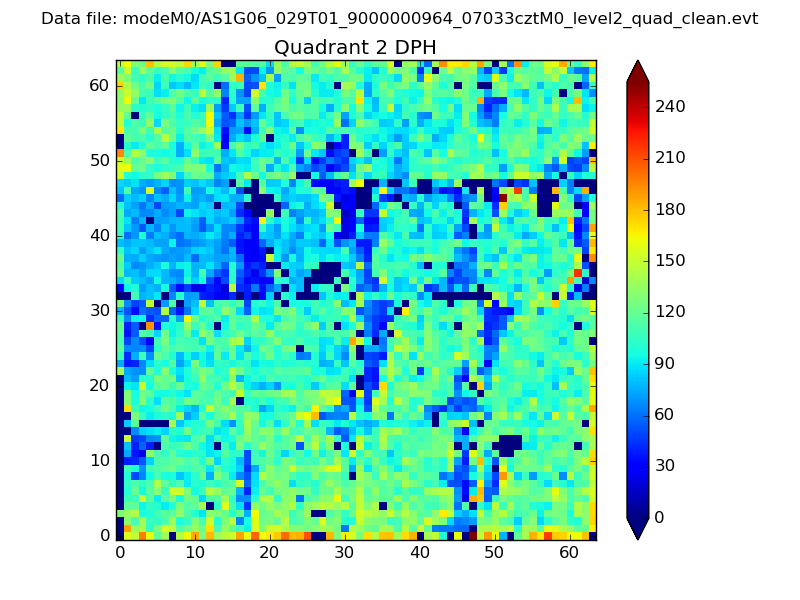 |
Quadrant C |
| Plot type | Count rate plots | Images |
|---|---|---|
| Comparison with Poisson distribution Blue bars denote a histogram of data divided into 1 sec bins. Red curve is a Poisson curve with rate = median count rate of data. |
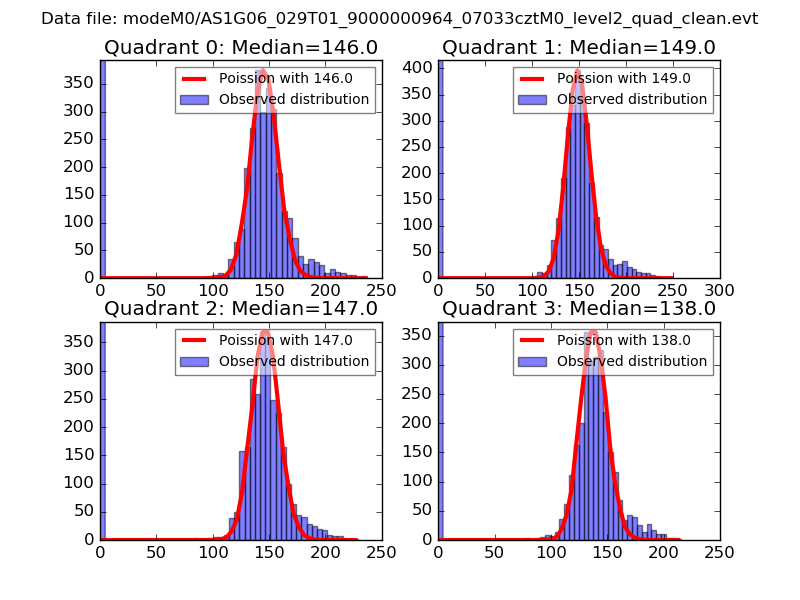 |
 |
| Quadrant-wise count rates Data is divided into 100 sec bins |
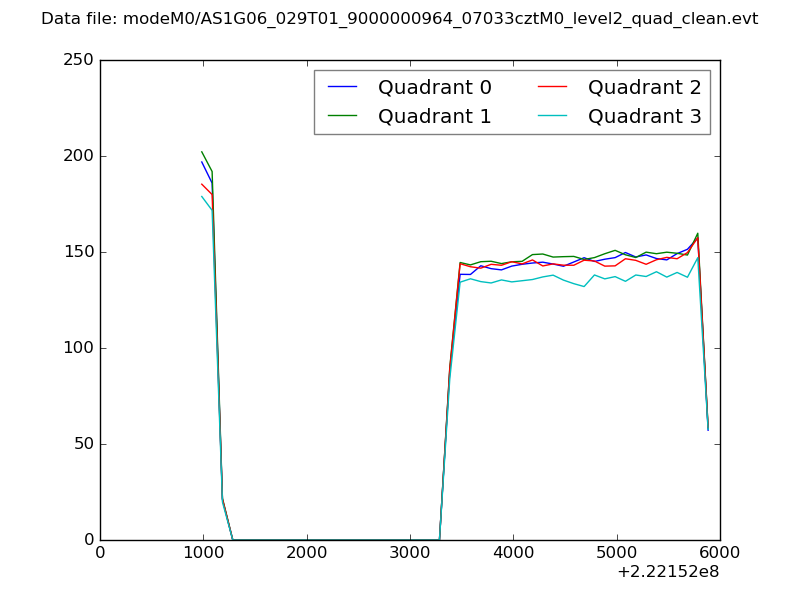 |
|
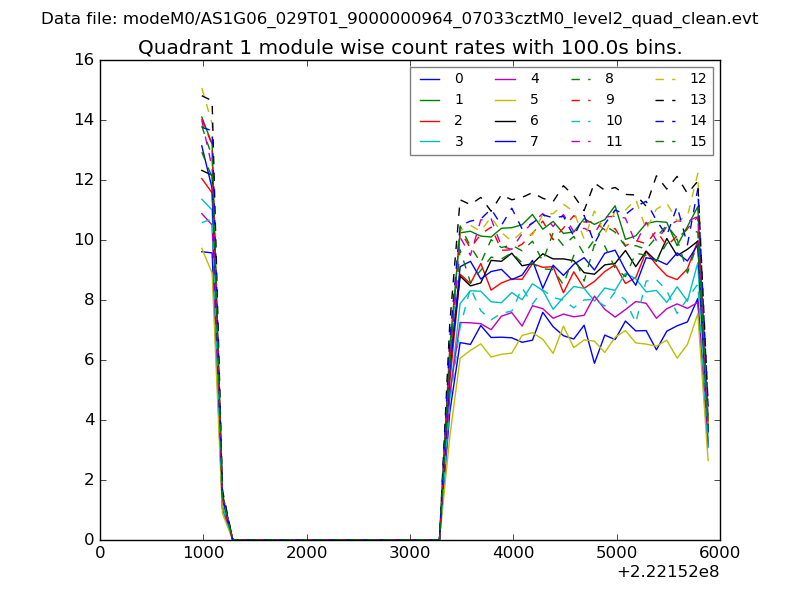
| Module-wise count rates for Quadrant A Data is divided into 100 sec bins |
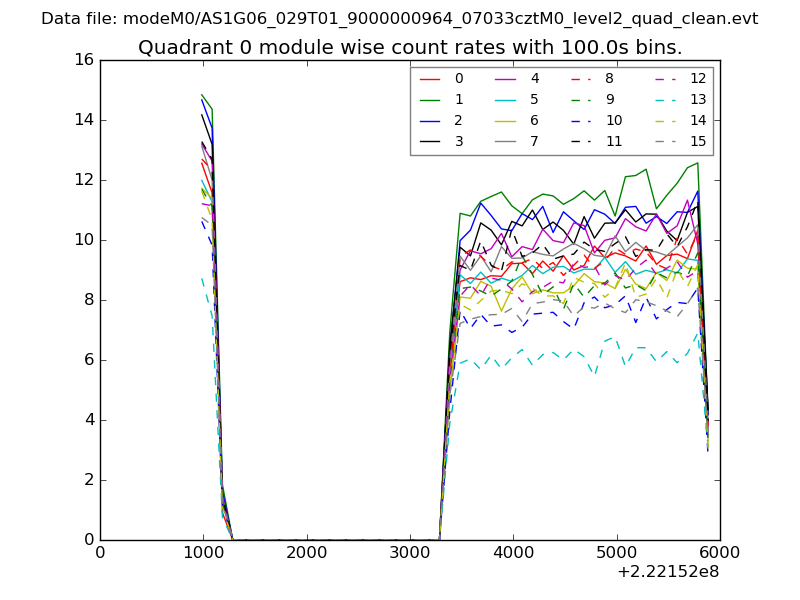 |
 |
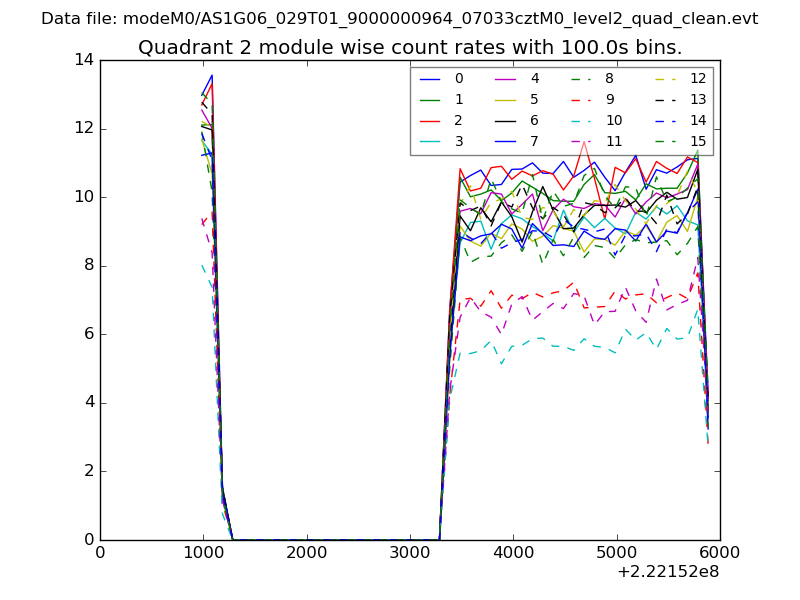
| Module-wise count rates for Quadrant B Data is divided into 100 sec bins |
 |
 |
| Module-wise count rates for Quadrant C Data is divided into 100 sec bins |
 |
 |
| Module-wise count rates for Quadrant D Data is divided into 100 sec bins |
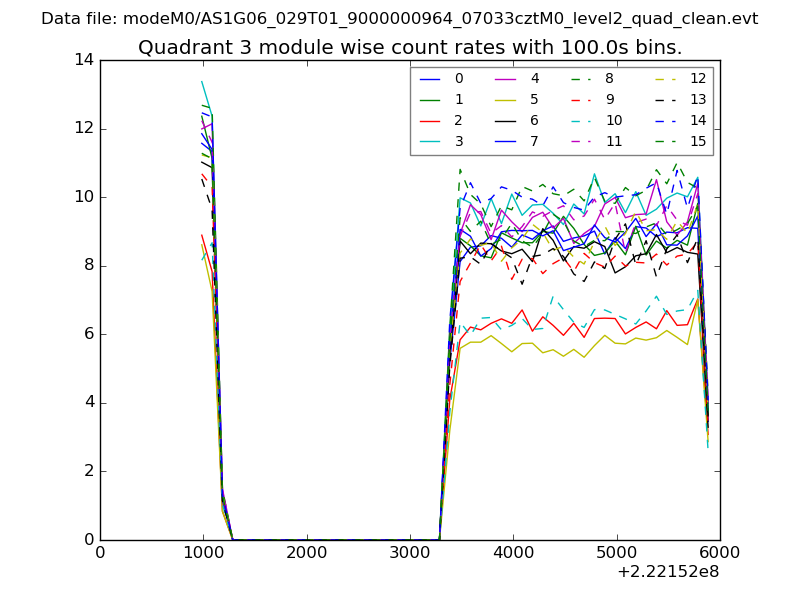 |
 |
| Parameter | Plot |
|---|---|
| CZT HV Monitor | 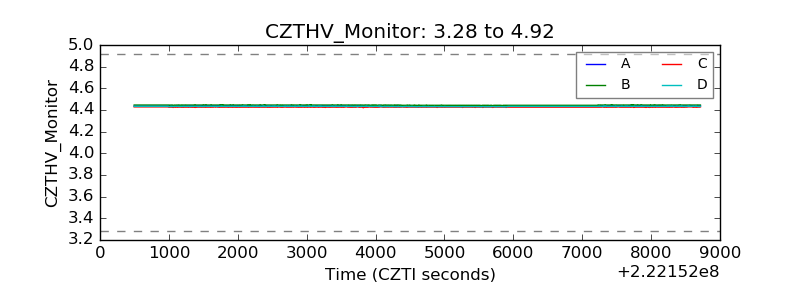 |
| D_VDD | 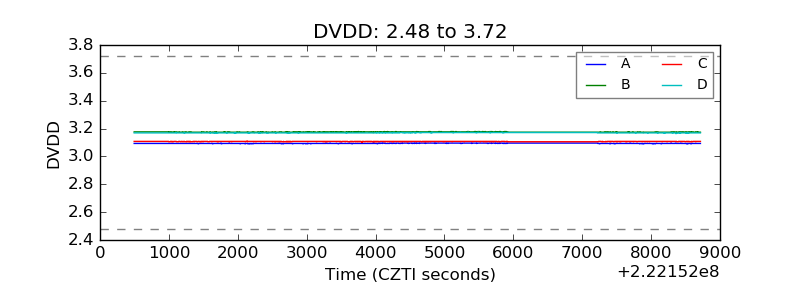 |
| Temperature 1 | 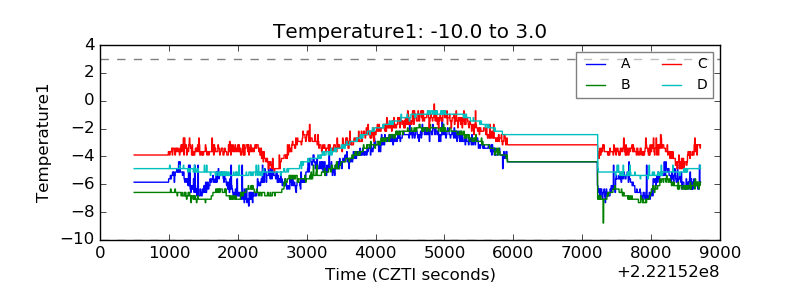 |
| Veto HV Monitor | 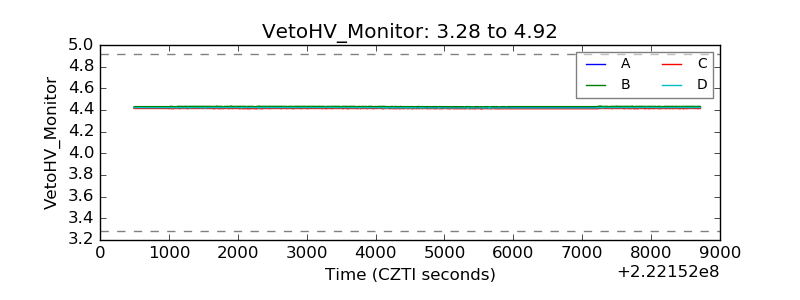 |
| Veto LLD | 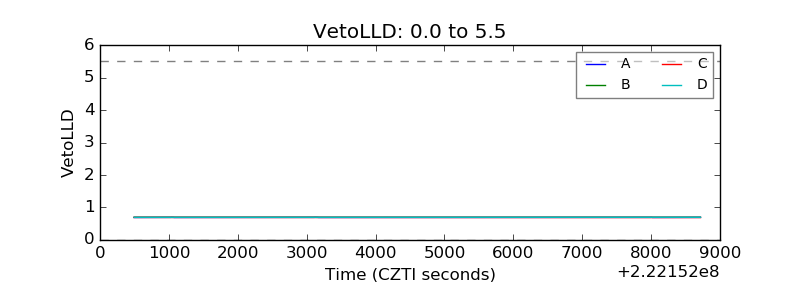 |
| Alpha Counter | 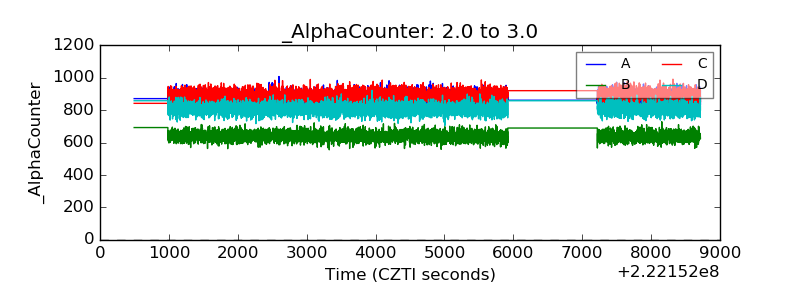 |
| _CPM_Rate | 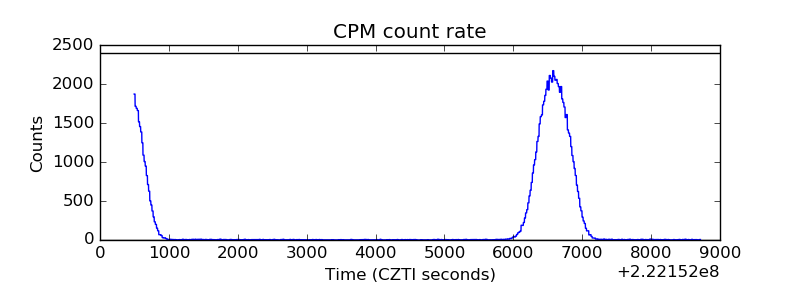 |
| CZT Counter |  |
| +2.5 Volts monitor |  |
| +5 Volts monitor |  |
| _ROLL_ROT | 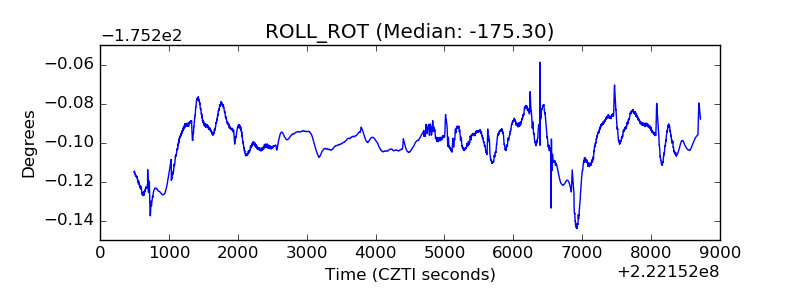 |
| _Roll_DEC | 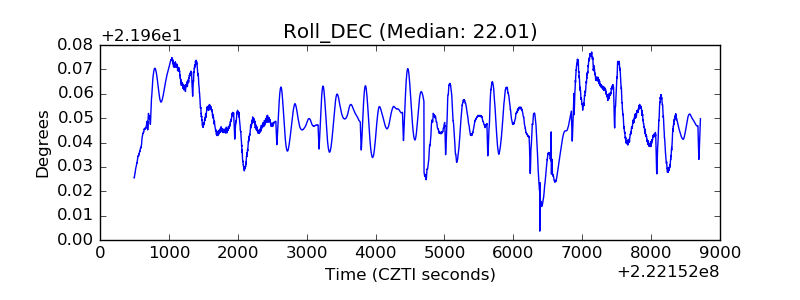 |
| _Roll_RA | 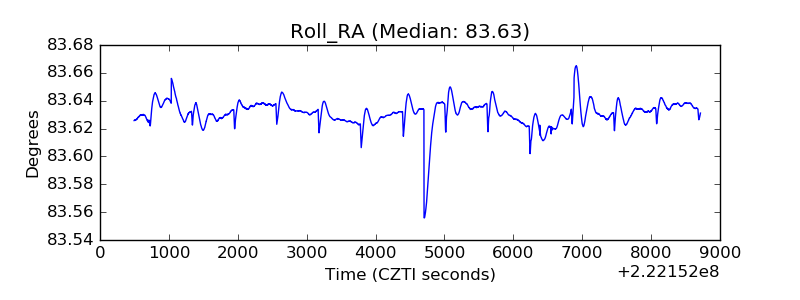 |
| Veto Counter | 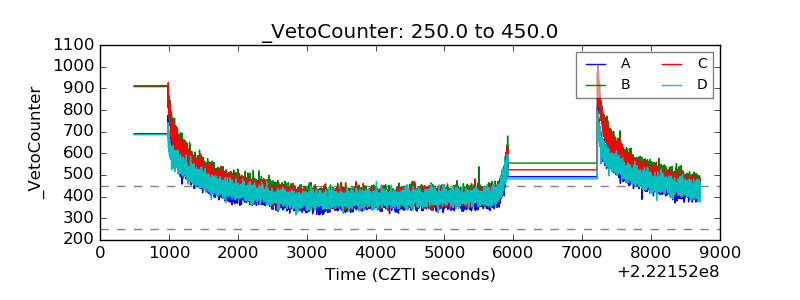 |