| Param | Original file | Final file |
|---|---|---|
| Filename | modeM0/AS1G06_029T01_9000000964_07036cztM0_level2.evt | modeM0/AS1G06_029T01_9000000964_07036cztM0_level2_quad_clean.evt |
| Size (bytes) | 481,360,320 | 92,759,040 |
| Size | 459.1 MB | 88.5 MB |
| Events in quadrant A | 3,366,555 | 595,725 |
| Events in quadrant B | 3,473,683 | 602,538 |
| Events in quadrant C | 3,249,826 | 588,964 |
| Events in quadrant D | 4,036,745 | 558,842 |
| Mode M0 | |||
|---|---|---|---|
| Quadrant | BADHDUFLAG | Total packets | Discarded packets |
| A | 0 | 13990 | 3 |
| B | 0 | 14206 | 2 |
| C | 0 | 13839 | 2 |
| D | 0 | 16088 | 2 |
| Mode M9 | |||
|---|---|---|---|
| Quadrant | BADHDUFLAG | Total packets | Discarded packets |
| A | 0 | 12 | 0 |
| B | 0 | 12 | 0 |
| C | 0 | 12 | 0 |
| D | 0 | 13 | 0 |
| Mode SS | |||
|---|---|---|---|
| Quadrant | BADHDUFLAG | Total packets | Discarded packets |
| A | 0 | 134 | 0 |
| B | 0 | 134 | 0 |
| C | 0 | 134 | 0 |
| D | 0 | 134 | 0 |
| Quadrant | Total seconds | Saturated seconds | Saturation percentage |
|---|---|---|---|
| A | 6642 | 180 | 2.710027% |
| B | 6642 | 186 | 2.800361% |
| C | 6642 | 123 | 1.851852% |
| D | 6642 | 187 | 2.815417% |
Noise dominated data is calculated using 1-second bins in cleaned event files. If a bin has >2000 counts, and if more than 50% of those come from <1% of pixels, then it is considered to be noise-dominated and hence unusable.
| Quadrant | # 1 sec bins | Bins with >0 counts | Bins with >2000 counts | High rate bins dominated by noise | Noise dominated (total time) | Noise dominated (detector-on time) | Marked lightcurve |
|---|---|---|---|---|---|---|---|
| A | 7652 | 6643 | 10 | 10 | 0.13% | 0.15% | 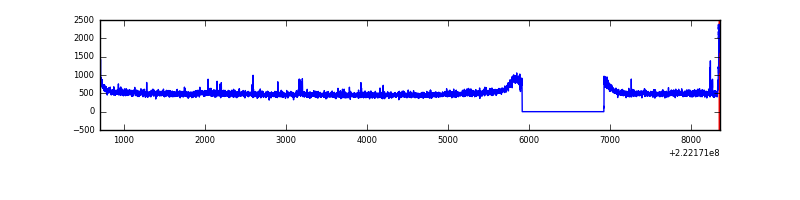 |
| B | 7652 | 6643 | 3 | 3 | 0.04% | 0.05% | 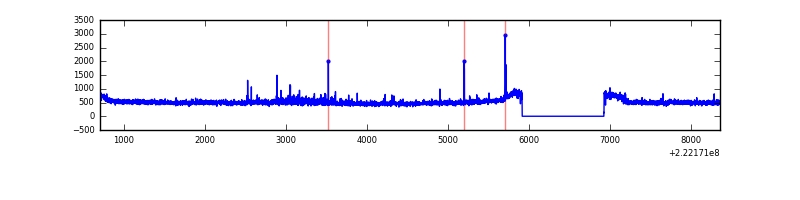 |
| C | 7652 | 6643 | 0 | 0 | 0.00% | 0.00% | 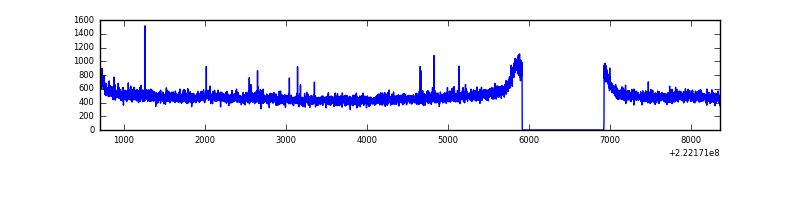 |
| D | 7652 | 6643 | 44 | 44 | 0.58% | 0.66% | 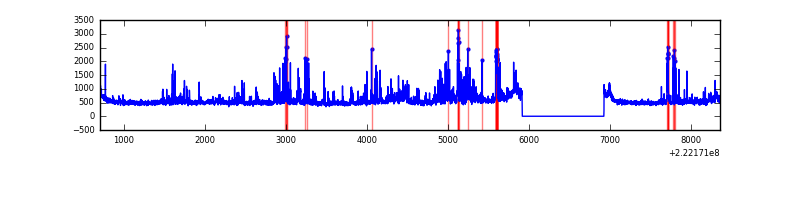 |
Top three noisy pixels from each quadrant. If the there are fewer than three noisy pixels in the level2.evt file, extra rows are filled as -1
| Pixel properties | Quadrant properties | ||||||
|---|---|---|---|---|---|---|---|
| Quadrant | DetID | PixID | Counts | Sigma | Mean | Median | Sigma |
| A | 15 | 234 | 49085 | 277.15 | 857 | 840 | 174.1 |
| A | 2 | 79 | 8417 | 43.53 | 857 | 840 | 174.1 |
| A | 0 | 226 | 8218 | 42.38 | 857 | 840 | 174.1 |
| B | 0 | 214 | 90116 | 542.84 | 861 | 842 | 164.5 |
| B | 4 | 81 | 32842 | 194.58 | 861 | 842 | 164.5 |
| B | 12 | 111 | 16368 | 94.41 | 861 | 842 | 164.5 |
| C | 1 | 16 | 14768 | 72.6 | 825 | 831 | 192.0 |
| C | 10 | 22 | 8819 | 41.61 | 825 | 831 | 192.0 |
| C | 13 | 61 | 6655 | 30.34 | 825 | 831 | 192.0 |
| D | 2 | 216 | 445165 | 2166.65 | 825 | 799 | 205.1 |
| D | 8 | 195 | 247368 | 1202.23 | 825 | 799 | 205.1 |
| D | 6 | 225 | 112677 | 545.5 | 825 | 799 | 205.1 |
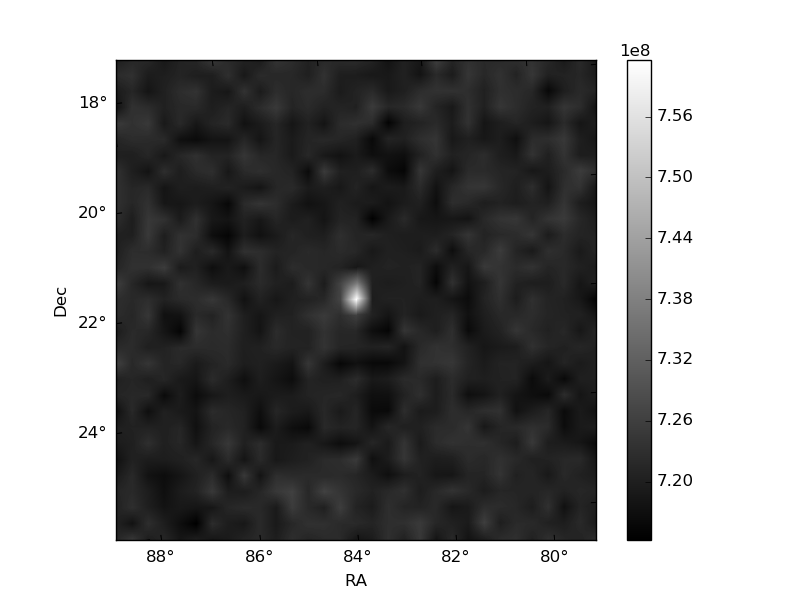
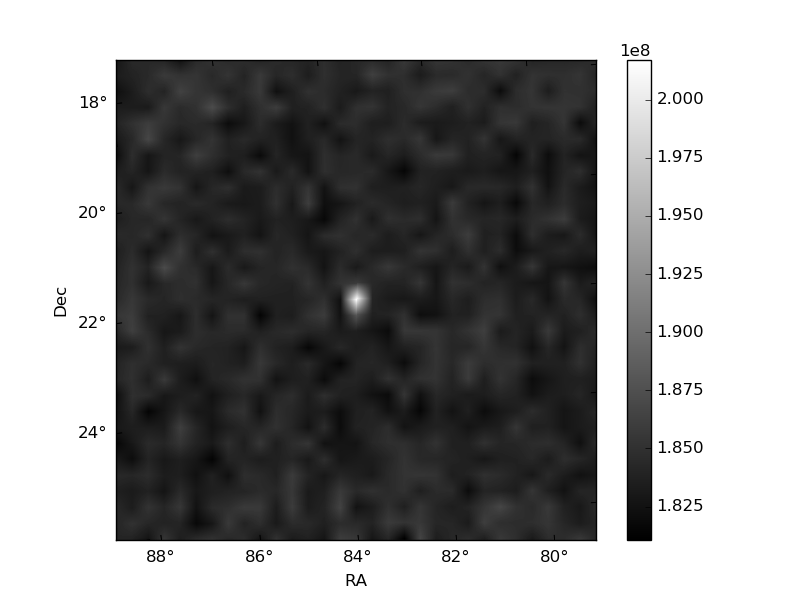
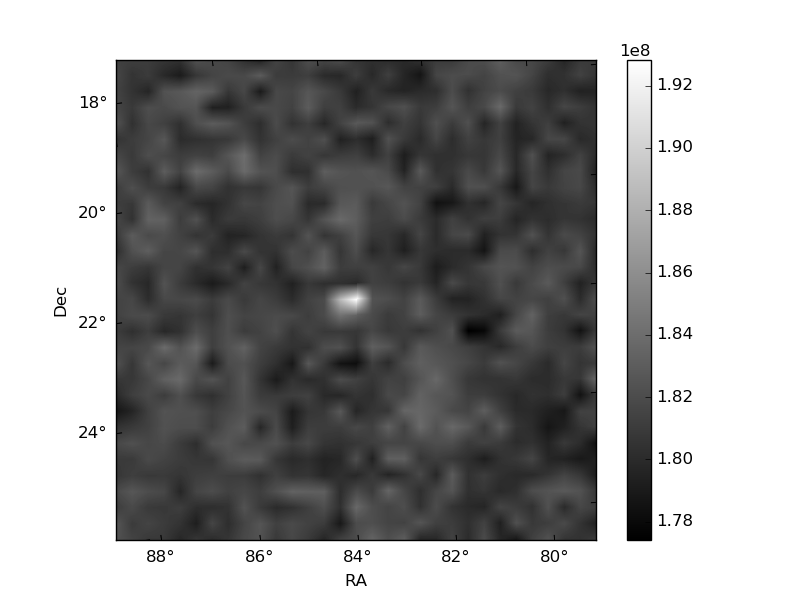
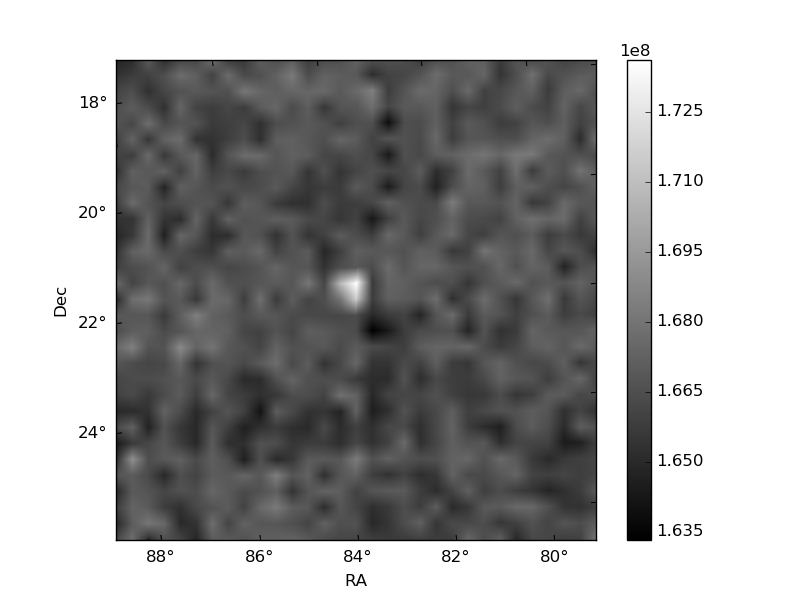
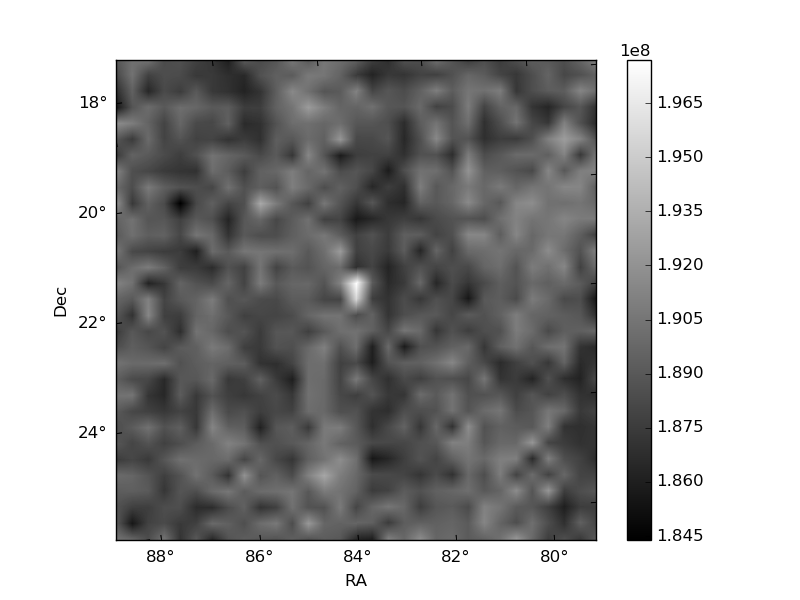
Histogram calculated using DETX and DETY for each event in the final _common_clean file
| Quadrant A | 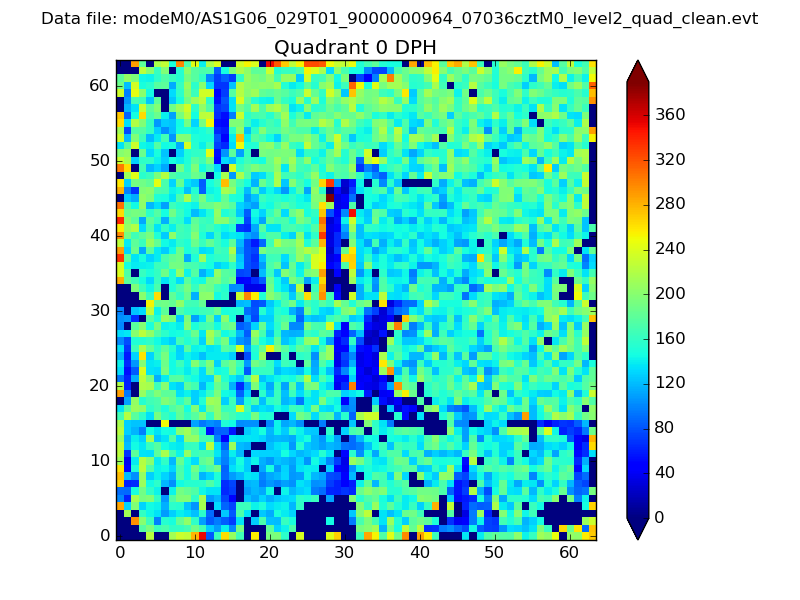 |
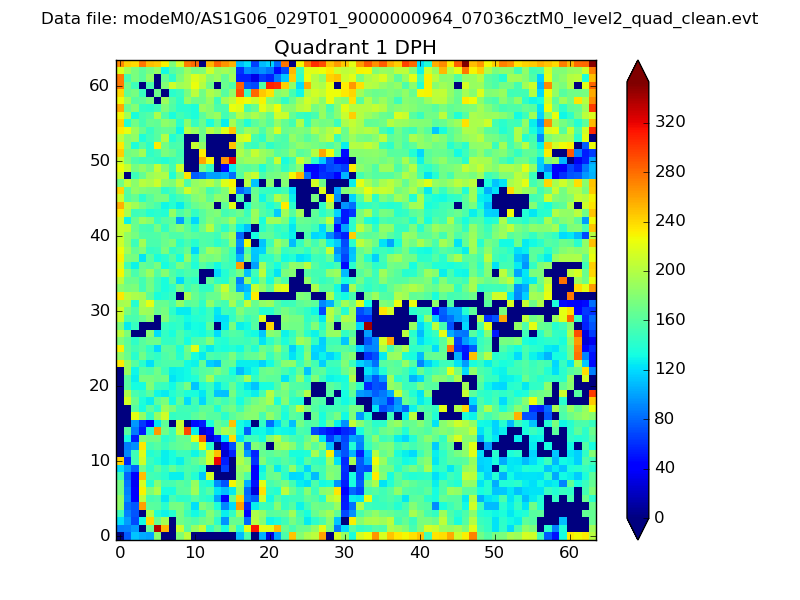 |
Quadrant B |
|---|---|---|---|
| Quadrant D | 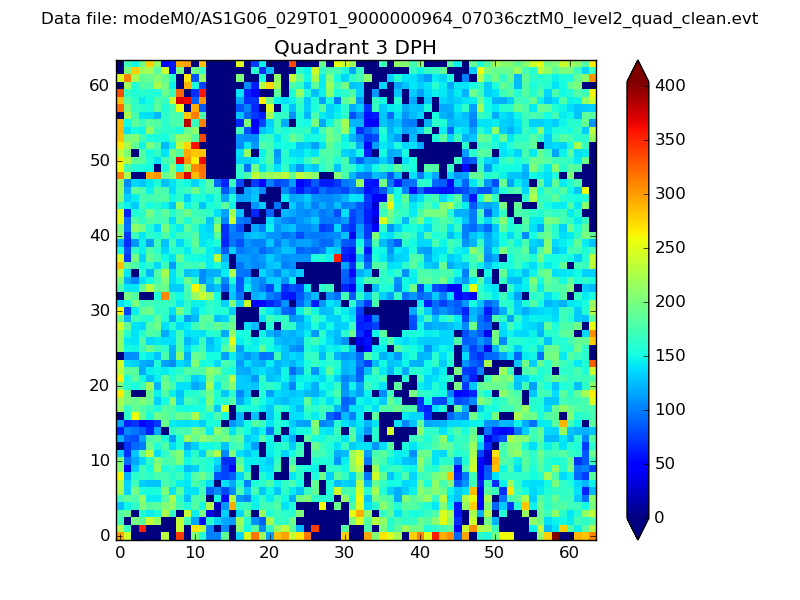 |
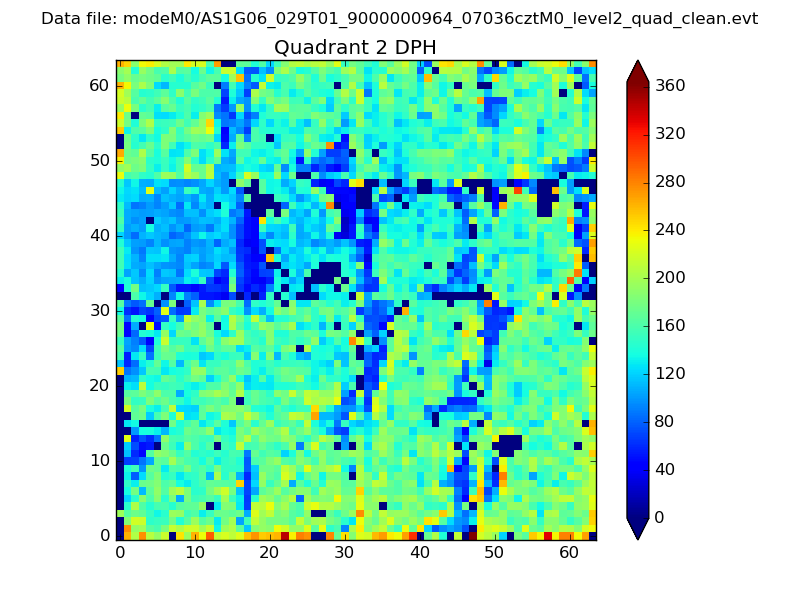 |
Quadrant C |
| Plot type | Count rate plots | Images |
|---|---|---|
| Comparison with Poisson distribution Blue bars denote a histogram of data divided into 1 sec bins. Red curve is a Poisson curve with rate = median count rate of data. |
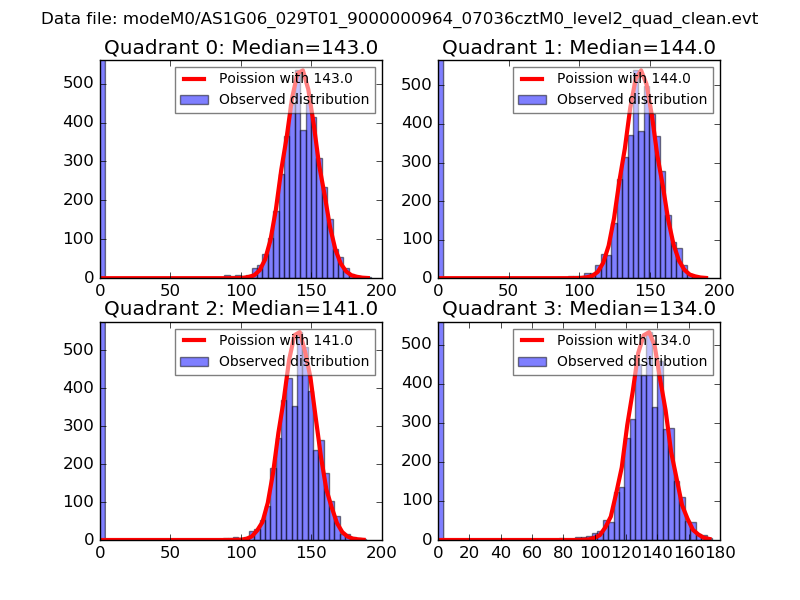 |
 |
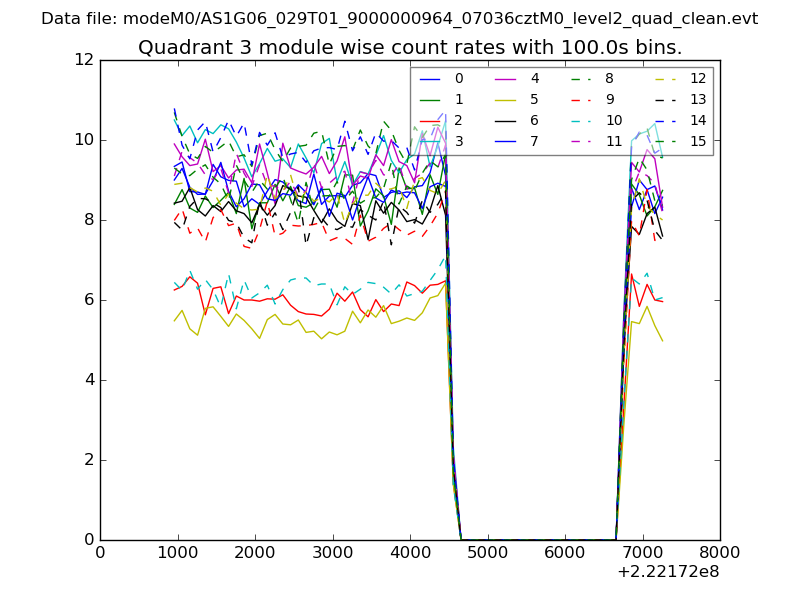
| Quadrant-wise count rates Data is divided into 100 sec bins |
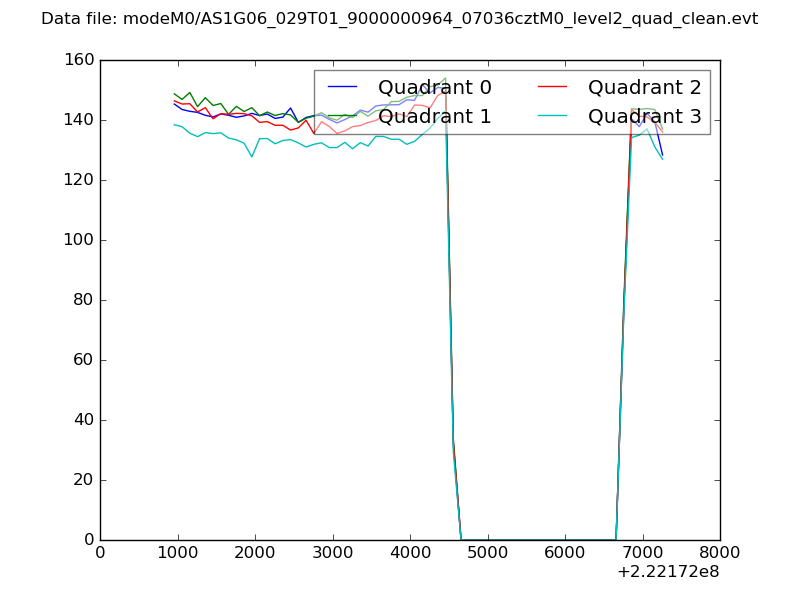 |
|
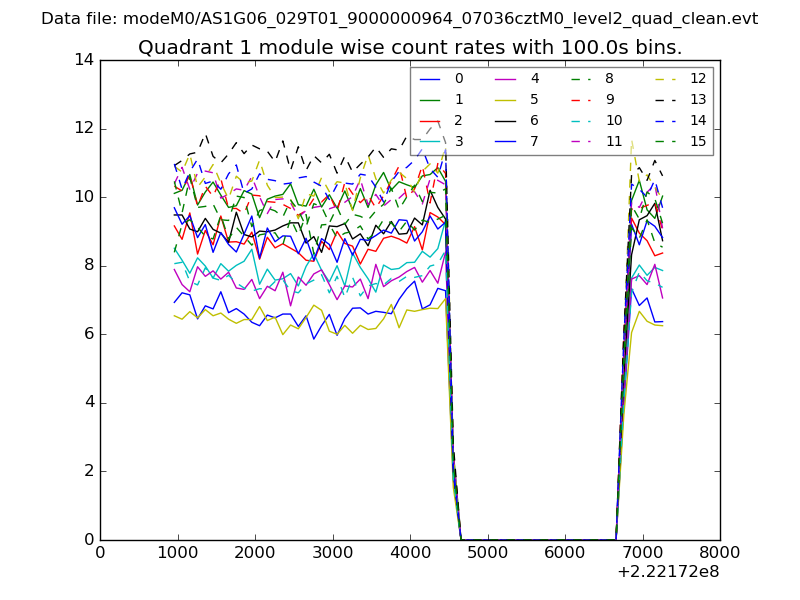
| Module-wise count rates for Quadrant A Data is divided into 100 sec bins |
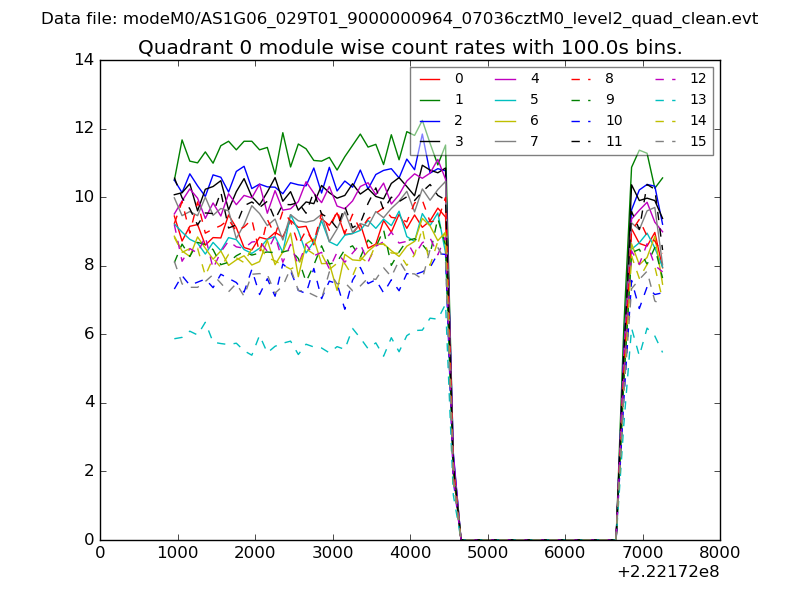 |
 |
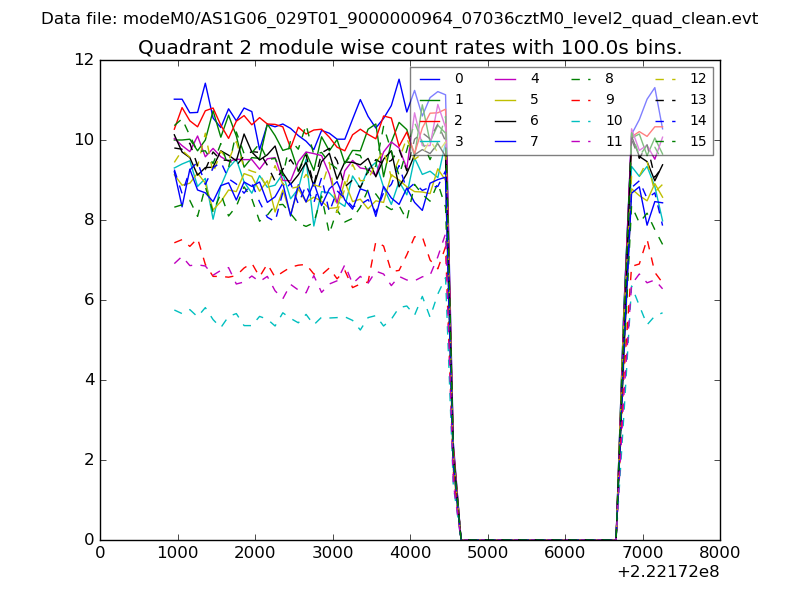
| Module-wise count rates for Quadrant B Data is divided into 100 sec bins |
 |
 |
| Module-wise count rates for Quadrant C Data is divided into 100 sec bins |
 |
 |
| Module-wise count rates for Quadrant D Data is divided into 100 sec bins |
 |
 |
| Parameter | Plot |
|---|---|
| CZT HV Monitor | 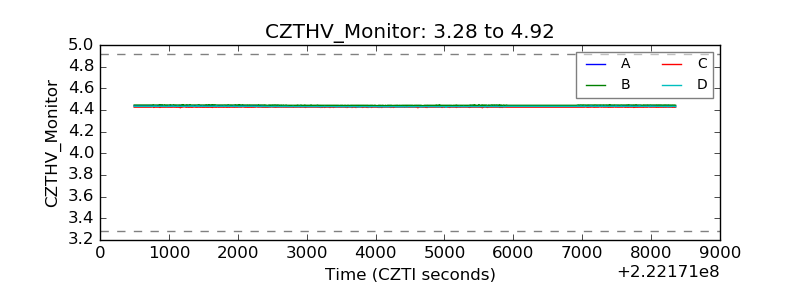 |
| D_VDD | 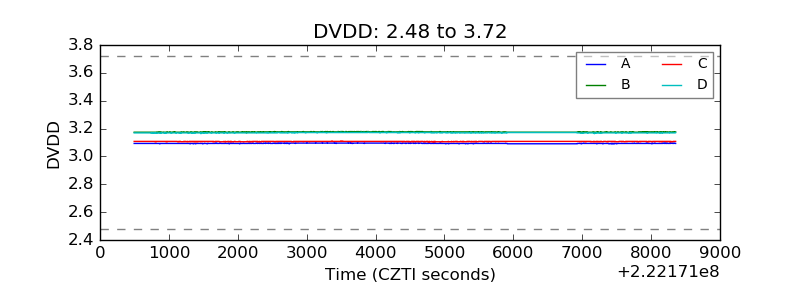 |
| Temperature 1 | 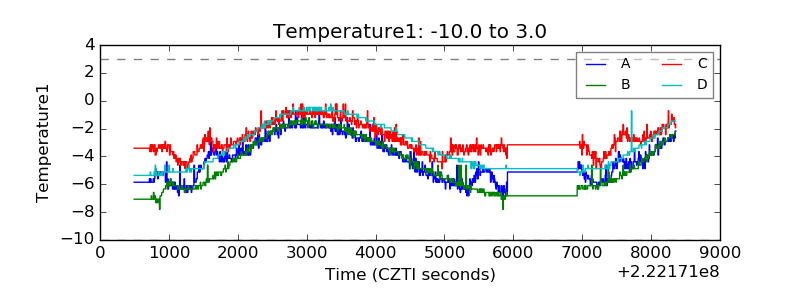 |
| Veto HV Monitor | 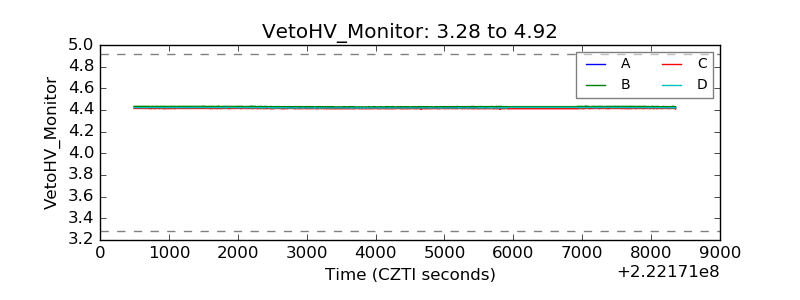 |
| Veto LLD | 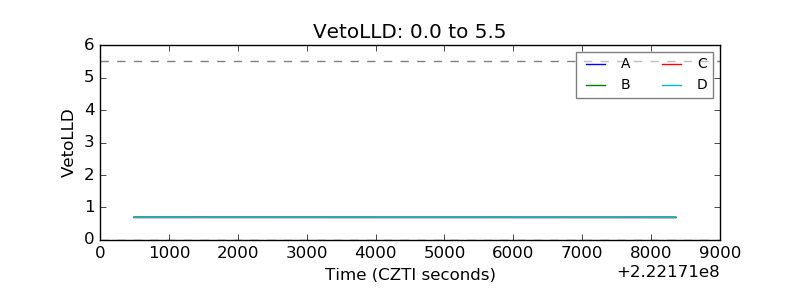 |
| Alpha Counter | 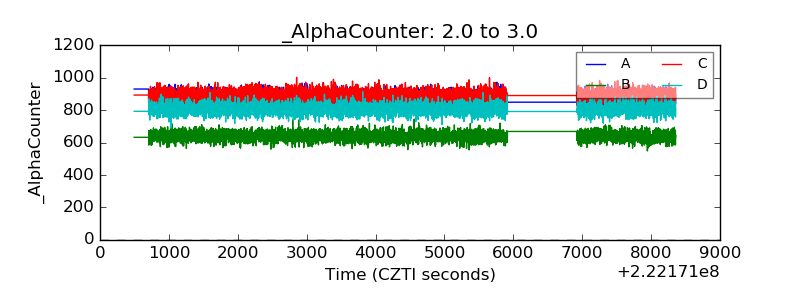 |
| _CPM_Rate | 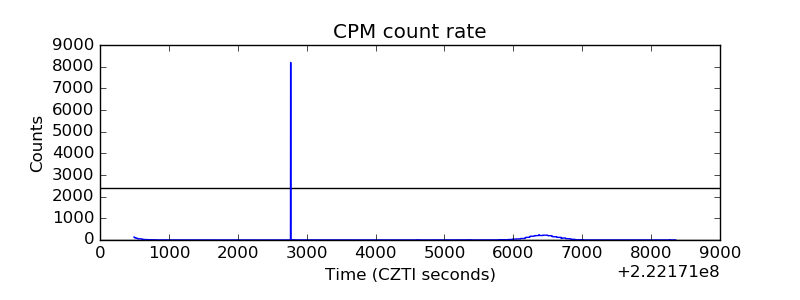 |
| CZT Counter | 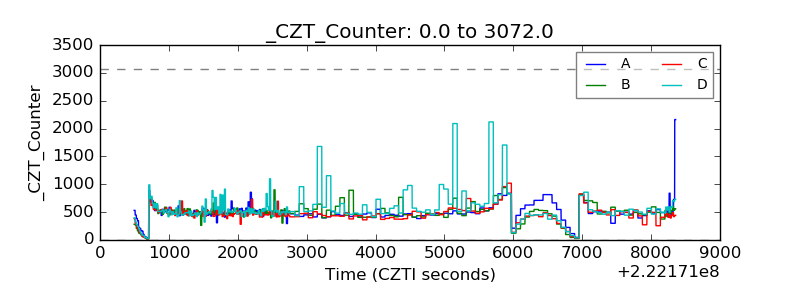 |
| +2.5 Volts monitor |  |
| +5 Volts monitor |  |
| _ROLL_ROT | 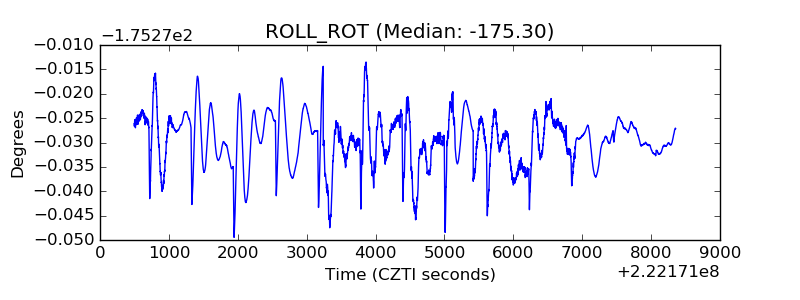 |
| _Roll_DEC | 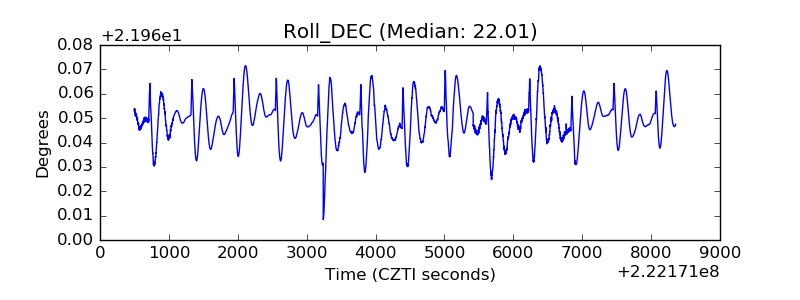 |
| _Roll_RA | 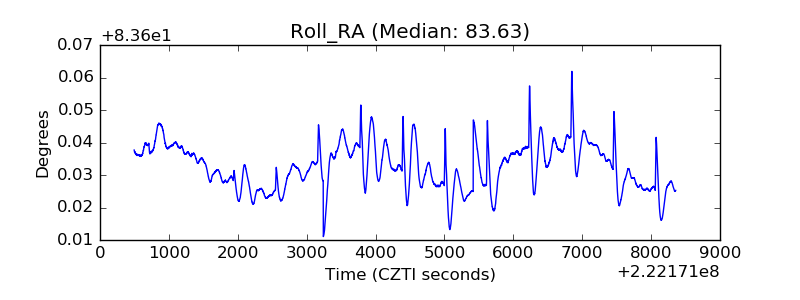 |
| Veto Counter | 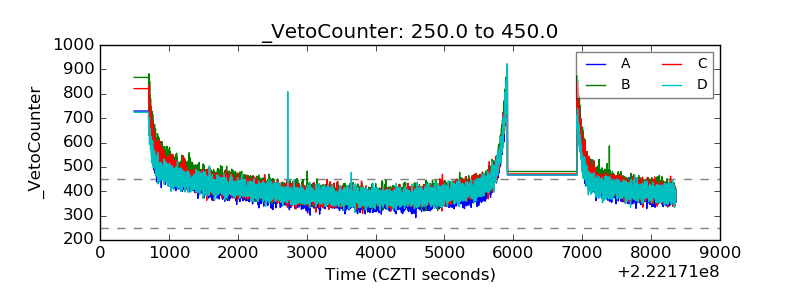 |