| Param | Original file | Final file |
|---|---|---|
| Filename | modeM0/AS1G06_029T01_9000000964_07037cztM0_level2.evt | modeM0/AS1G06_029T01_9000000964_07037cztM0_level2_quad_clean.evt |
| Size (bytes) | 472,691,520 | 95,817,600 |
| Size | 450.8 MB | 91.4 MB |
| Events in quadrant A | 3,136,014 | 628,466 |
| Events in quadrant B | 3,294,246 | 630,280 |
| Events in quadrant C | 2,980,146 | 626,415 |
| Events in quadrant D | 4,476,138 | 576,047 |
| Mode M0 | |||
|---|---|---|---|
| Quadrant | BADHDUFLAG | Total packets | Discarded packets |
| A | 0 | 13340 | 2 |
| B | 0 | 13624 | 1 |
| C | 0 | 12962 | 1 |
| D | 0 | 17131 | 1 |
| Mode M9 | |||
|---|---|---|---|
| Quadrant | BADHDUFLAG | Total packets | Discarded packets |
| A | 0 | 7 | 0 |
| B | 0 | 7 | 0 |
| C | 0 | 7 | 0 |
| D | 0 | 7 | 0 |
| Mode SS | |||
|---|---|---|---|
| Quadrant | BADHDUFLAG | Total packets | Discarded packets |
| A | 0 | 128 | 0 |
| B | 0 | 128 | 0 |
| C | 0 | 128 | 0 |
| D | 0 | 128 | 0 |
| Quadrant | Total seconds | Saturated seconds | Saturation percentage |
|---|---|---|---|
| A | 6312 | 160 | 2.534854% |
| B | 6312 | 219 | 3.469582% |
| C | 6312 | 97 | 1.536755% |
| D | 6312 | 469 | 7.430292% |
Noise dominated data is calculated using 1-second bins in cleaned event files. If a bin has >2000 counts, and if more than 50% of those come from <1% of pixels, then it is considered to be noise-dominated and hence unusable.
| Quadrant | # 1 sec bins | Bins with >0 counts | Bins with >2000 counts | High rate bins dominated by noise | Noise dominated (total time) | Noise dominated (detector-on time) | Marked lightcurve |
|---|---|---|---|---|---|---|---|
| A | 6992 | 6313 | 20 | 20 | 0.29% | 0.32% | 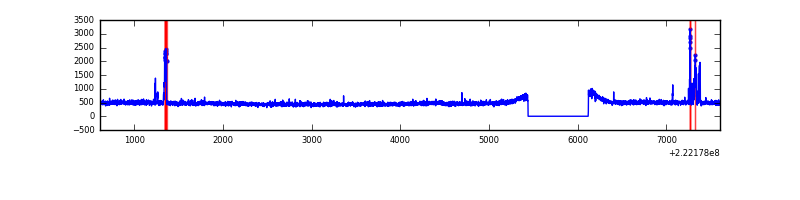 |
| B | 6992 | 6313 | 58 | 58 | 0.83% | 0.92% | 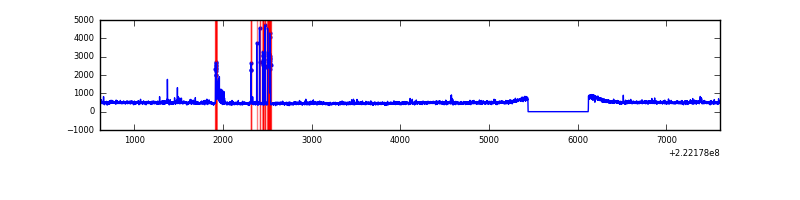 |
| C | 6992 | 6313 | 0 | 0 | 0.00% | 0.00% | 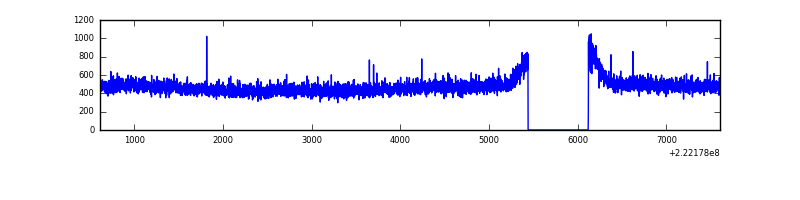 |
| D | 6992 | 6313 | 332 | 332 | 4.75% | 5.26% | 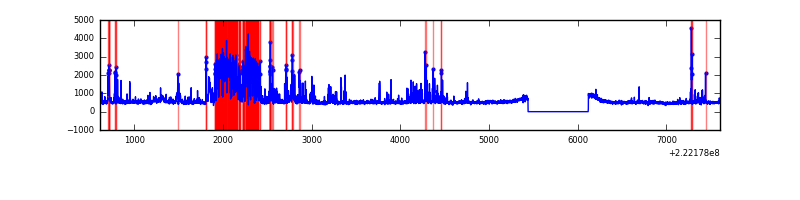 |
Top three noisy pixels from each quadrant. If the there are fewer than three noisy pixels in the level2.evt file, extra rows are filled as -1
| Pixel properties | Quadrant properties | ||||||
|---|---|---|---|---|---|---|---|
| Quadrant | DetID | PixID | Counts | Sigma | Mean | Median | Sigma |
| A | 15 | 234 | 130862 | 810.58 | 779 | 764 | 160.5 |
| A | 0 | 226 | 7418 | 41.46 | 779 | 764 | 160.5 |
| A | 12 | 194 | 6964 | 38.63 | 779 | 764 | 160.5 |
| B | 0 | 228 | 147173 | 981.07 | 779 | 762 | 149.2 |
| B | 4 | 80 | 57754 | 381.89 | 779 | 762 | 149.2 |
| B | 0 | 219 | 33481 | 219.24 | 779 | 762 | 149.2 |
| C | 1 | 16 | 29763 | 163.73 | 756 | 763 | 177.1 |
| C | 13 | 61 | 5872 | 28.84 | 756 | 763 | 177.1 |
| C | 12 | 4 | 2457 | 9.56 | 756 | 763 | 177.1 |
| D | 12 | 233 | 796447 | 4318.87 | 742 | 721 | 184.2 |
| D | 2 | 216 | 395957 | 2145.18 | 742 | 721 | 184.2 |
| D | 8 | 195 | 267598 | 1448.5 | 742 | 721 | 184.2 |
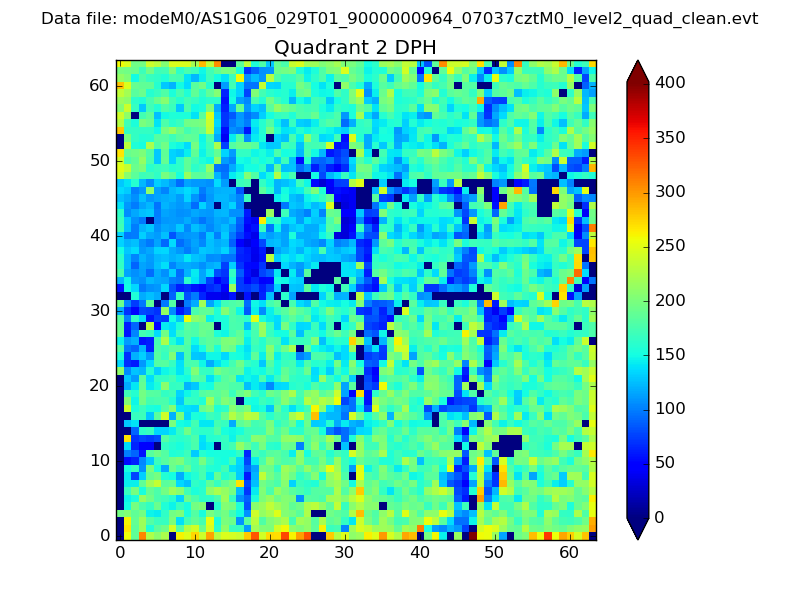
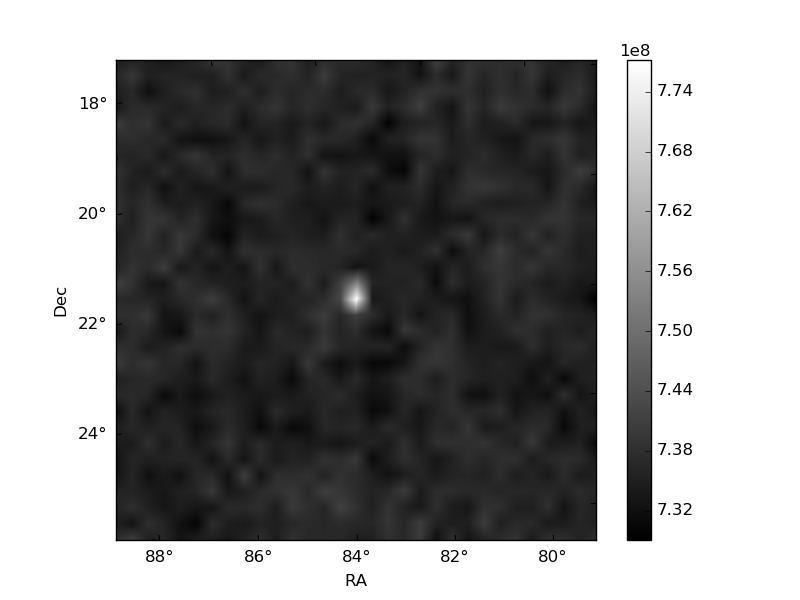
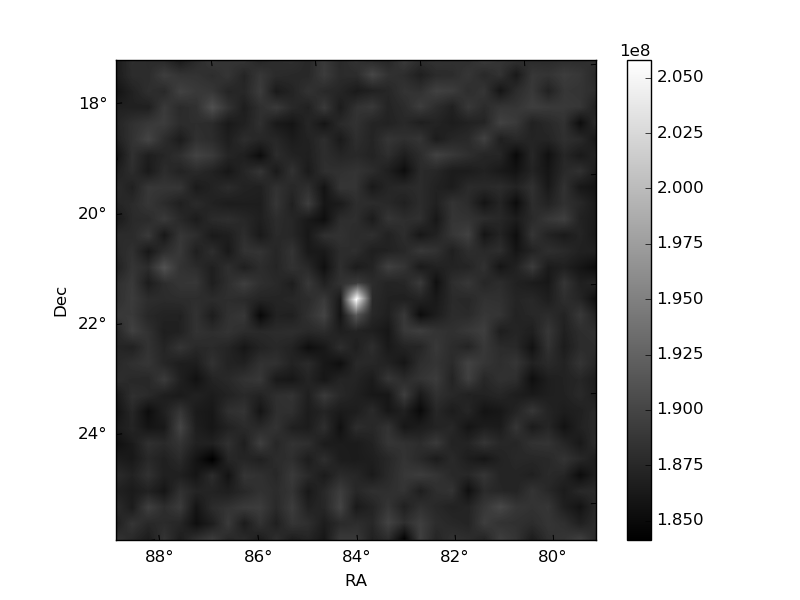
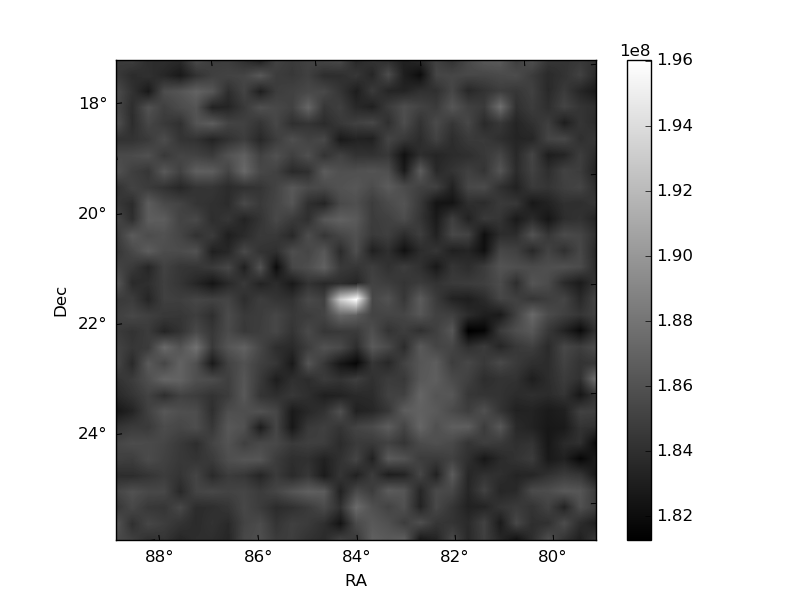
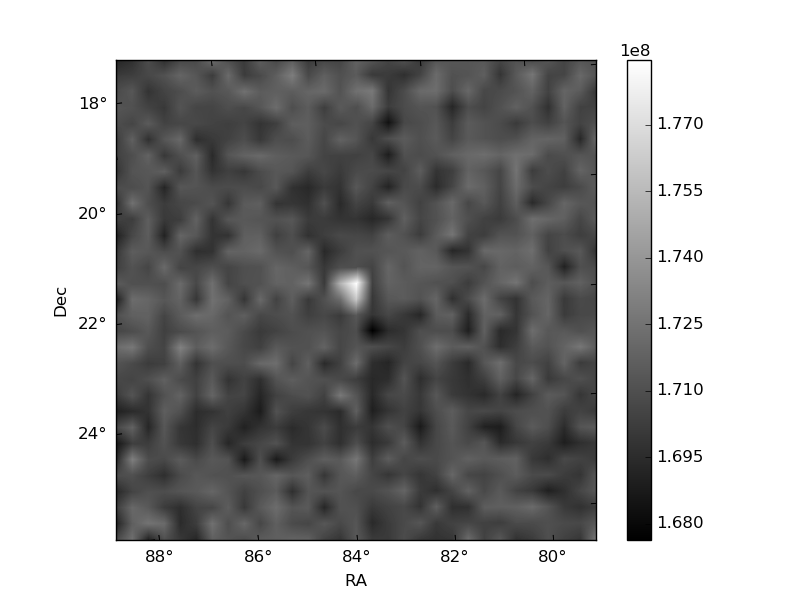
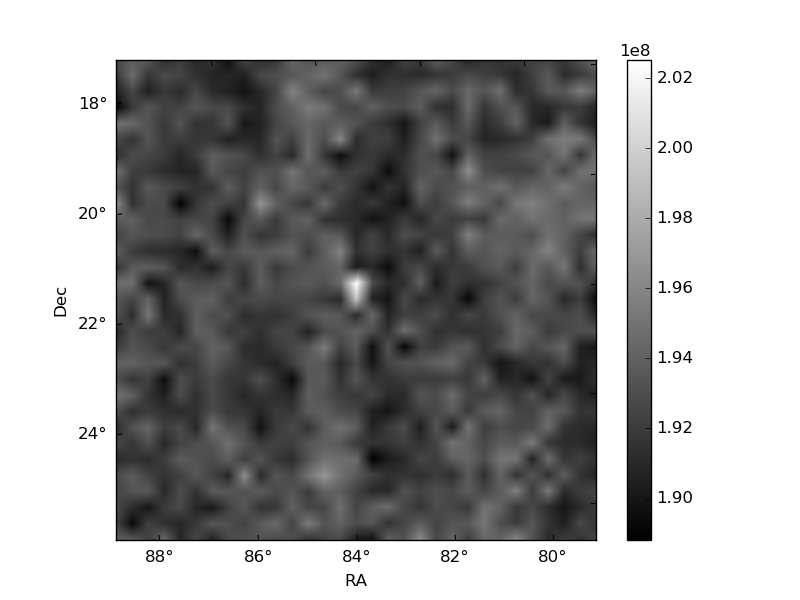
Histogram calculated using DETX and DETY for each event in the final _common_clean file
| Quadrant A | 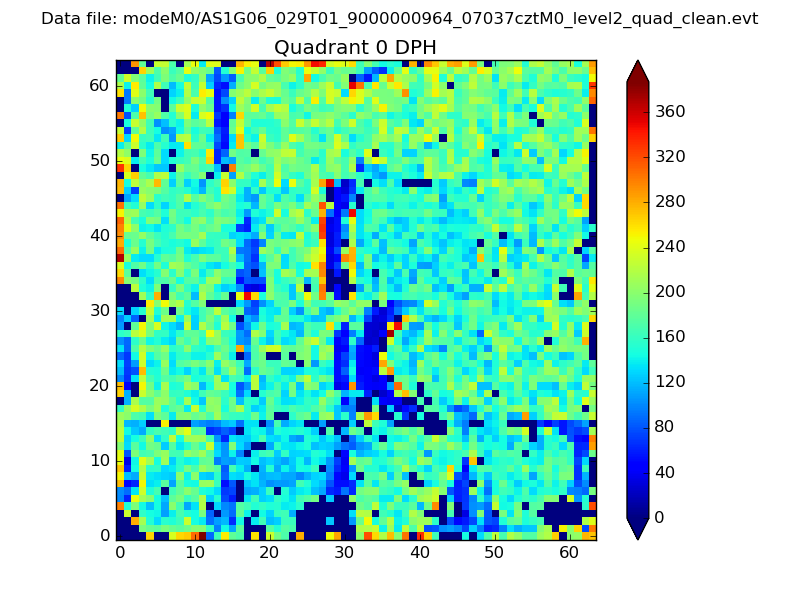 |
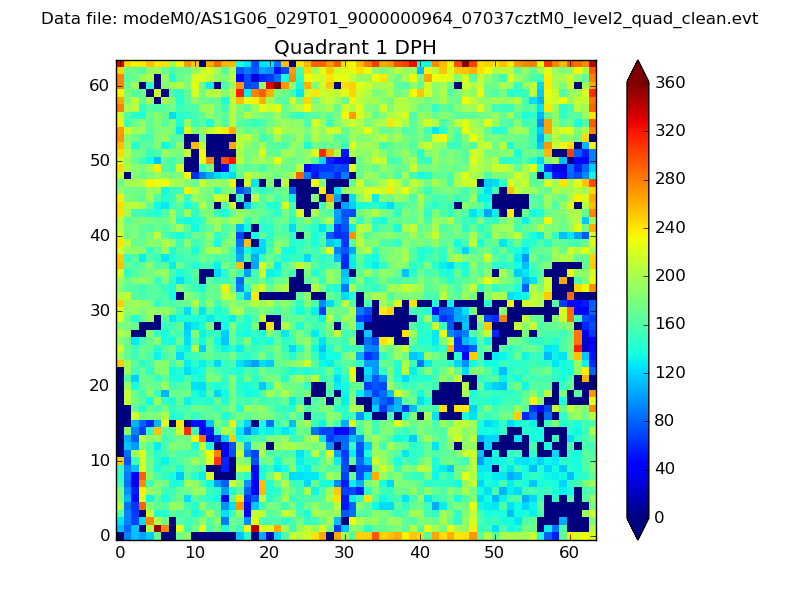 |
Quadrant B |
|---|---|---|---|
| Quadrant D | 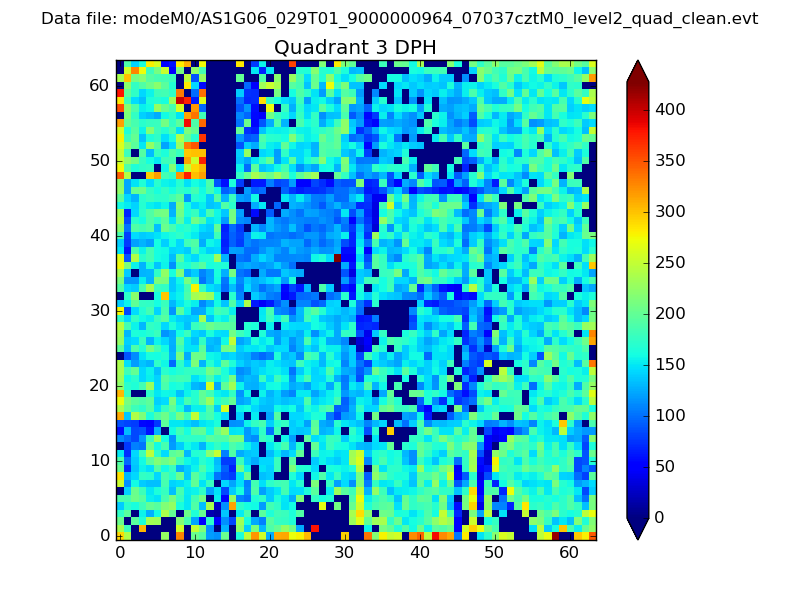 |
 |
Quadrant C |
| Plot type | Count rate plots | Images |
|---|---|---|
| Comparison with Poisson distribution Blue bars denote a histogram of data divided into 1 sec bins. Red curve is a Poisson curve with rate = median count rate of data. |
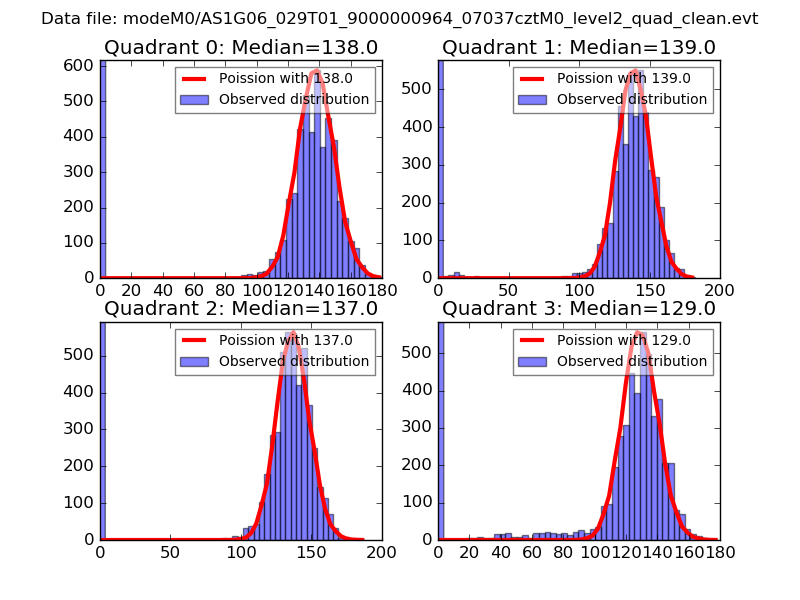 |
 |
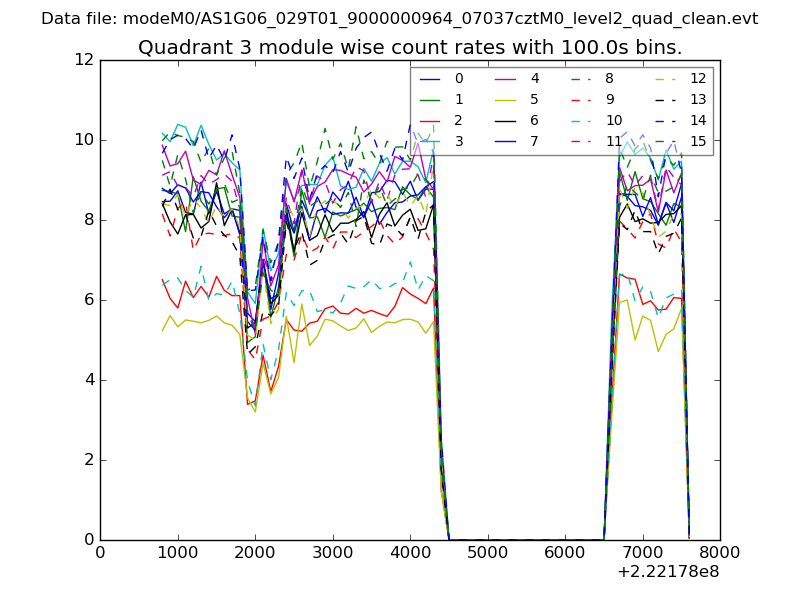
| Quadrant-wise count rates Data is divided into 100 sec bins |
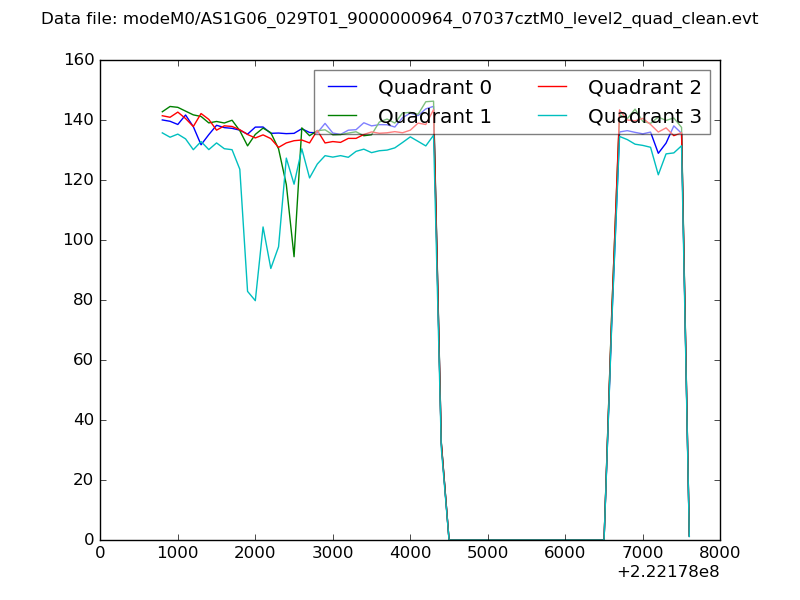 |
|
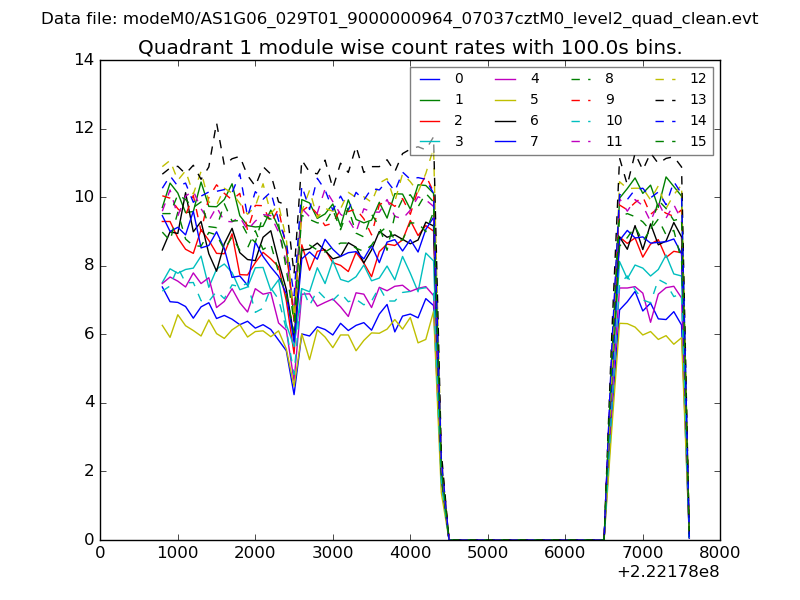
| Module-wise count rates for Quadrant A Data is divided into 100 sec bins |
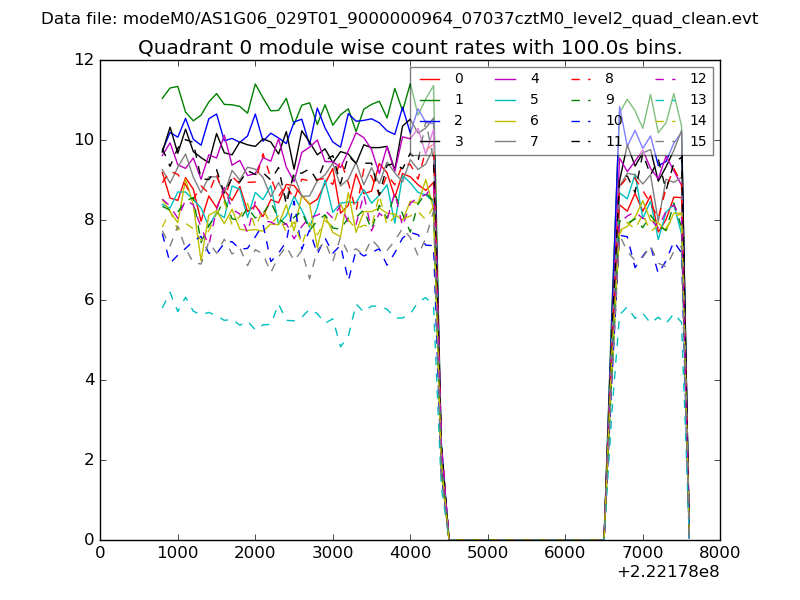 |
 |
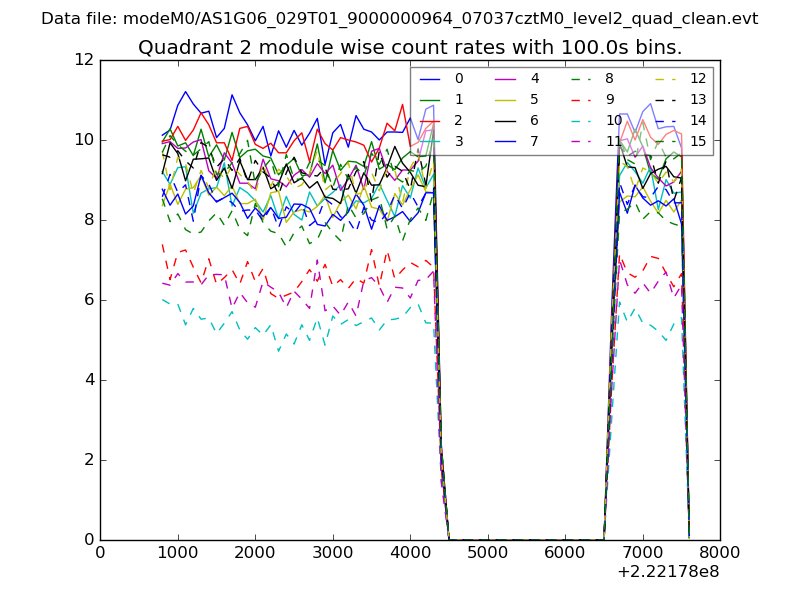
| Module-wise count rates for Quadrant B Data is divided into 100 sec bins |
 |
 |
| Module-wise count rates for Quadrant C Data is divided into 100 sec bins |
 |
 |
| Module-wise count rates for Quadrant D Data is divided into 100 sec bins |
 |
 |
| Parameter | Plot |
|---|---|
| CZT HV Monitor | 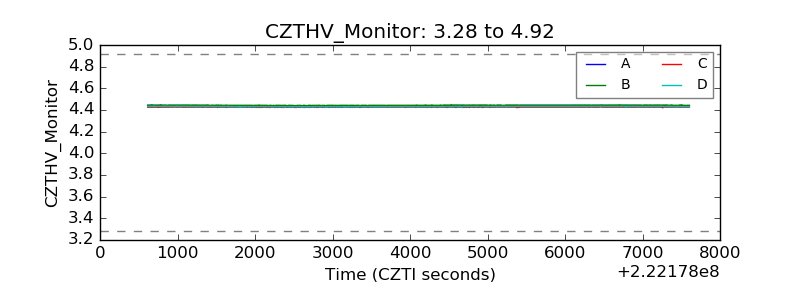 |
| D_VDD | 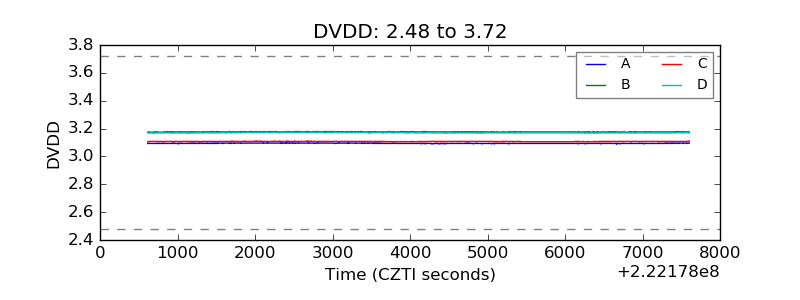 |
| Temperature 1 | 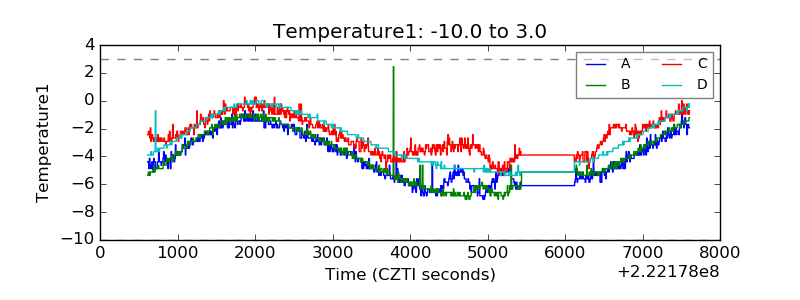 |
| Veto HV Monitor | 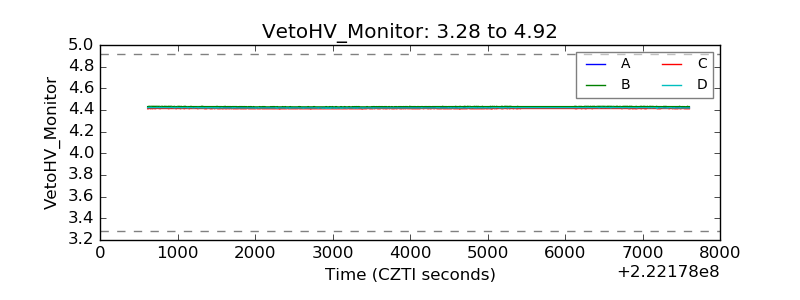 |
| Veto LLD | 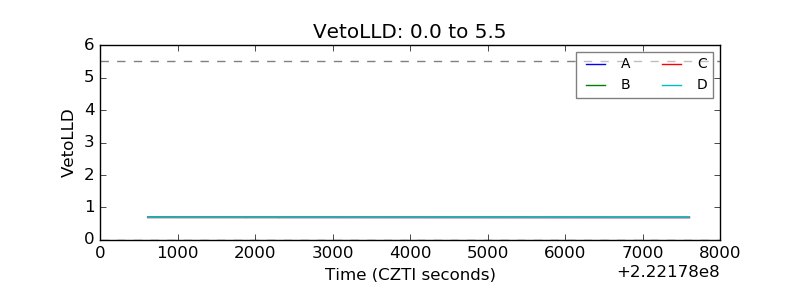 |
| Alpha Counter | 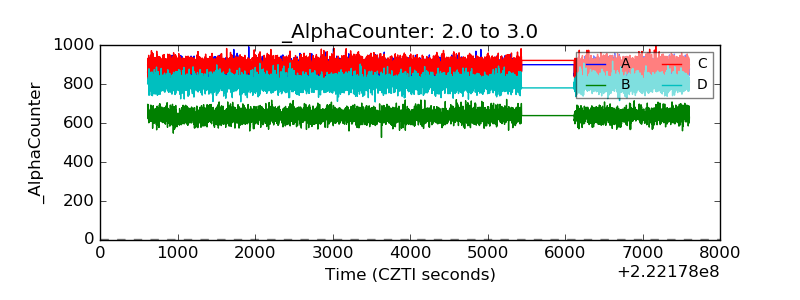 |
| _CPM_Rate | 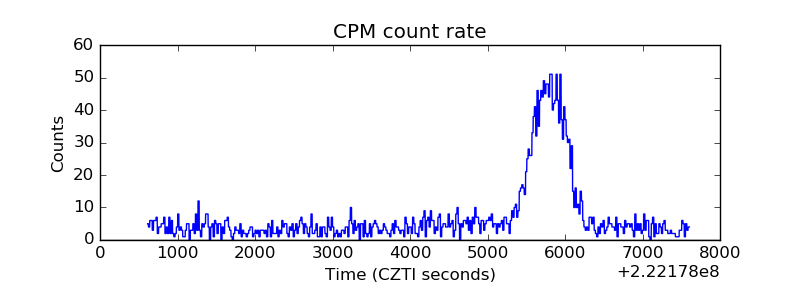 |
| CZT Counter | 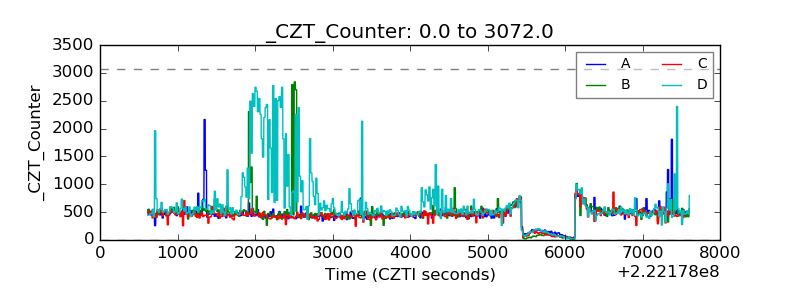 |
| +2.5 Volts monitor |  |
| +5 Volts monitor |  |
| _ROLL_ROT | 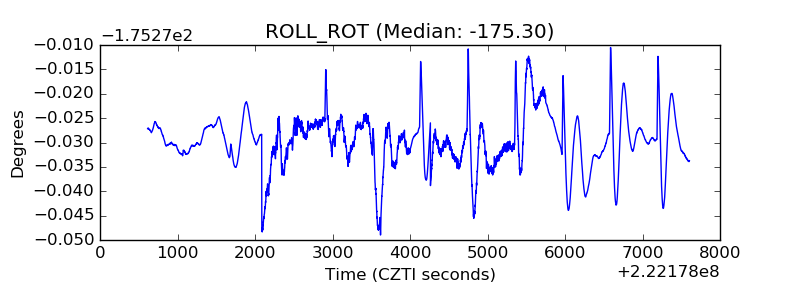 |
| _Roll_DEC | 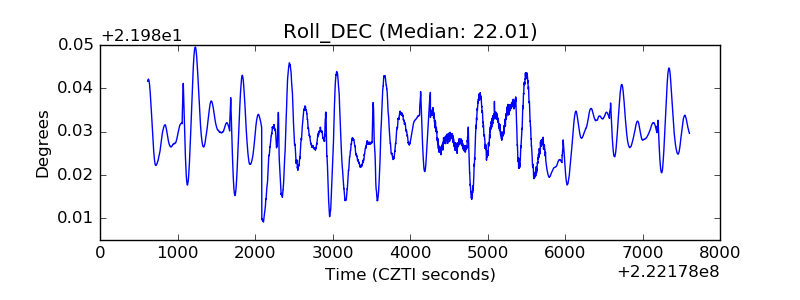 |
| _Roll_RA | 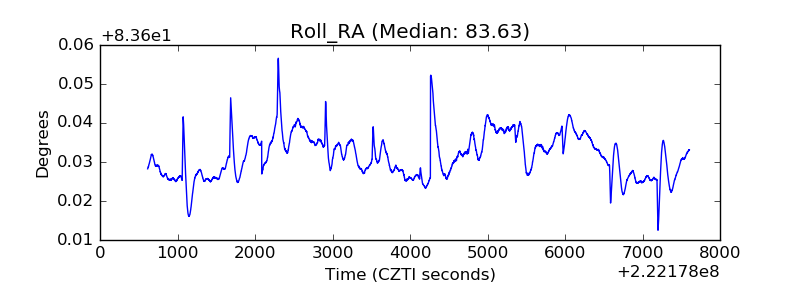 |
| Veto Counter | 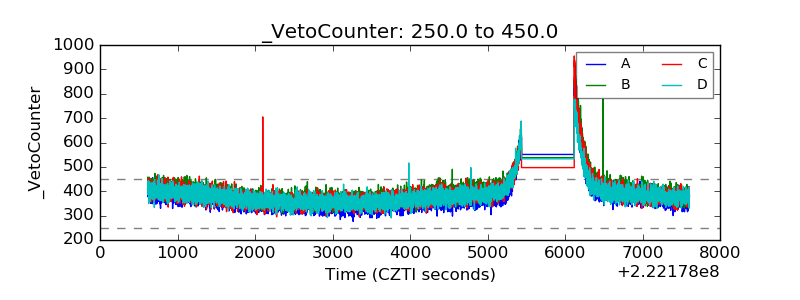 |