| Param | Original file | Final file |
|---|---|---|
| Filename | modeM0/AS1G06_029T01_9000000964_07038cztM0_level2.evt | modeM0/AS1G06_029T01_9000000964_07038cztM0_level2_quad_clean.evt |
| Size (bytes) | 497,623,680 | 104,497,920 |
| Size | 474.6 MB | 99.7 MB |
| Events in quadrant A | 3,498,804 | 677,780 |
| Events in quadrant B | 3,652,302 | 684,380 |
| Events in quadrant C | 3,312,445 | 678,487 |
| Events in quadrant D | 4,133,670 | 638,675 |
| Mode M0 | |||
|---|---|---|---|
| Quadrant | BADHDUFLAG | Total packets | Discarded packets |
| A | 0 | 14975 | 2 |
| B | 0 | 15088 | 1 |
| C | 0 | 14421 | 1 |
| D | 0 | 16616 | 1 |
| Mode M9 | |||
|---|---|---|---|
| Quadrant | BADHDUFLAG | Total packets | Discarded packets |
| A | 0 | 3 | 0 |
| B | 0 | 3 | 0 |
| C | 0 | 3 | 0 |
| D | 0 | 3 | 0 |
| Mode SS | |||
|---|---|---|---|
| Quadrant | BADHDUFLAG | Total packets | Discarded packets |
| A | 0 | 140 | 0 |
| B | 0 | 140 | 0 |
| C | 0 | 140 | 0 |
| D | 0 | 140 | 0 |
| Quadrant | Total seconds | Saturated seconds | Saturation percentage |
|---|---|---|---|
| A | 6974 | 188 | 2.695727% |
| B | 6974 | 189 | 2.710066% |
| C | 6974 | 81 | 1.161457% |
| D | 6974 | 191 | 2.738744% |
Noise dominated data is calculated using 1-second bins in cleaned event files. If a bin has >2000 counts, and if more than 50% of those come from <1% of pixels, then it is considered to be noise-dominated and hence unusable.
| Quadrant | # 1 sec bins | Bins with >0 counts | Bins with >2000 counts | High rate bins dominated by noise | Noise dominated (total time) | Noise dominated (detector-on time) | Marked lightcurve |
|---|---|---|---|---|---|---|---|
| A | 7244 | 6975 | 8 | 8 | 0.11% | 0.11% | 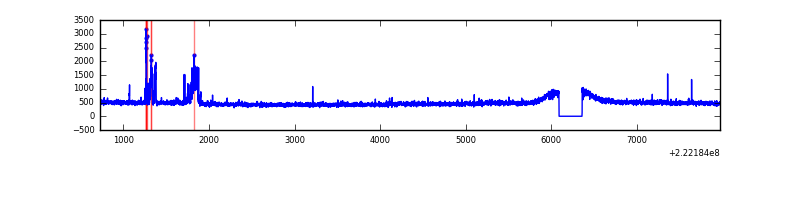 |
| B | 7244 | 6975 | 19 | 19 | 0.26% | 0.27% |  |
| C | 7244 | 6975 | 0 | 0 | 0.00% | 0.00% | 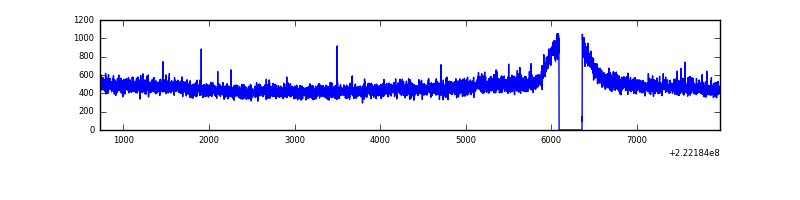 |
| D | 7244 | 6975 | 61 | 61 | 0.84% | 0.87% | 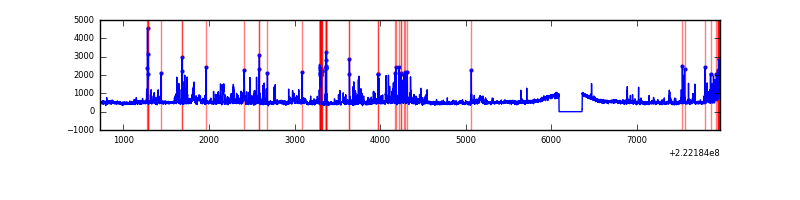 |
Top three noisy pixels from each quadrant. If the there are fewer than three noisy pixels in the level2.evt file, extra rows are filled as -1
| Pixel properties | Quadrant properties | ||||||
|---|---|---|---|---|---|---|---|
| Quadrant | DetID | PixID | Counts | Sigma | Mean | Median | Sigma |
| A | 15 | 234 | 170855 | 940.71 | 864 | 846 | 180.7 |
| A | 0 | 226 | 8335 | 41.44 | 864 | 846 | 180.7 |
| A | 12 | 194 | 8012 | 39.65 | 864 | 846 | 180.7 |
| B | 4 | 239 | 155261 | 917.79 | 866 | 849 | 168.2 |
| B | 0 | 214 | 70798 | 415.76 | 866 | 849 | 168.2 |
| B | 0 | 219 | 35668 | 206.96 | 866 | 849 | 168.2 |
| C | 1 | 16 | 31882 | 158.69 | 837 | 843 | 195.6 |
| C | 14 | 67 | 10705 | 50.42 | 837 | 843 | 195.6 |
| C | 13 | 61 | 6522 | 29.03 | 837 | 843 | 195.6 |
| D | 2 | 216 | 421291 | 2022.68 | 838 | 814 | 207.9 |
| D | 8 | 195 | 268820 | 1289.23 | 838 | 814 | 207.9 |
| D | 6 | 225 | 131709 | 629.66 | 838 | 814 | 207.9 |
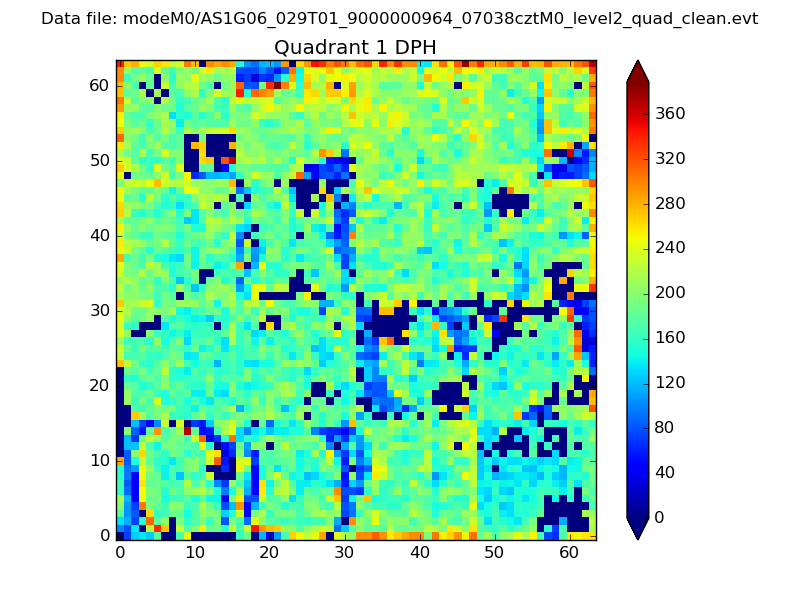
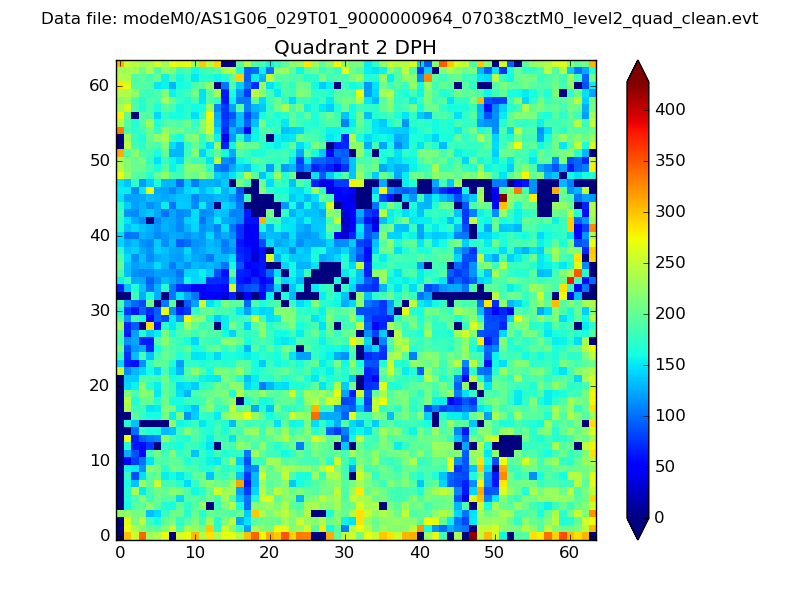
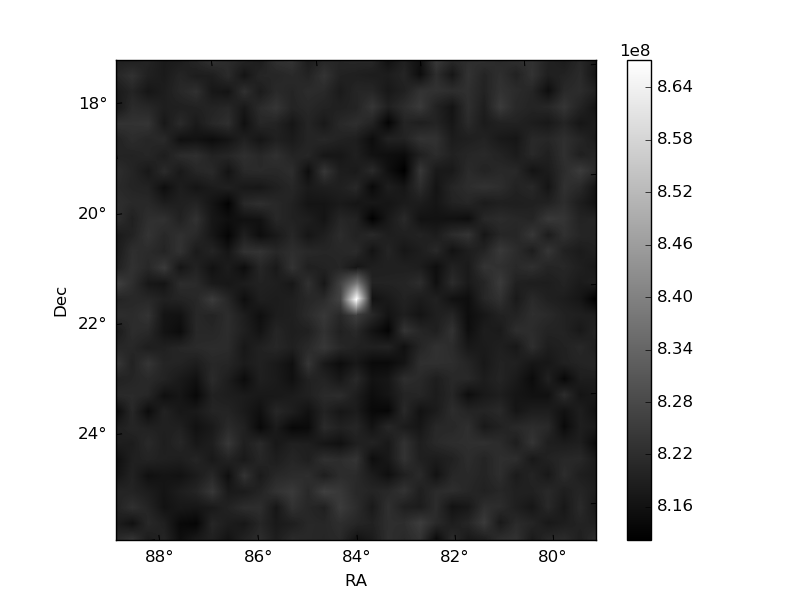
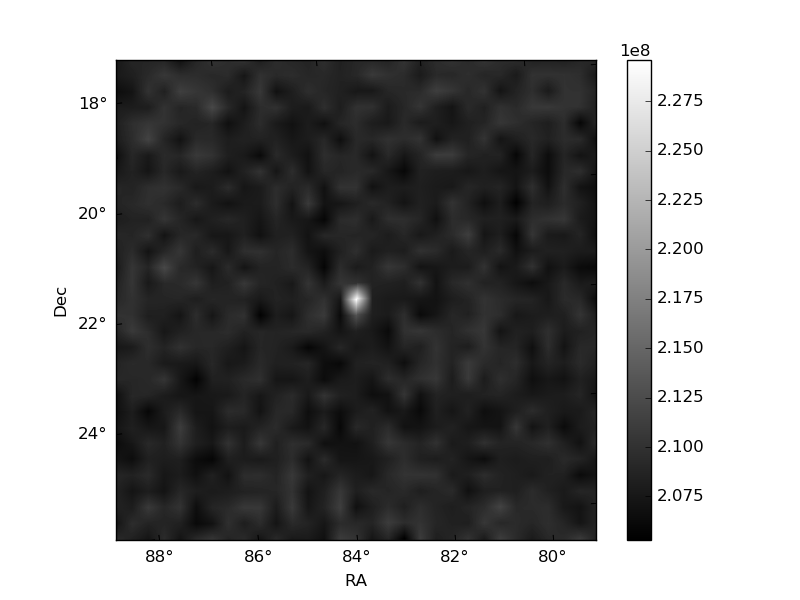
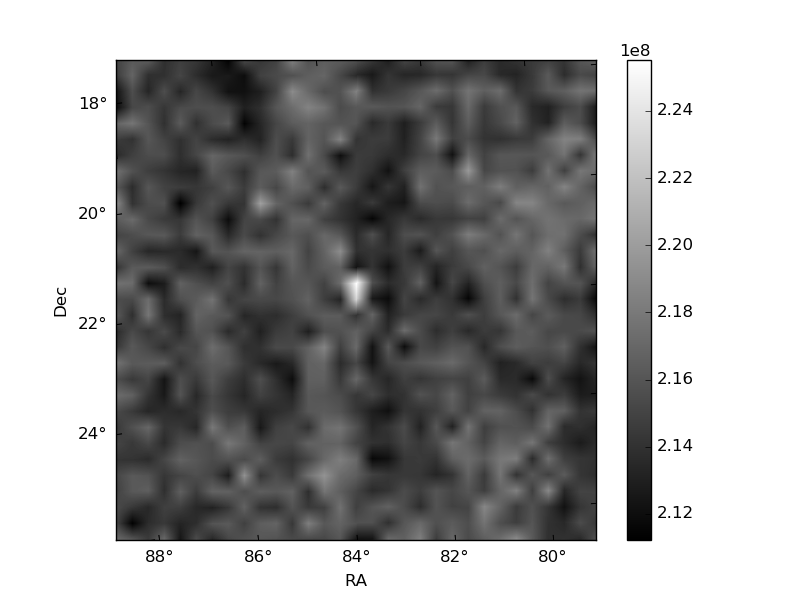
Histogram calculated using DETX and DETY for each event in the final _common_clean file
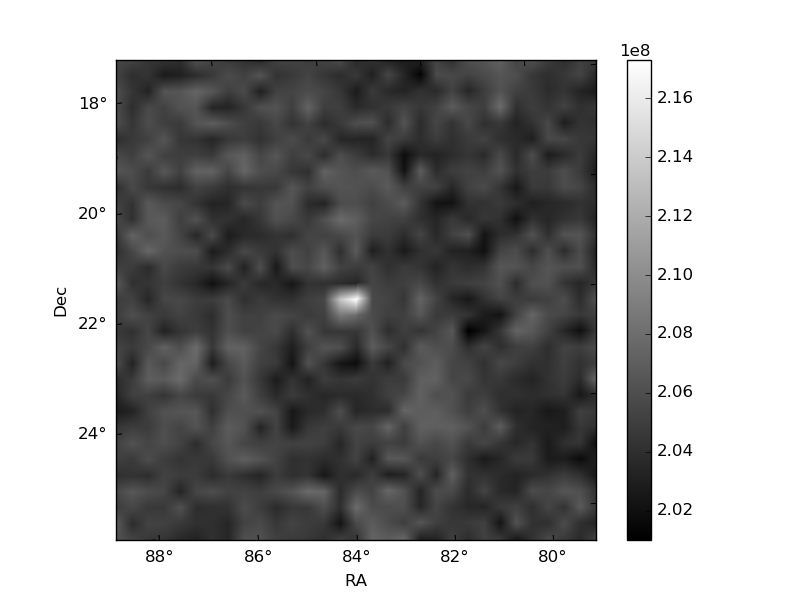
| Quadrant A | 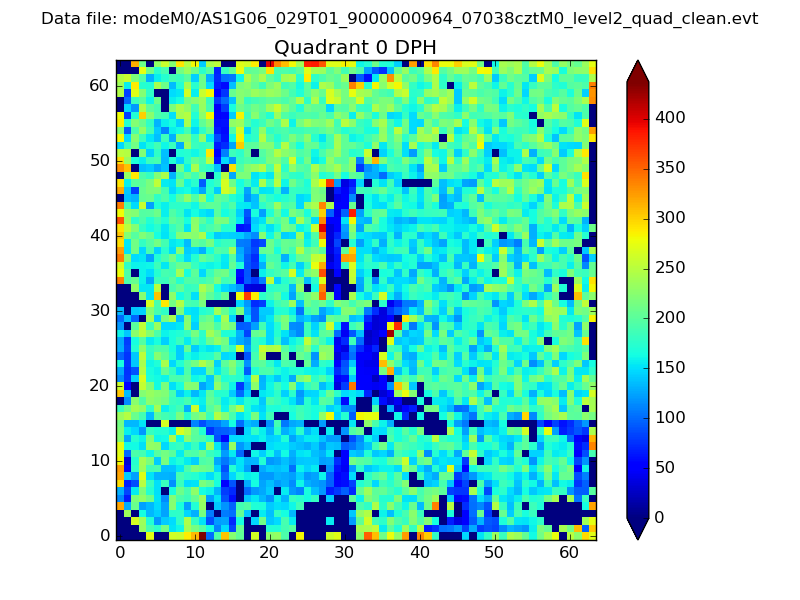 |
 |
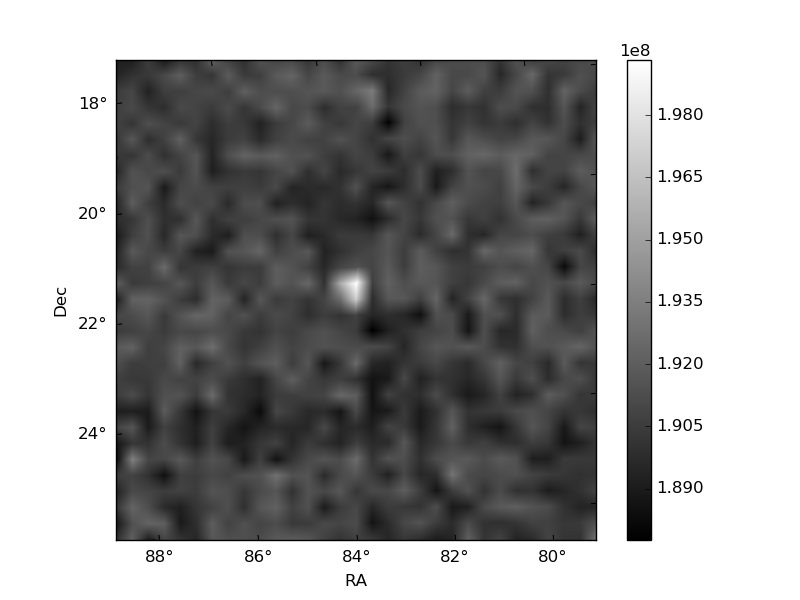
Quadrant B |
|---|---|---|---|
| Quadrant D | 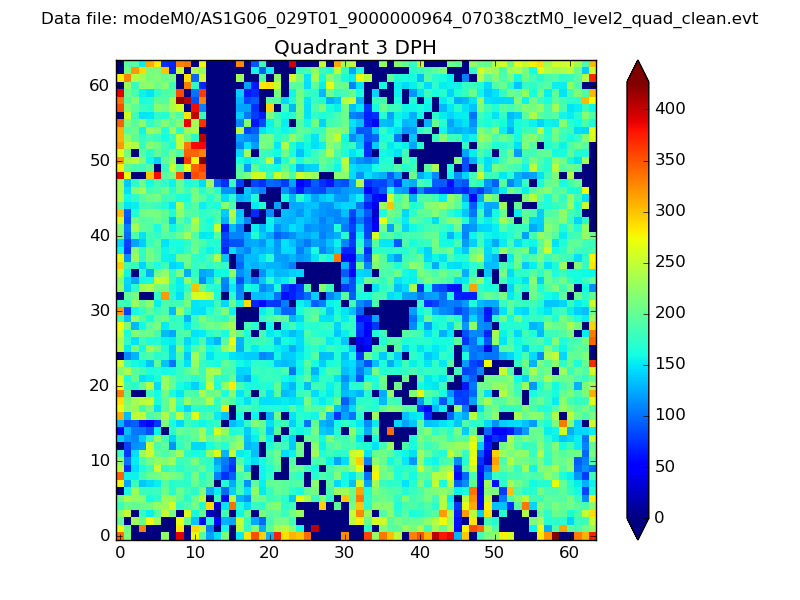 |
 |
Quadrant C |
| Plot type | Count rate plots | Images |
|---|---|---|
| Comparison with Poisson distribution Blue bars denote a histogram of data divided into 1 sec bins. Red curve is a Poisson curve with rate = median count rate of data. |
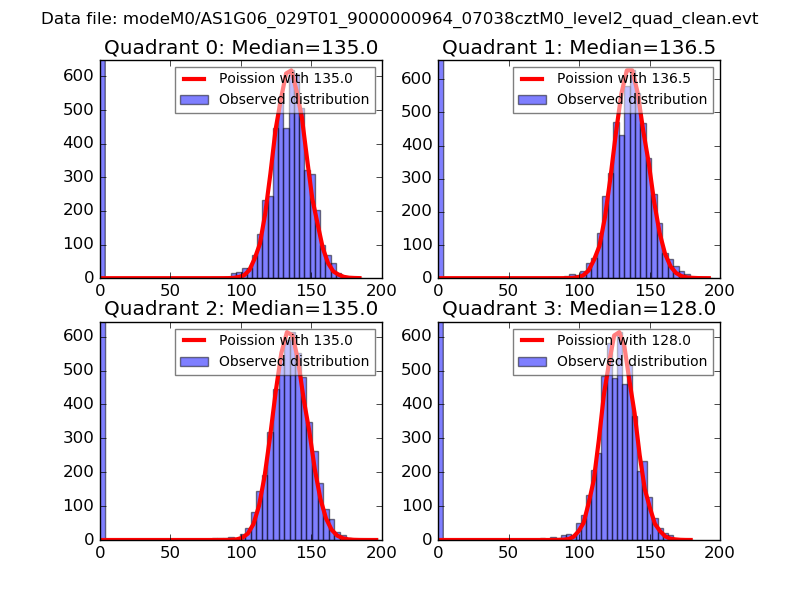 |
 |
| Quadrant-wise count rates Data is divided into 100 sec bins |
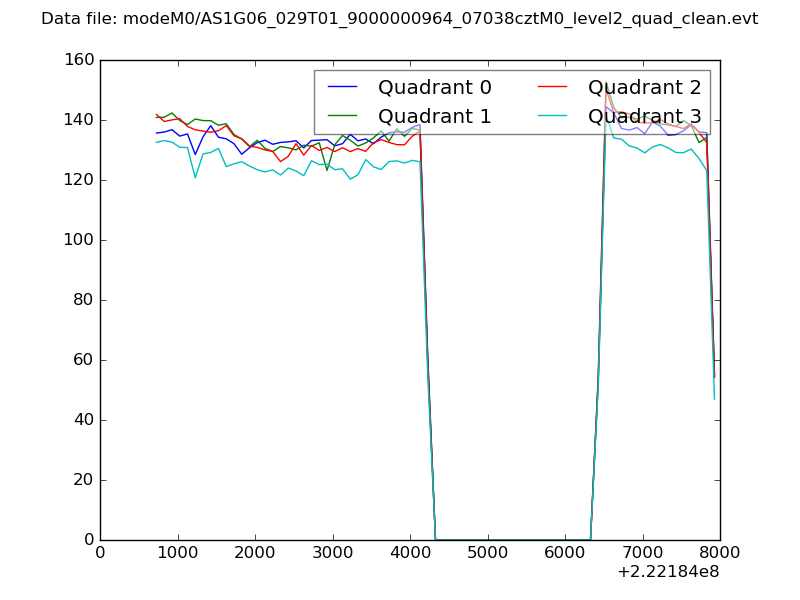 |
|
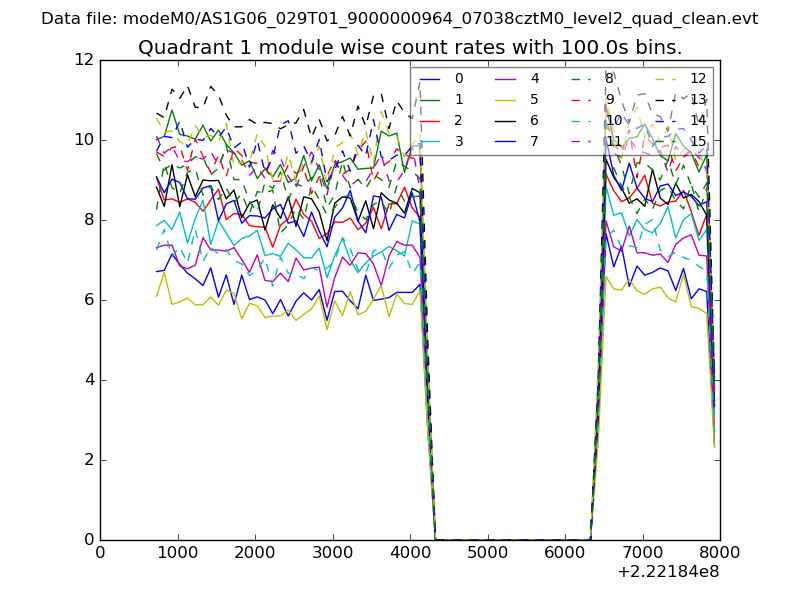
| Module-wise count rates for Quadrant A Data is divided into 100 sec bins |
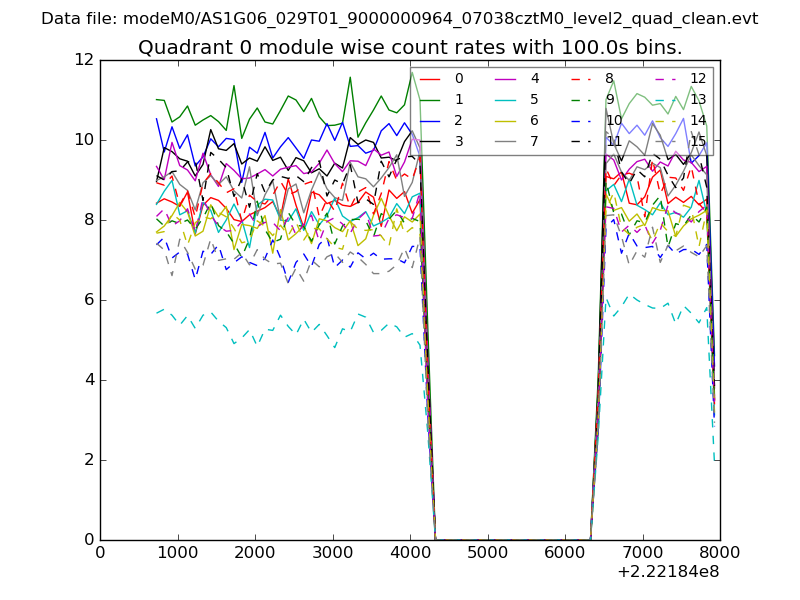 |
 |
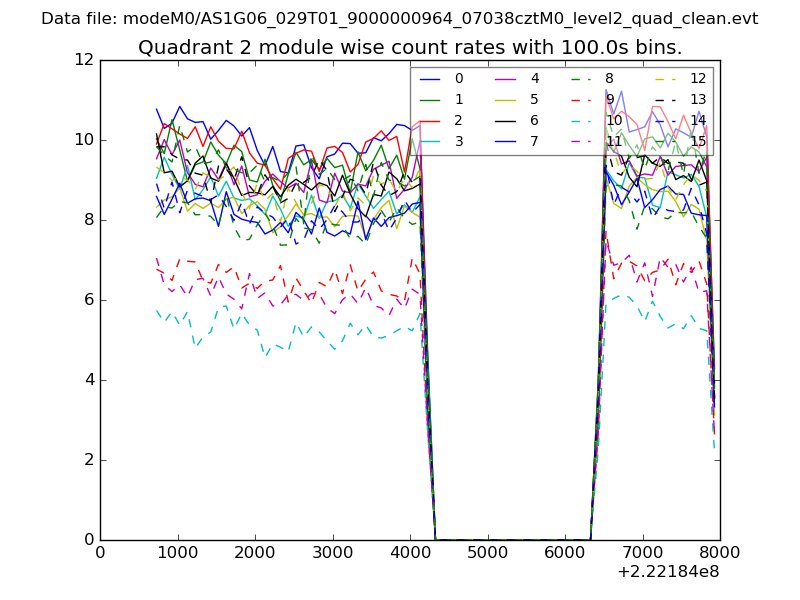
| Module-wise count rates for Quadrant B Data is divided into 100 sec bins |
 |
 |
| Module-wise count rates for Quadrant C Data is divided into 100 sec bins |
 |
 |
| Module-wise count rates for Quadrant D Data is divided into 100 sec bins |
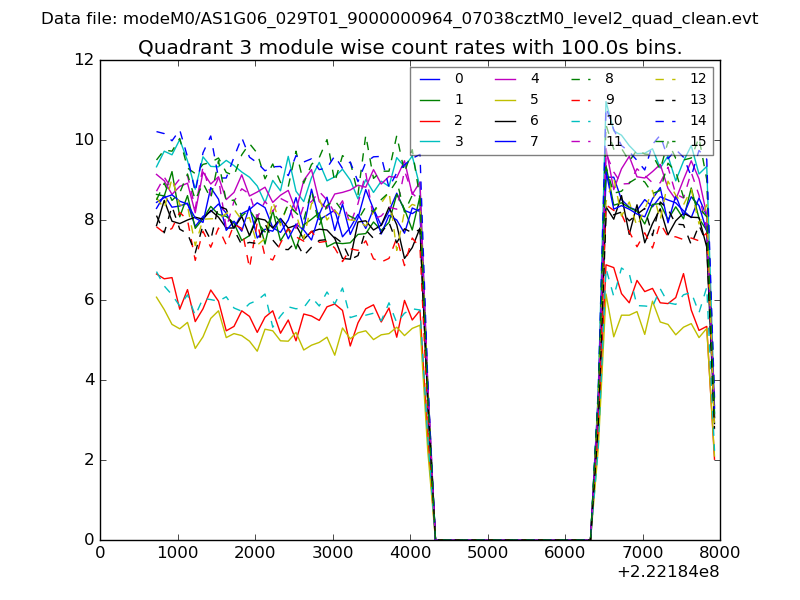 |
 |
| Parameter | Plot |
|---|---|
| CZT HV Monitor | 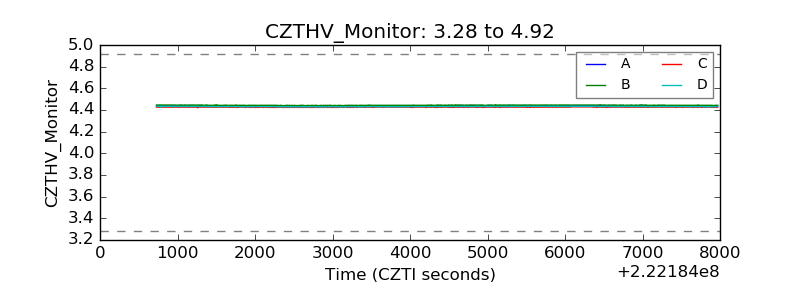 |
| D_VDD | 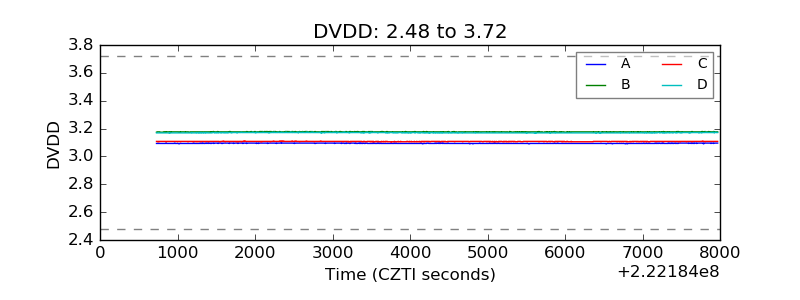 |
| Temperature 1 | 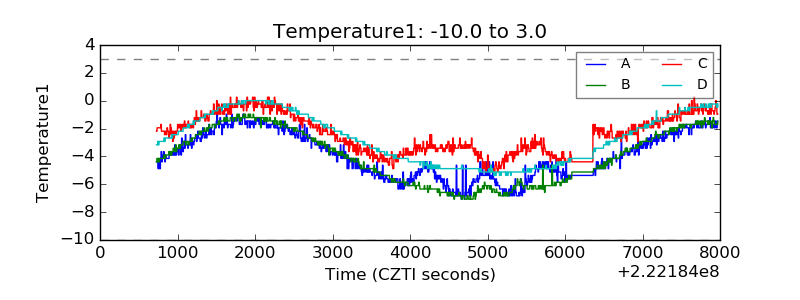 |
| Veto HV Monitor | 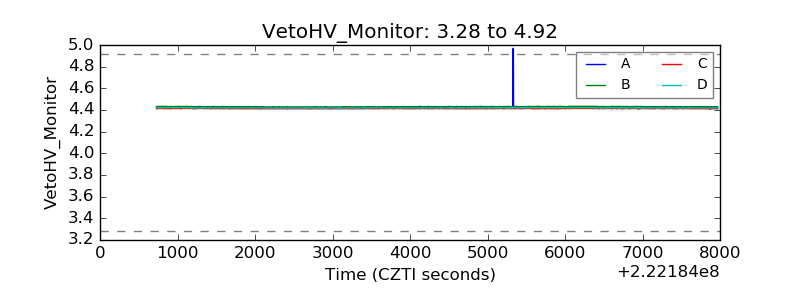 |
| Veto LLD | 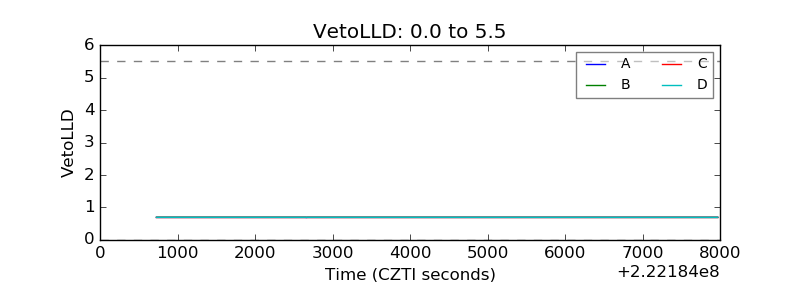 |
| Alpha Counter | 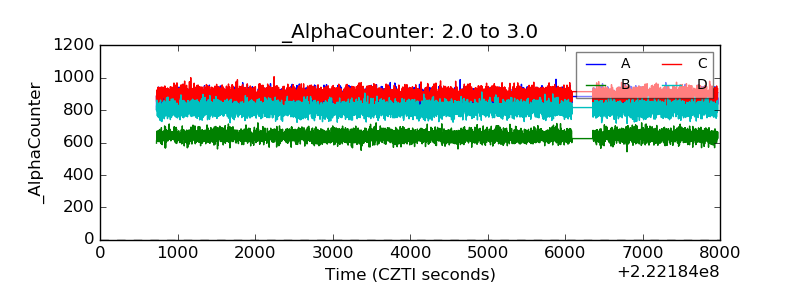 |
| _CPM_Rate | 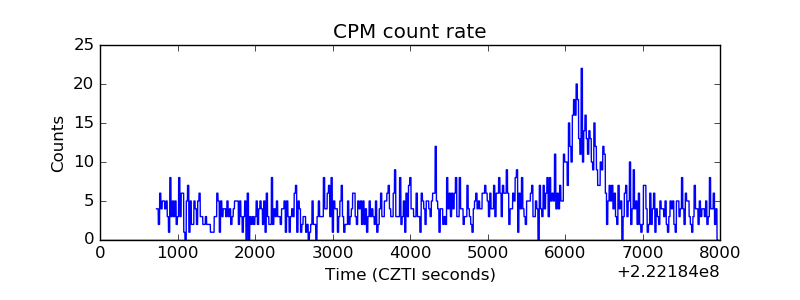 |
| CZT Counter | 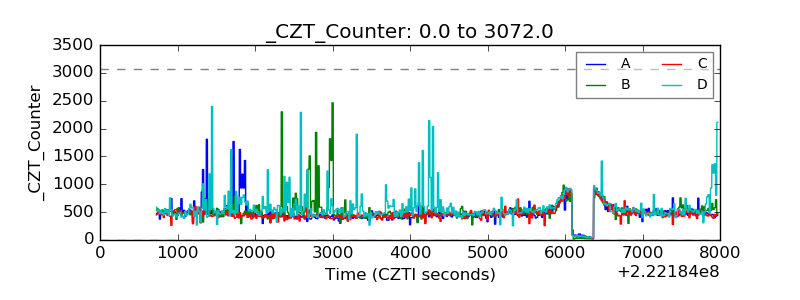 |
| +2.5 Volts monitor |  |
| +5 Volts monitor |  |
| _ROLL_ROT | 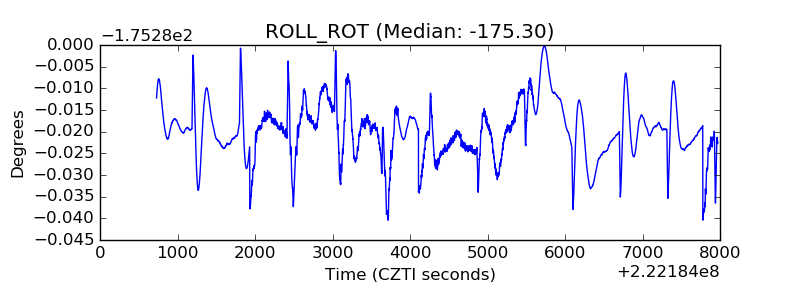 |
| _Roll_DEC | 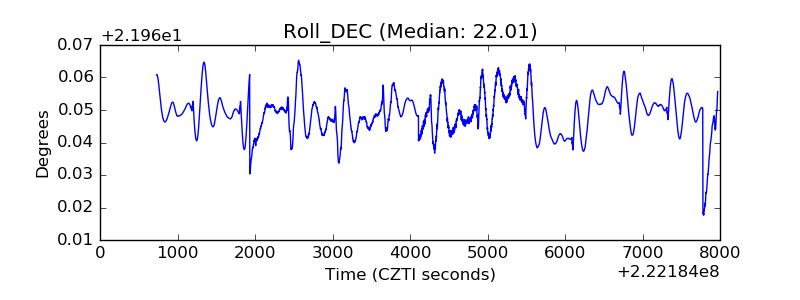 |
| _Roll_RA | 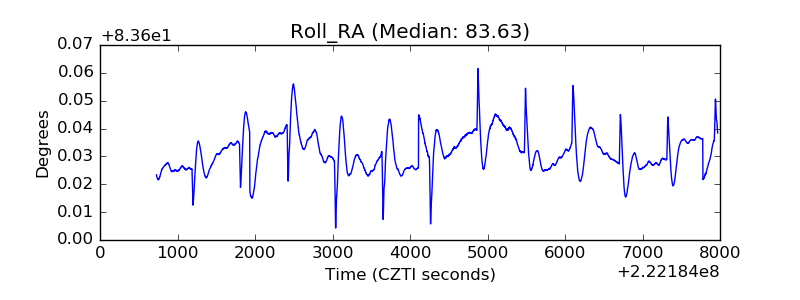 |
| Veto Counter | 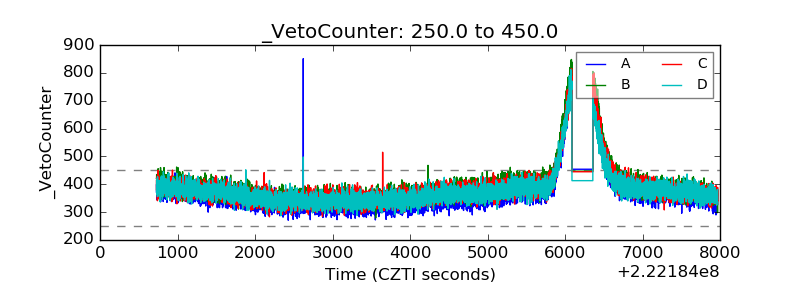 |